An interesting 6MV high-resolution example
As far as one can speak of high resolution with 1 cm leaf width ;-), the following is what we can achieve regarding high spatial resolution with our beam model. A 6MV head&neck IMRT plan was recalculated in Eclipse with a grid setting of 1.25 mm (using AAA 10.0.28 and our sharp semiconductor beam data), and measured in MIX mode. Analysis was done in EPIQA 2.1.2.
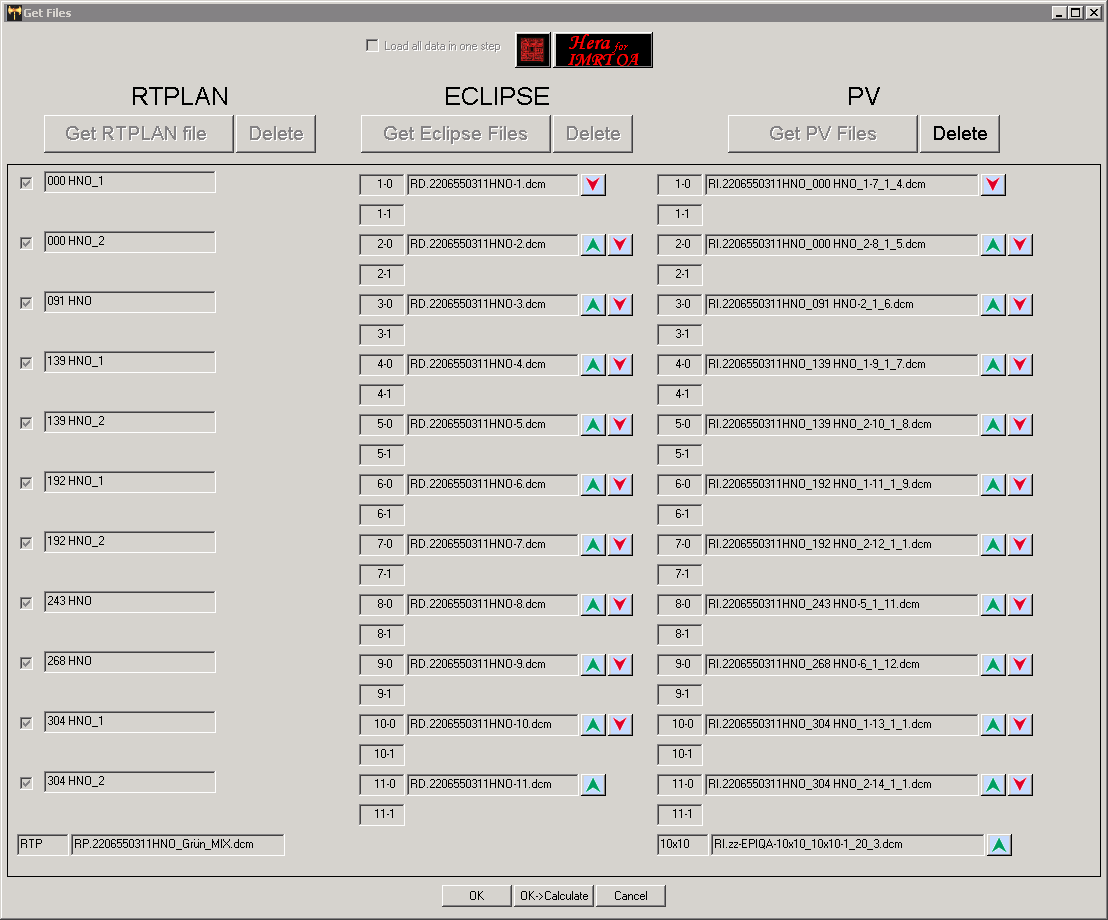
The file list contains some unsplit fields and some split fields (two carriage groups).
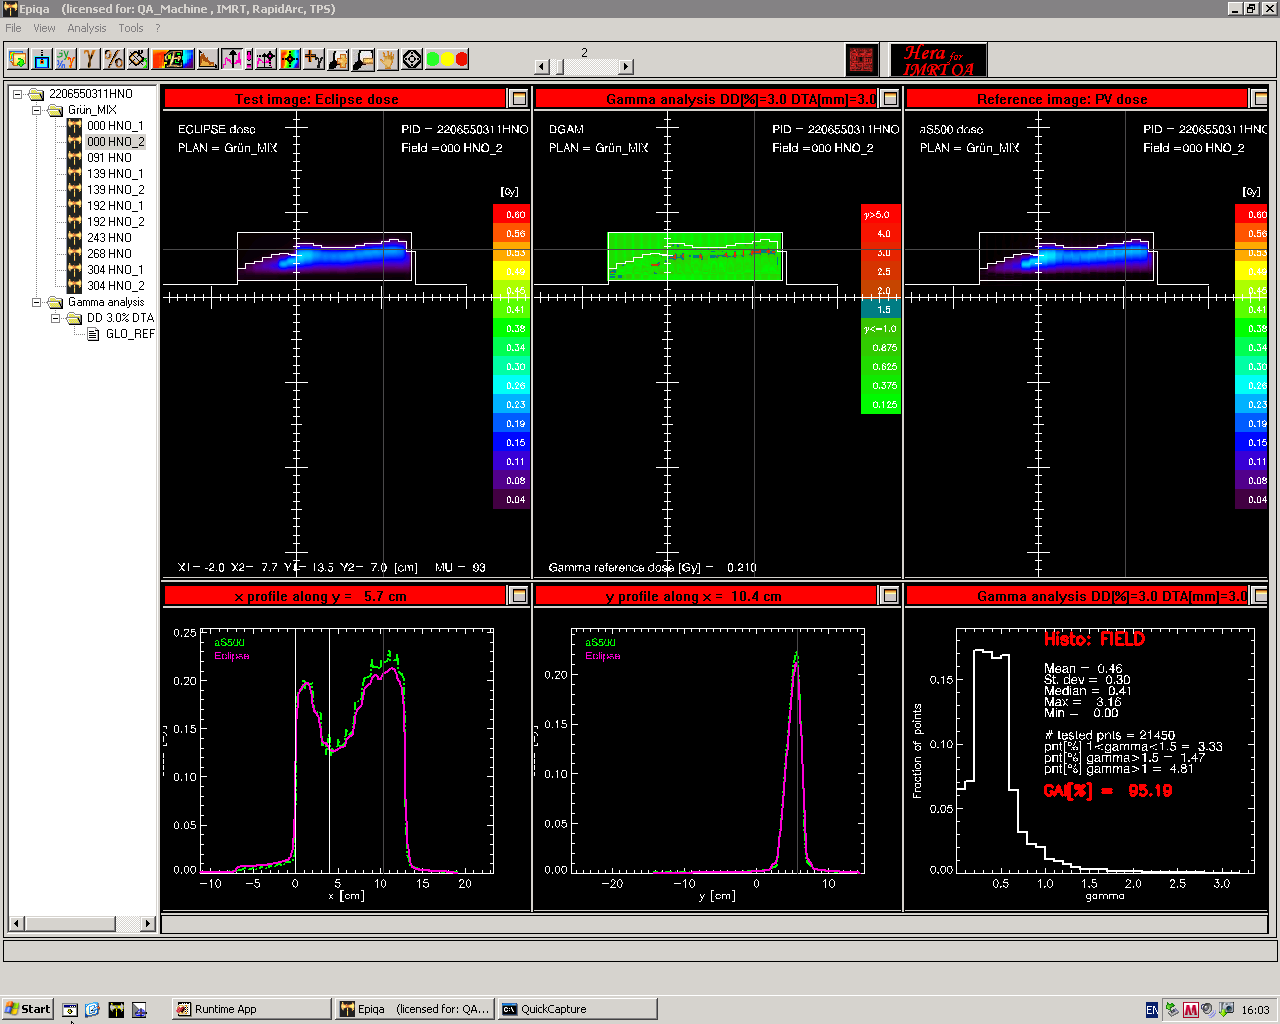
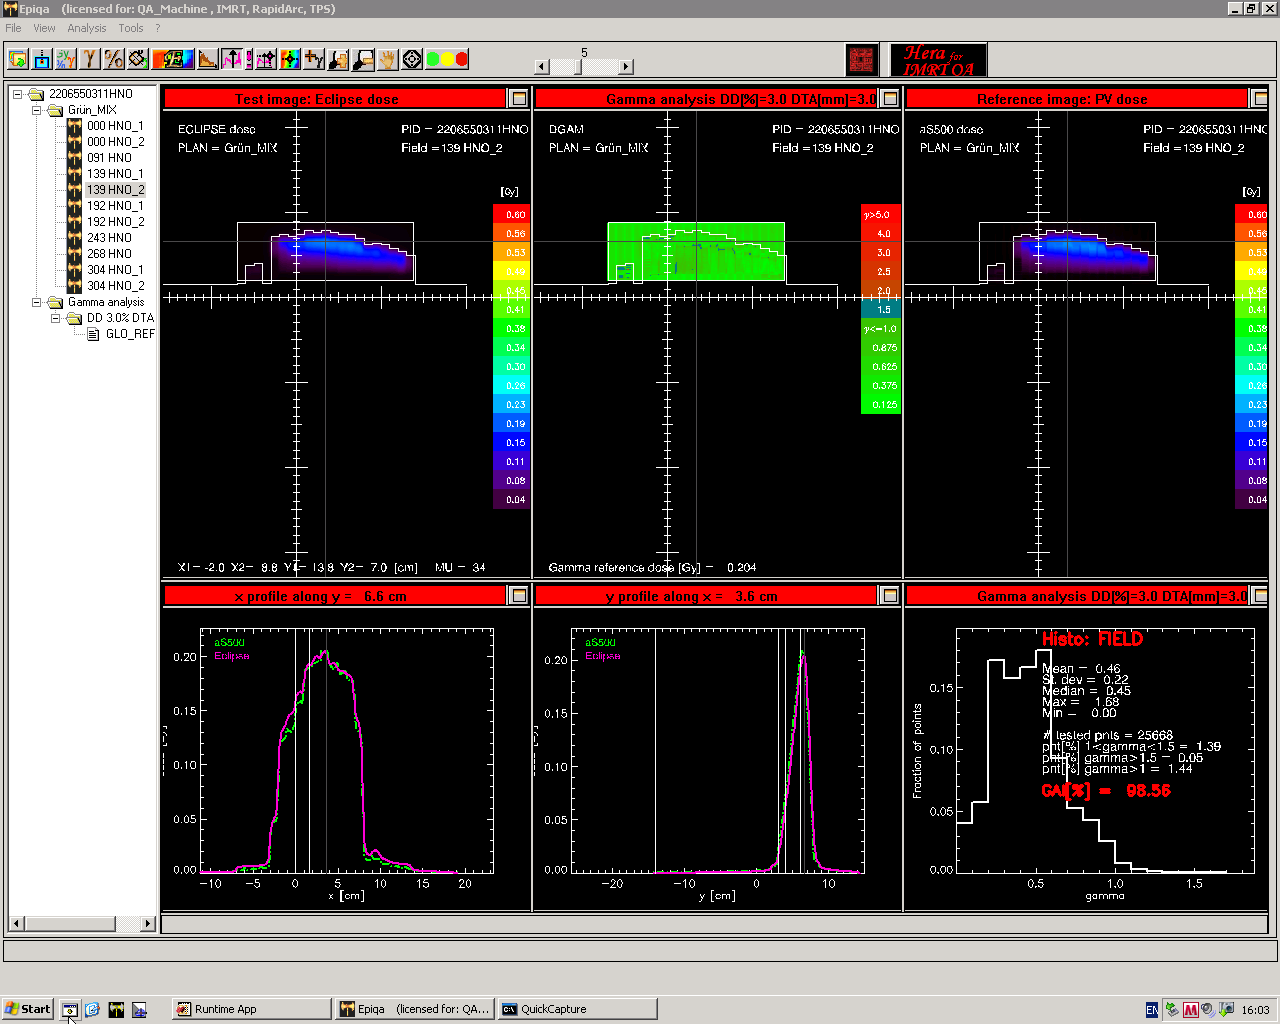
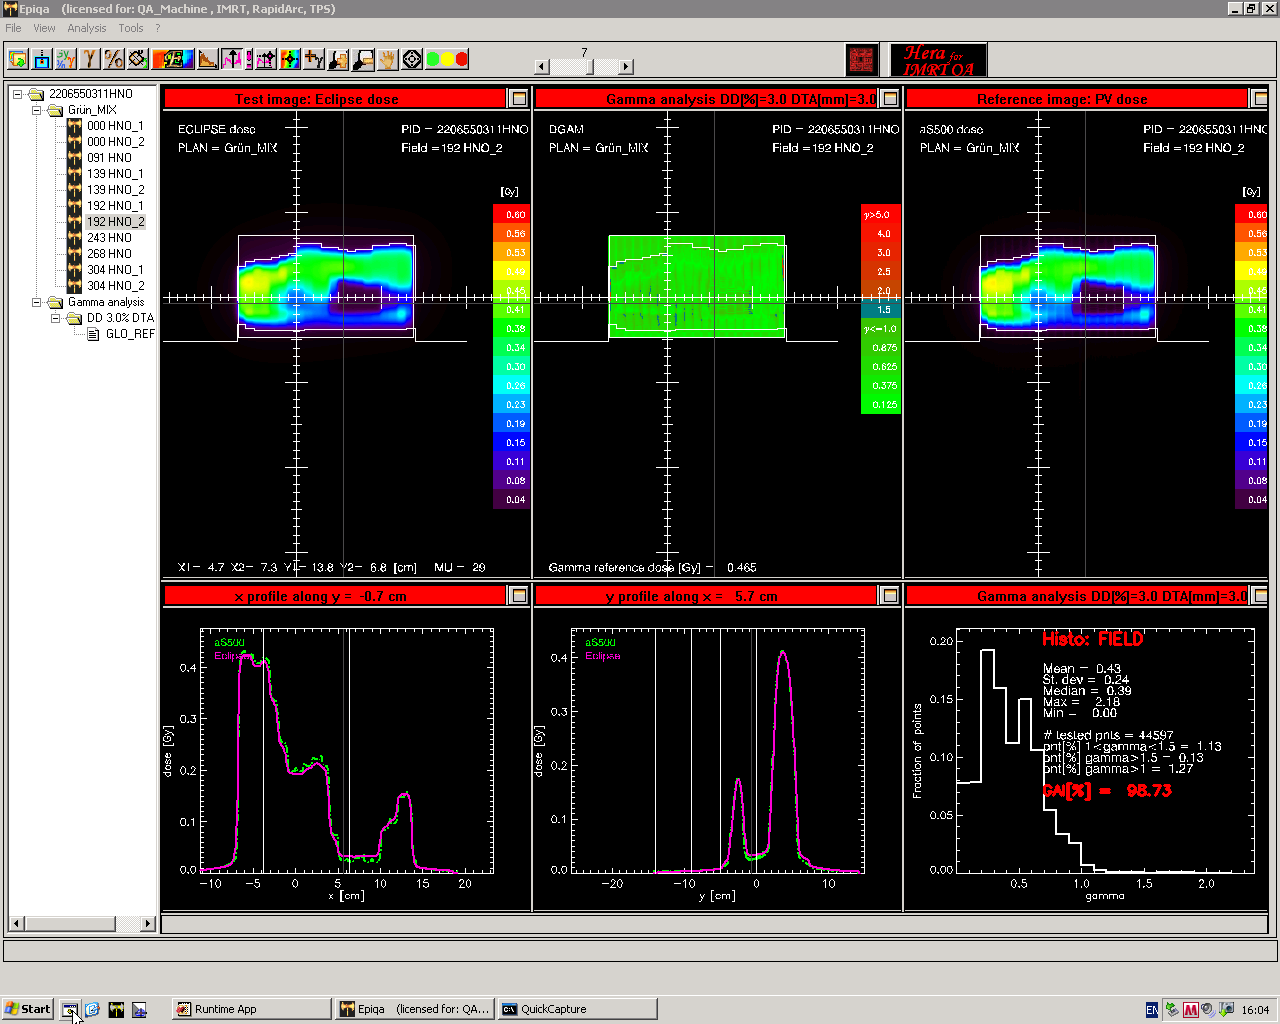
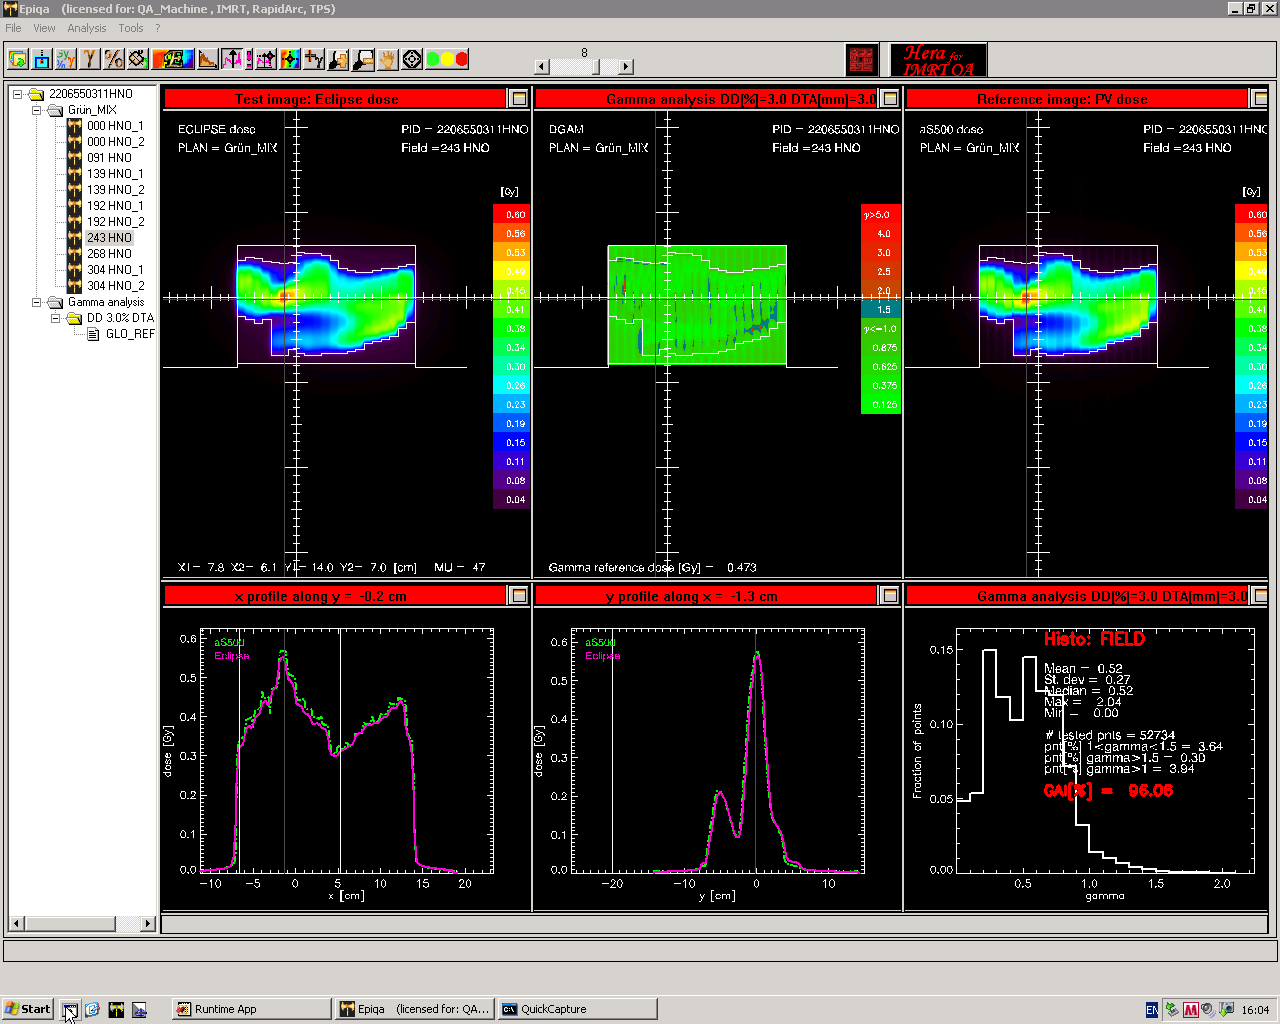
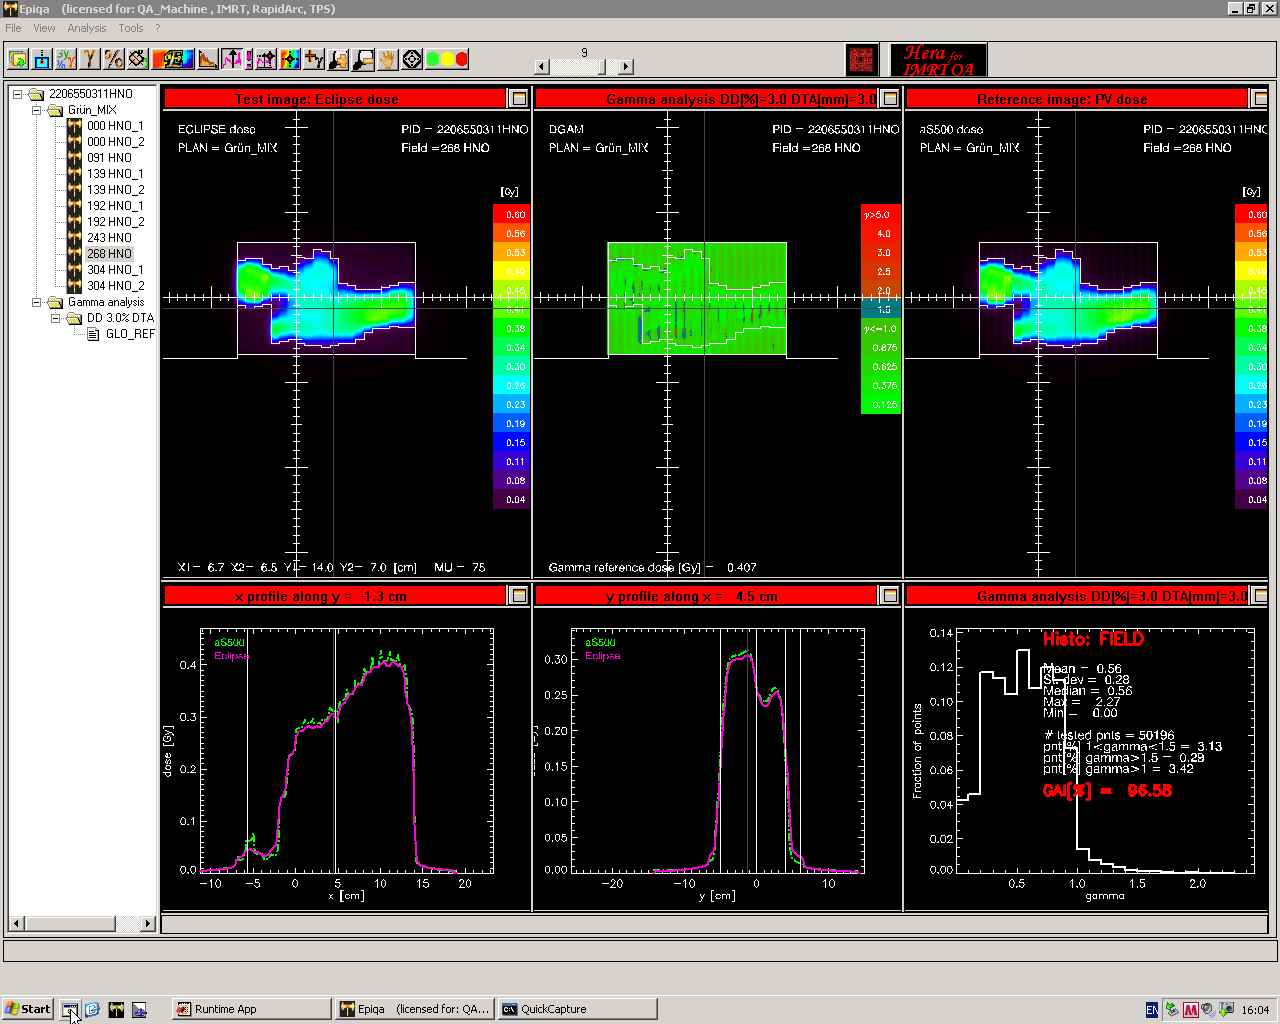
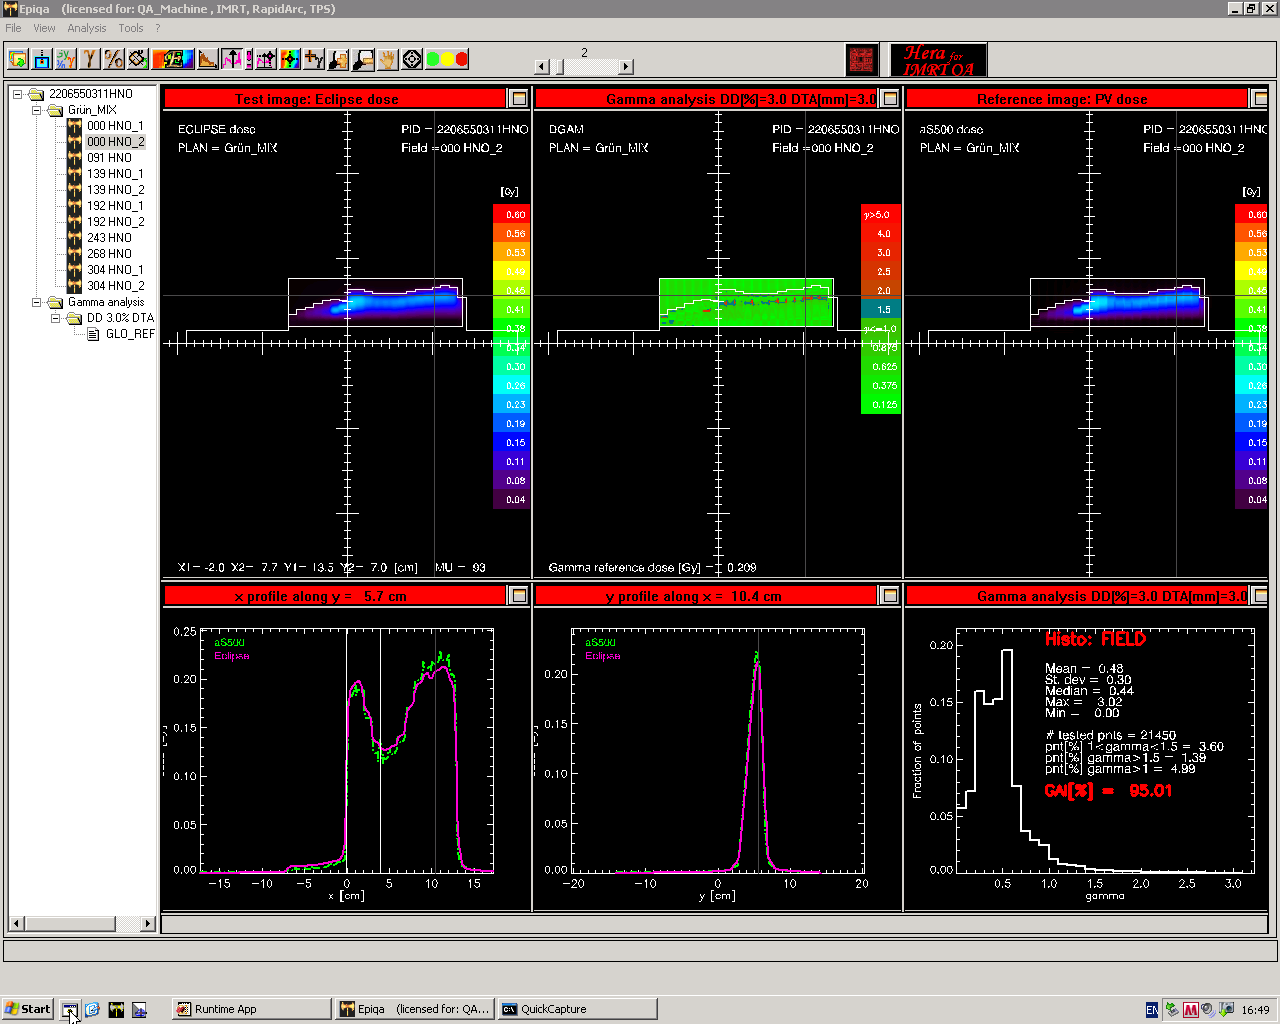
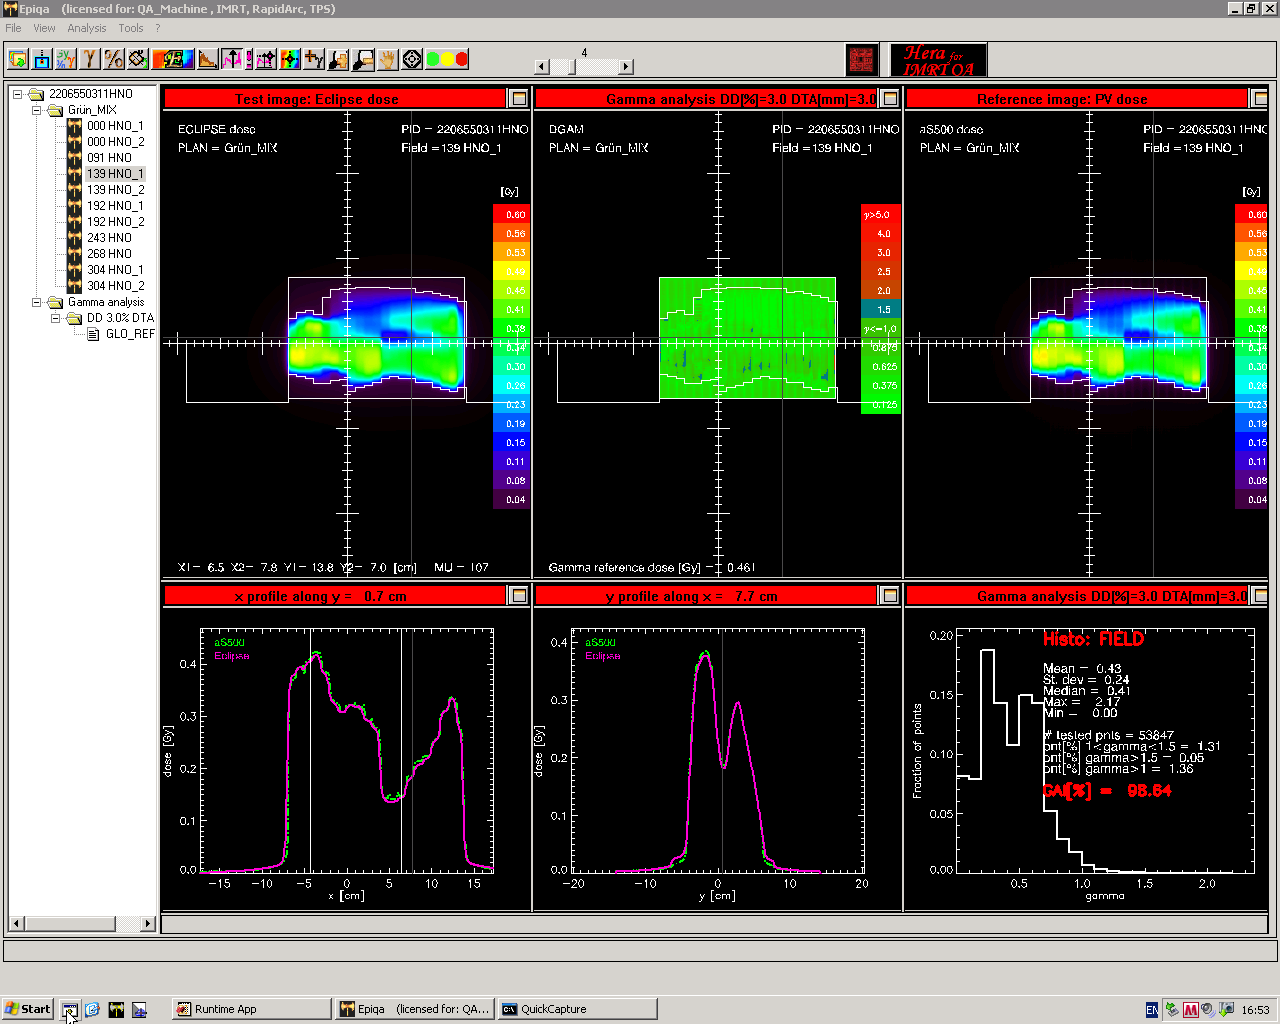
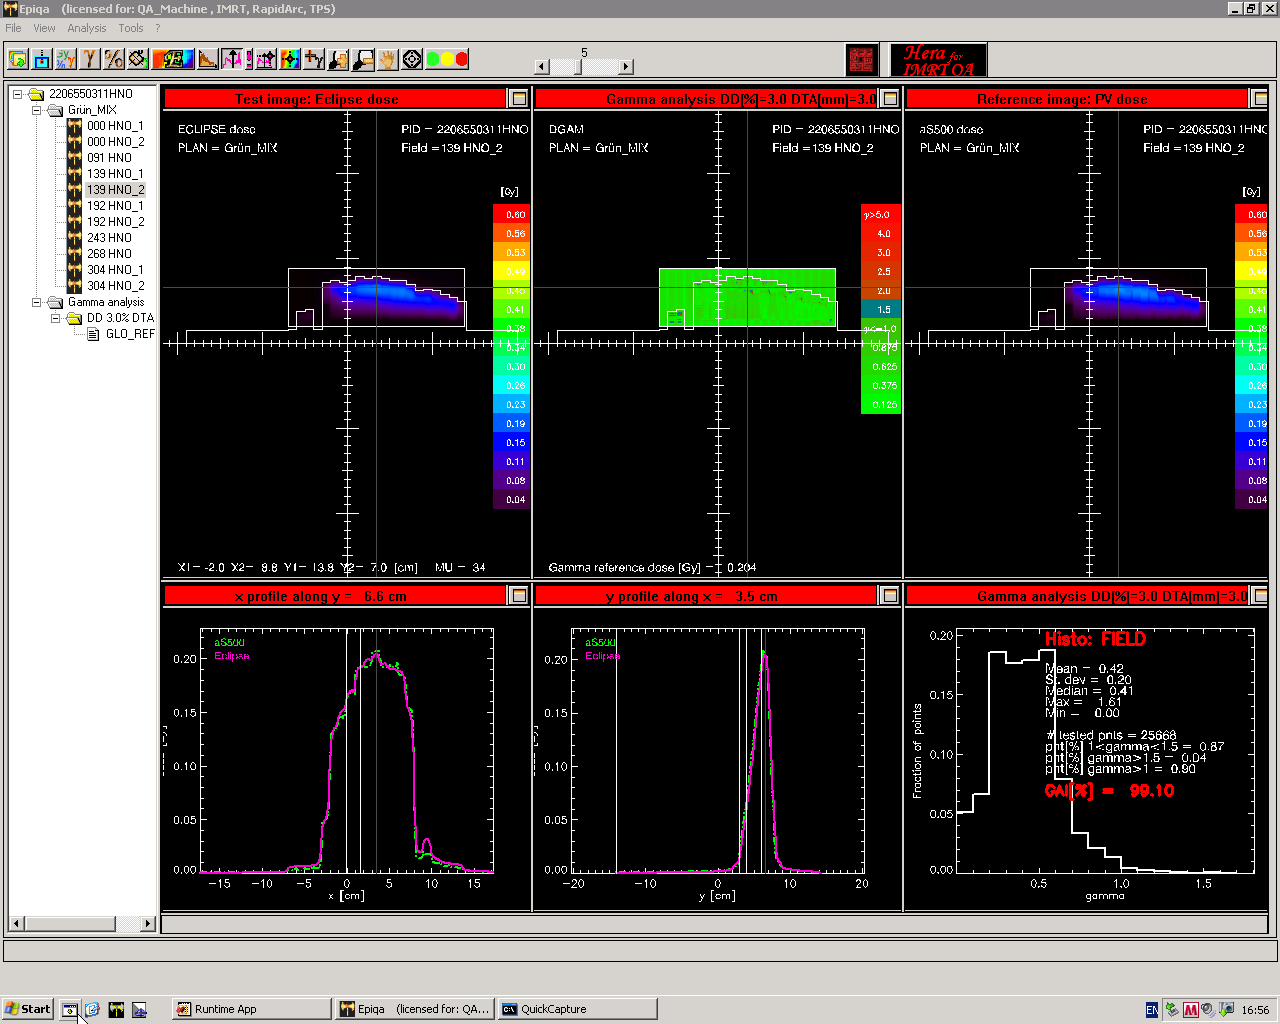
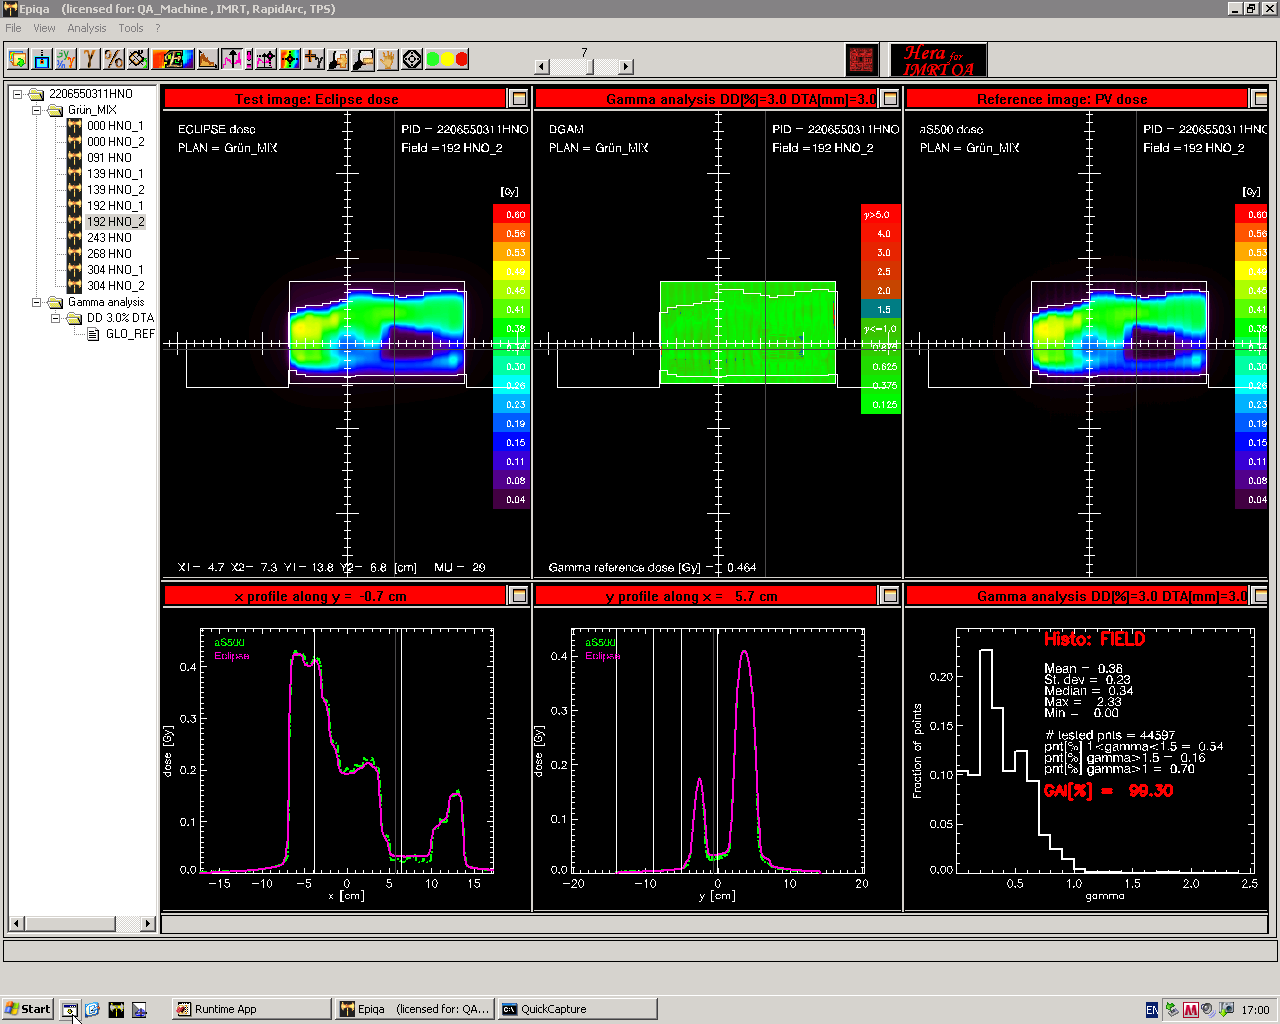
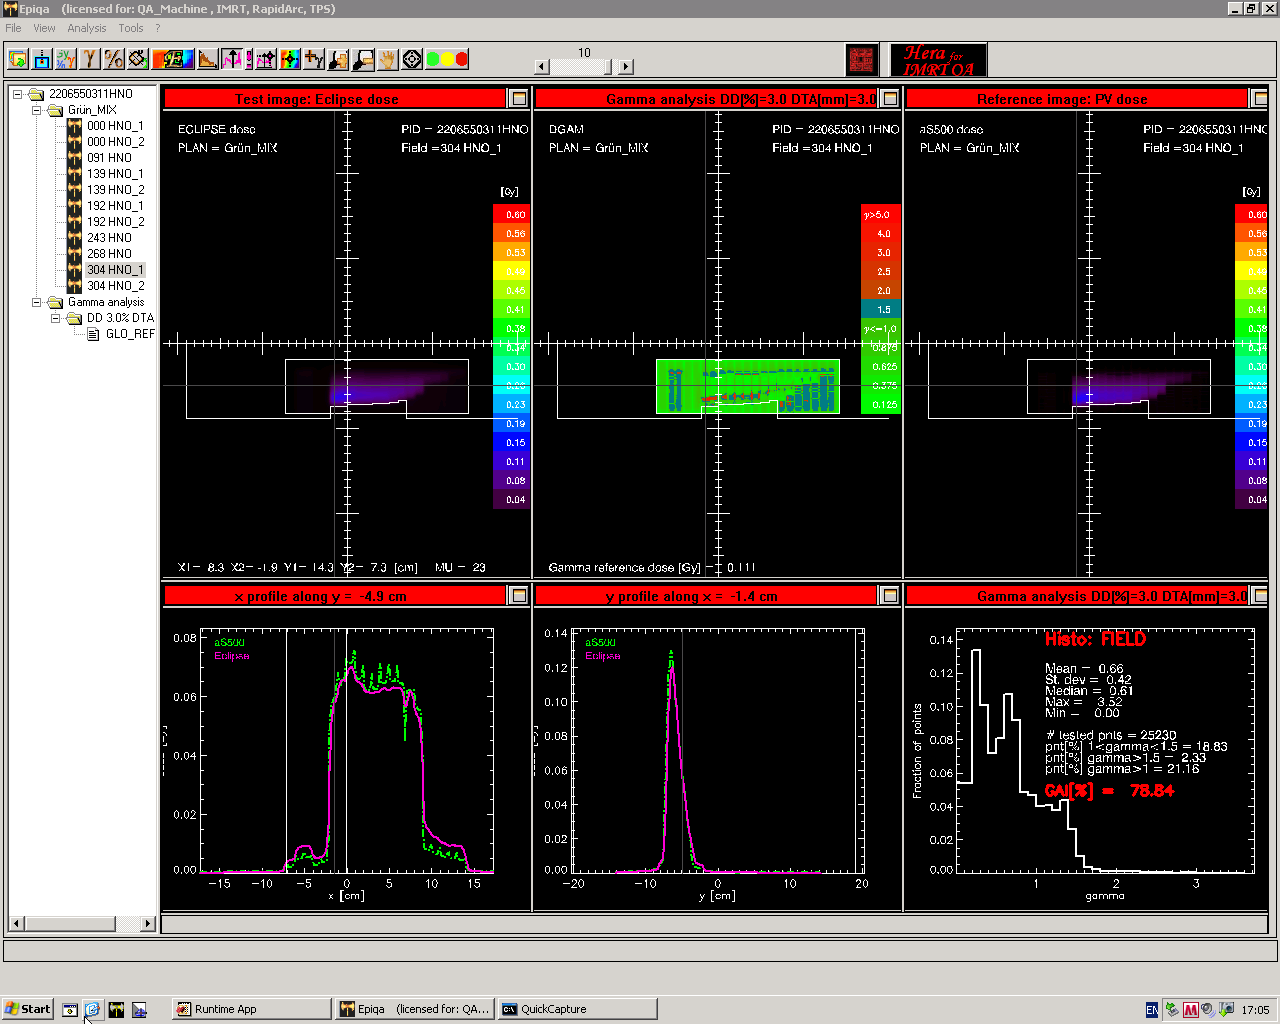
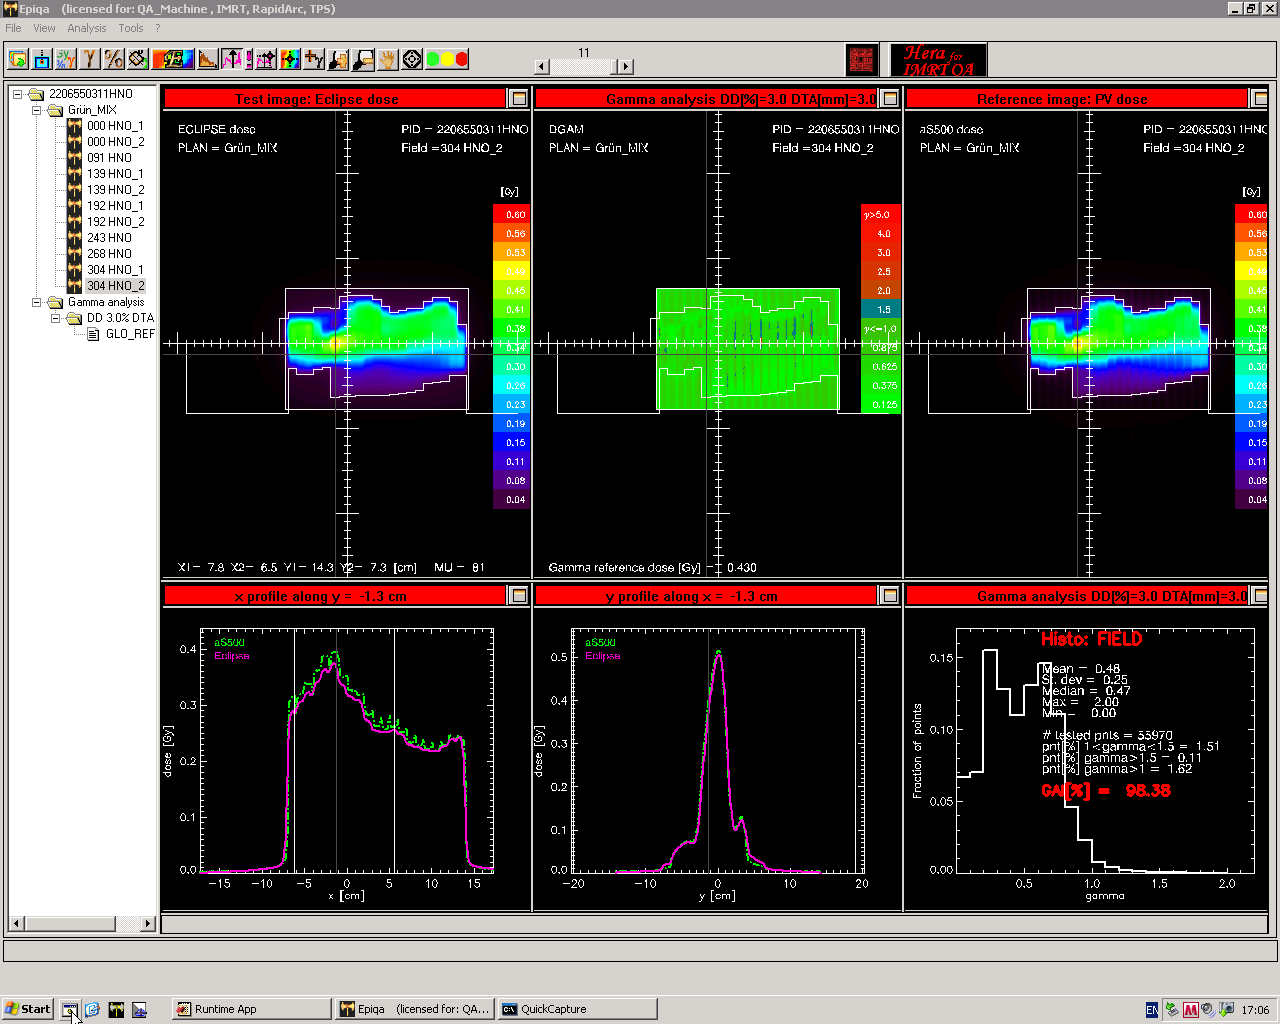
When gamma-analysed with the 3%/3mm criterion, most of the fields are unsuspicious:

Larger images of the other fields can be found here:
000_2, 091, 139_1, 139_2, 192_1, 192_2, 243, 268, 304_1, 304_2.
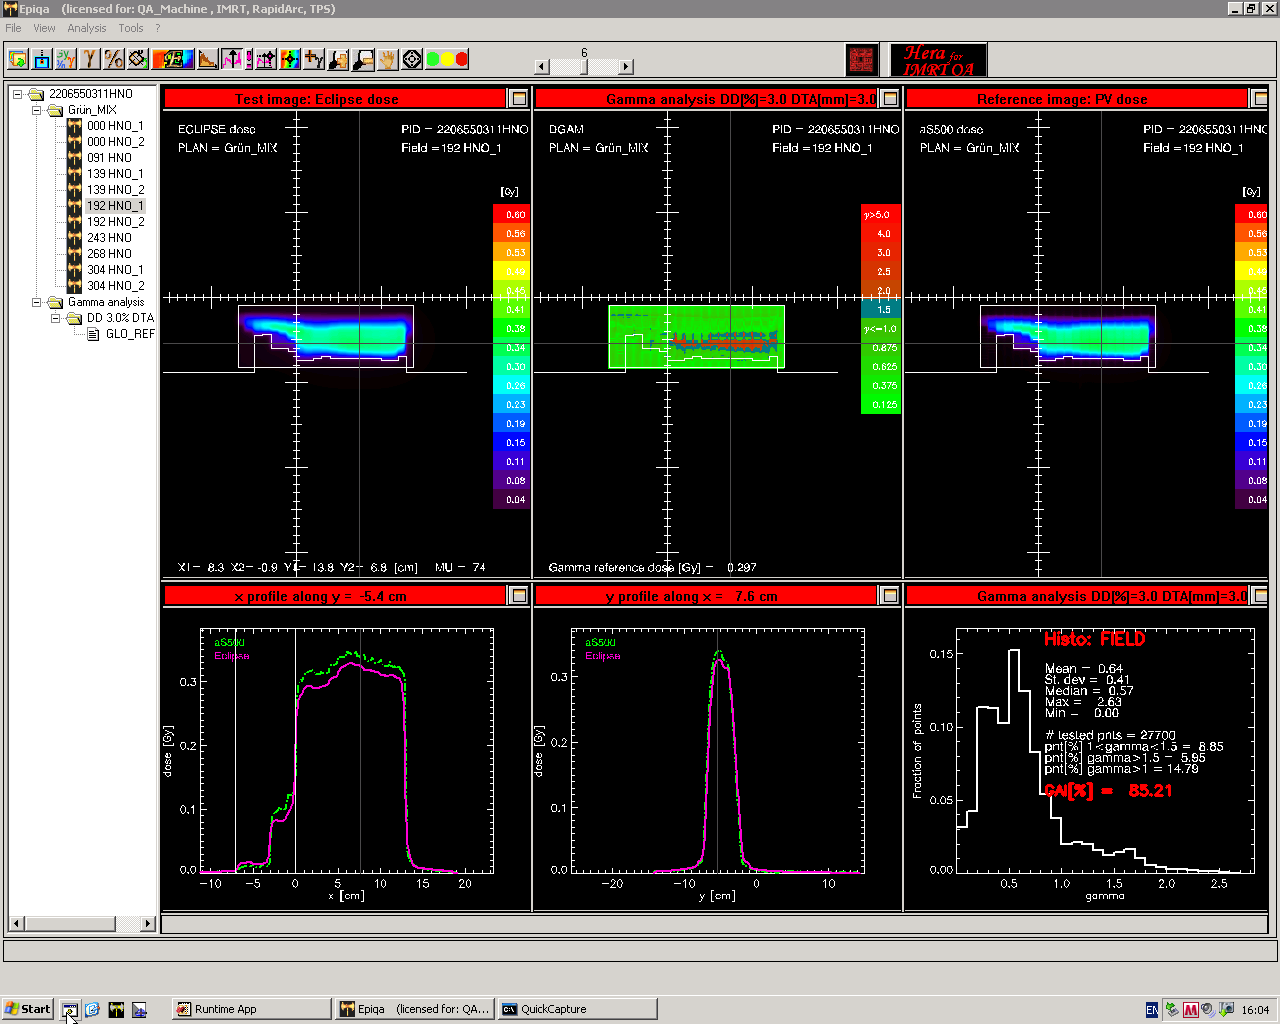
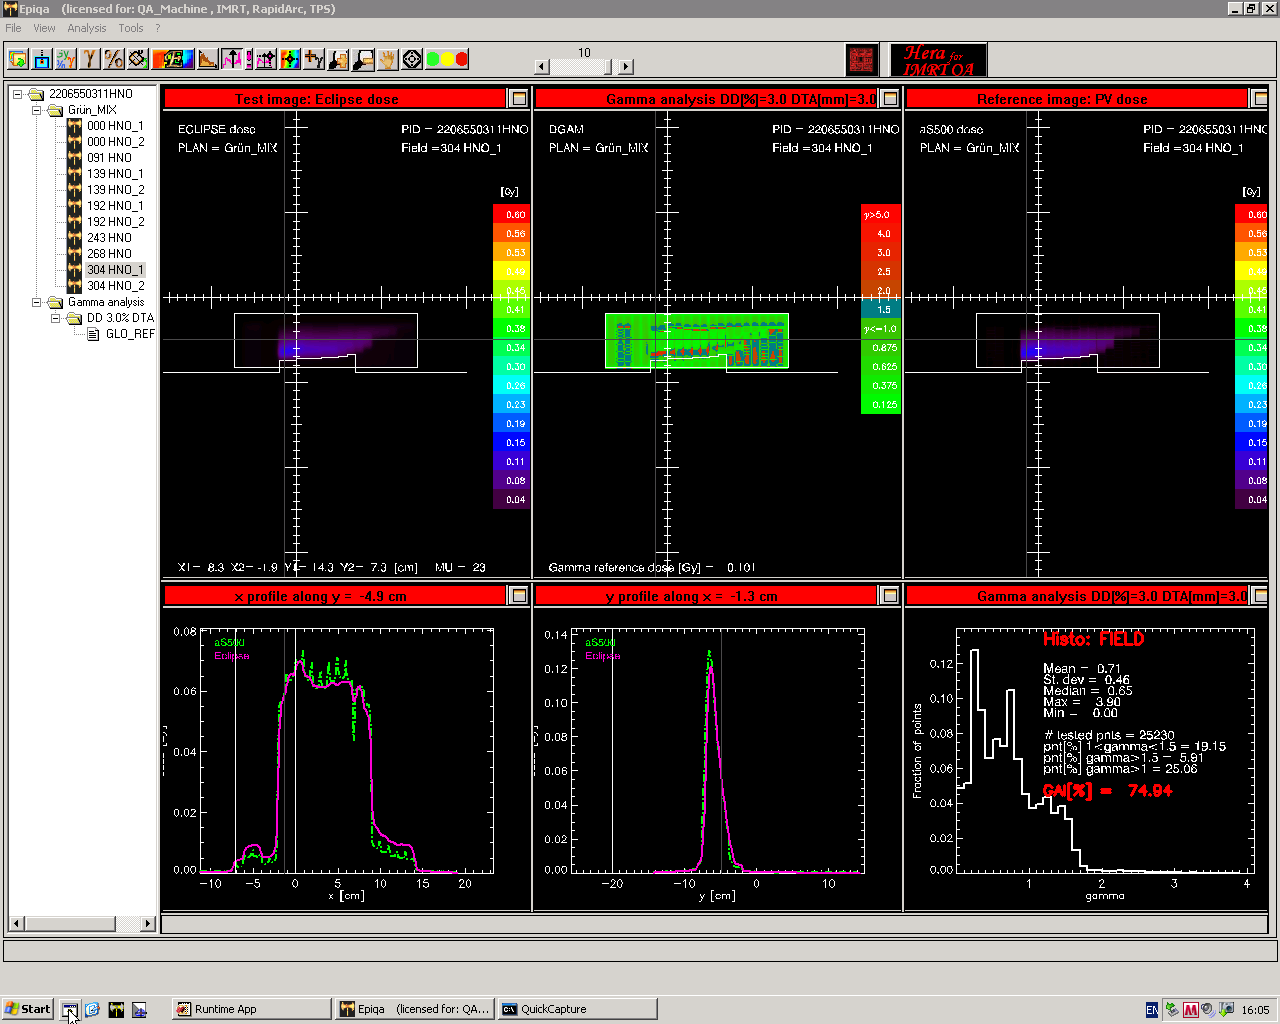
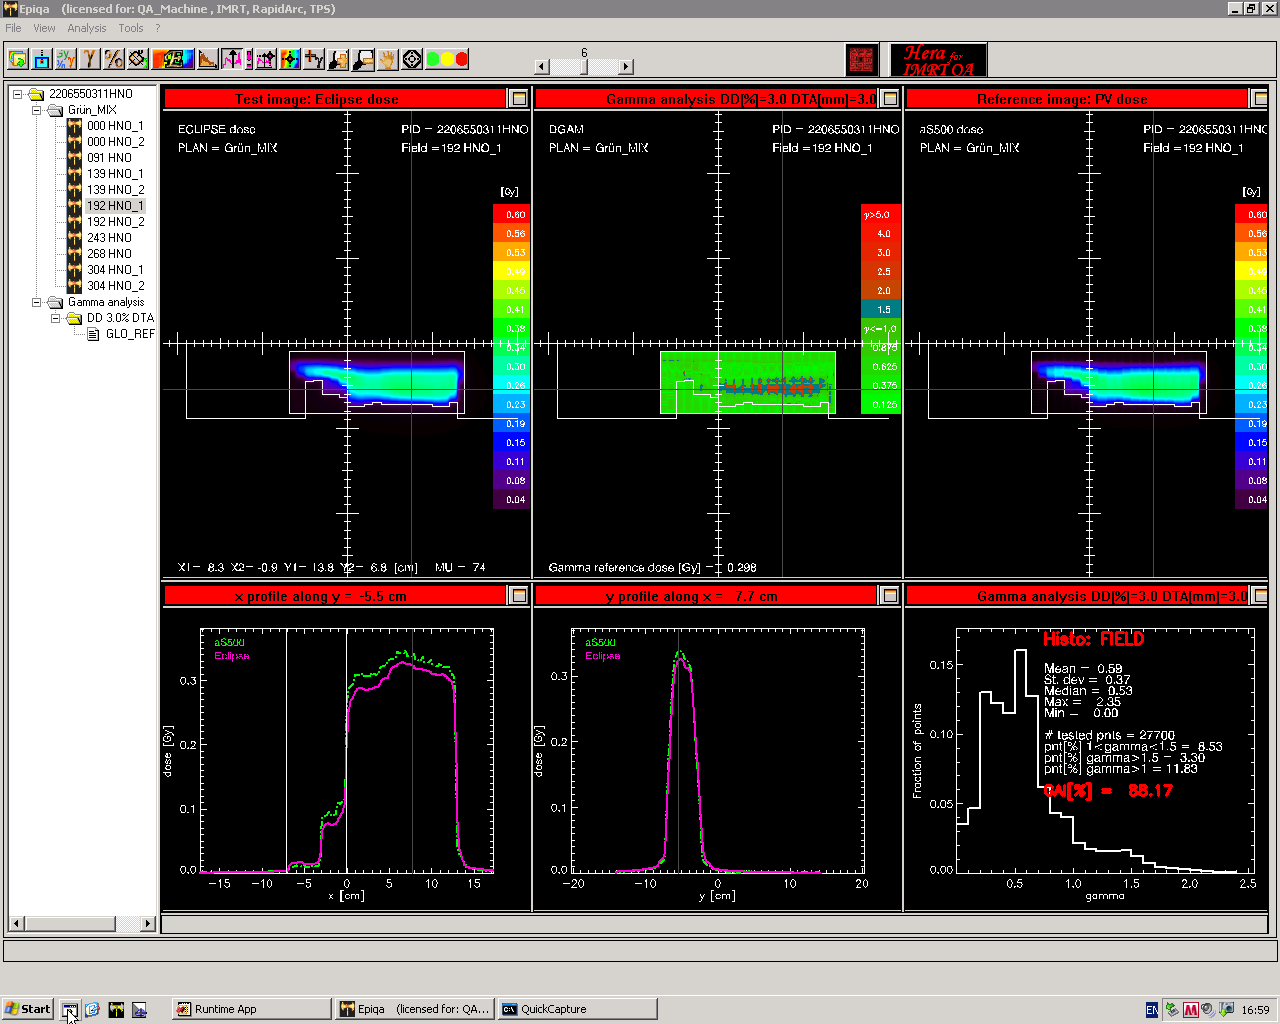
Two "suspicious" fields (with GAI values below 90%) are highlighted in bold. Both are first carriage groups of split fields. What's wrong with these fields? What could be the reason for the deviations?
The easiest thing to try first in order to resolve the matter is to redo the whole measurement. This is to rule out some transient problem during delivery, like pressing beam on too early (if the acquisition system is not ready yet, some radiation is "missed"), etc. If there really is some problem, the result of the first session should be reproducible.
The re-check was done on the next day. Before this second measurement, the MLC was initialised. These are the results:
000_1, 000_2, 091, 139_1, 139_2, 192_1, 192_2, 243, 268, 304_1, 304_2.
The second session is a little better (GAI increases by a few percent for most of the fields), but deviations of fields 192_1 and 304_1 are still high, which basically confirms the first measurement.
PV vs PV comparisons
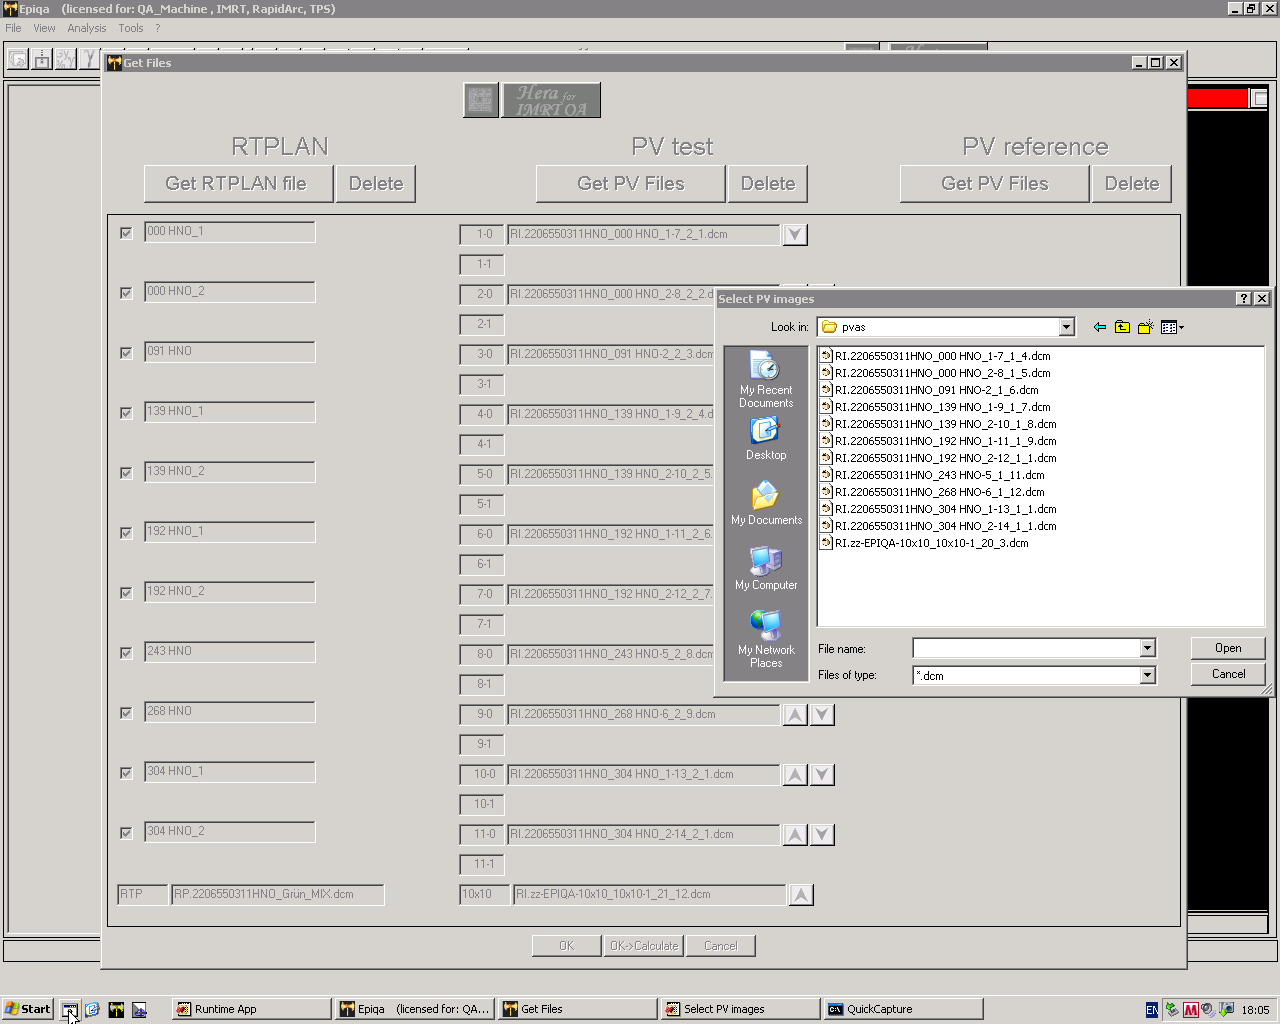
EPIQA can be used to compare the two "EPID sessions" directly, by invoking a "PV versus PV" analysis (this is not possible in VPD). One image set is called the "PV test", the other the "PV reference". Each set has to include a 10x10 reference image, which is used for dose calibration and image alignment.
Here the "reference set" is being loaded:
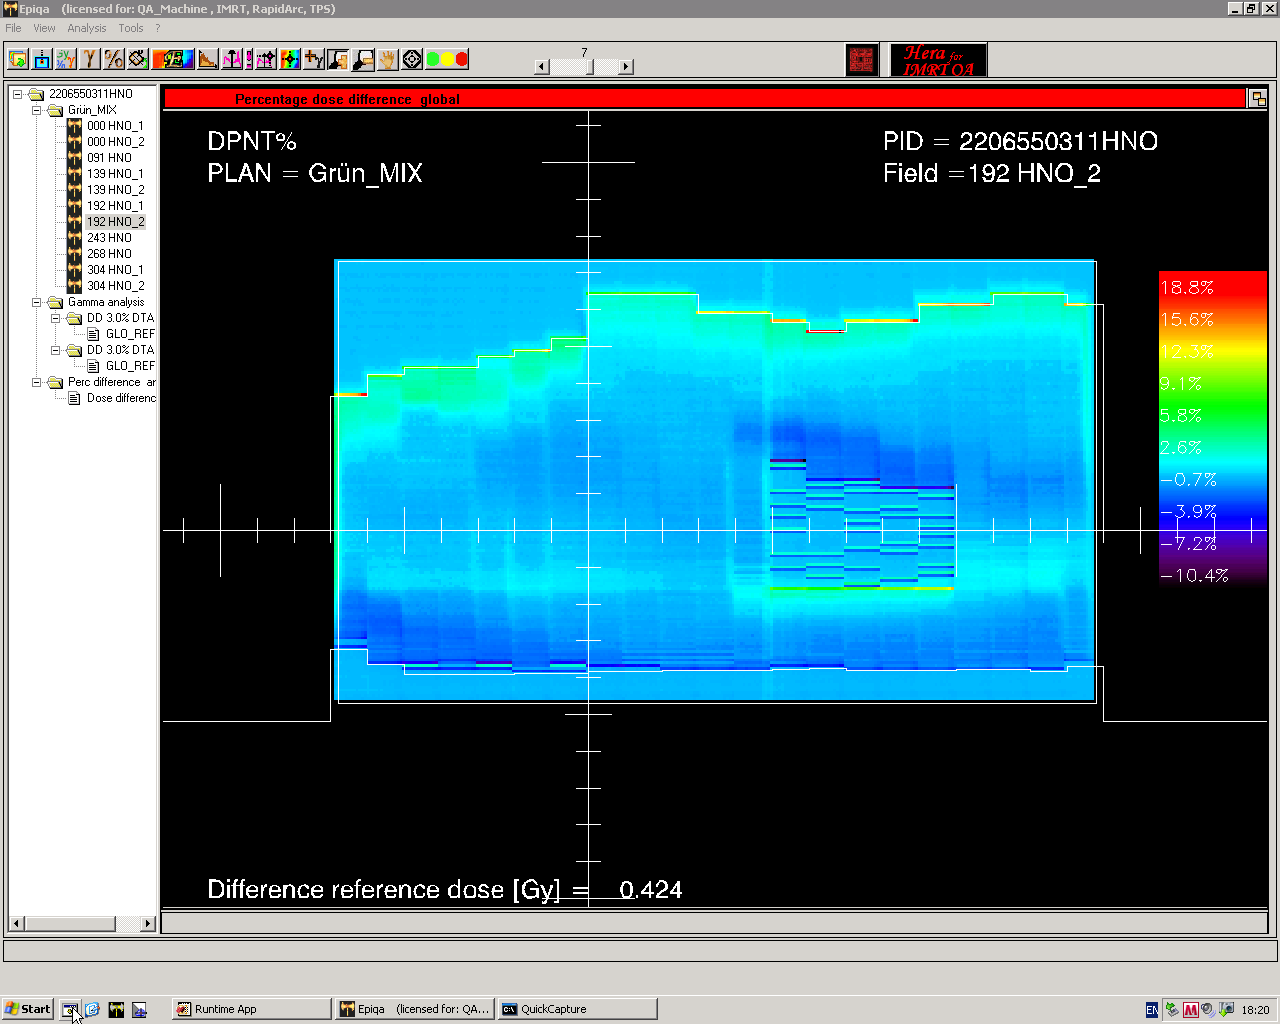
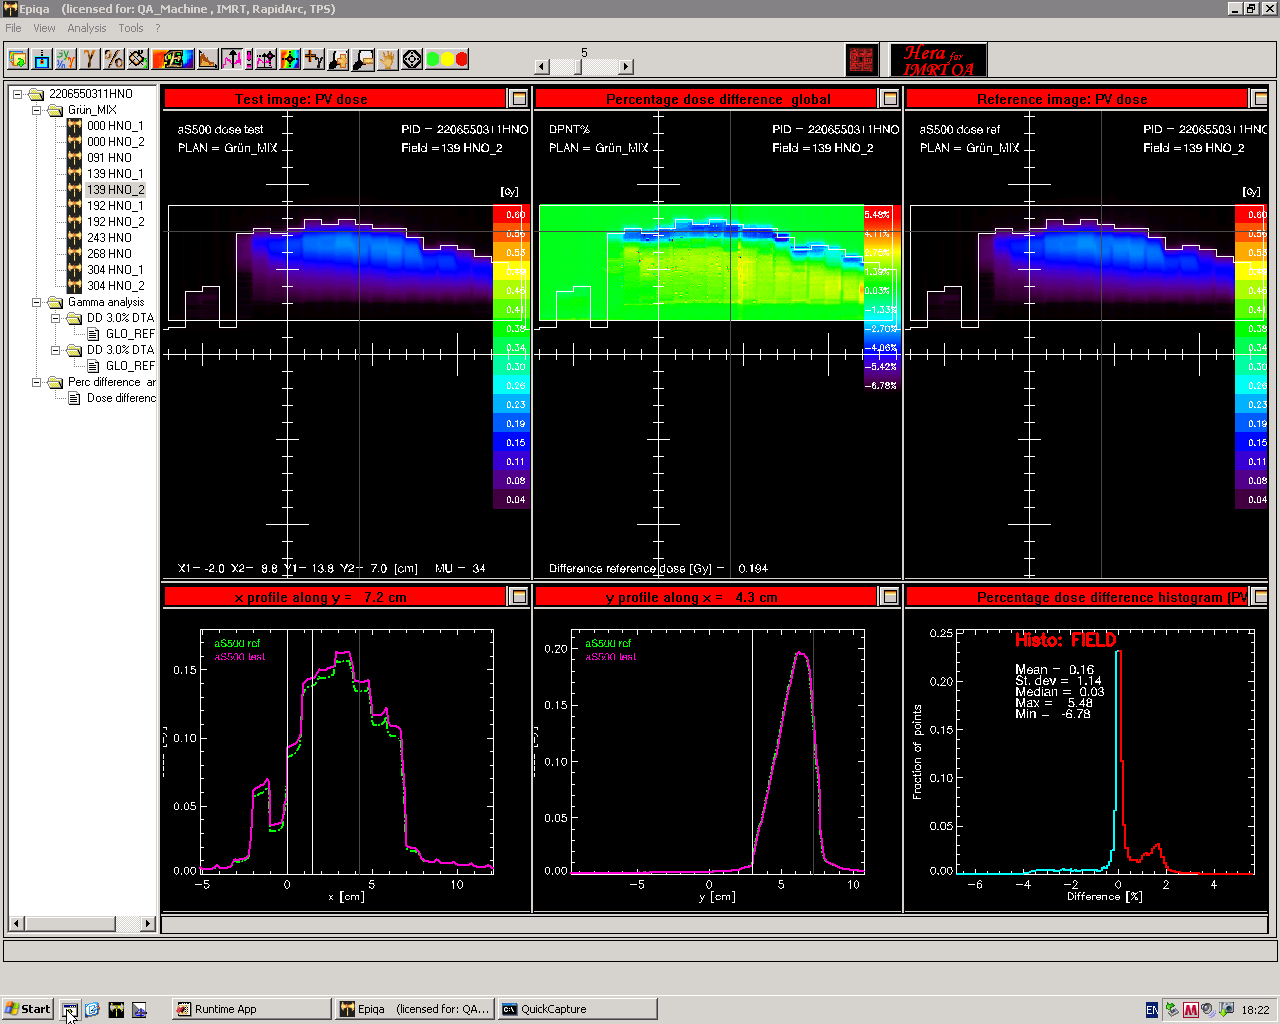
By comparing the two sets of EPID images field-by-field, even very small differences in MLC delivery can be detected, as the following screenshots demonstrate.
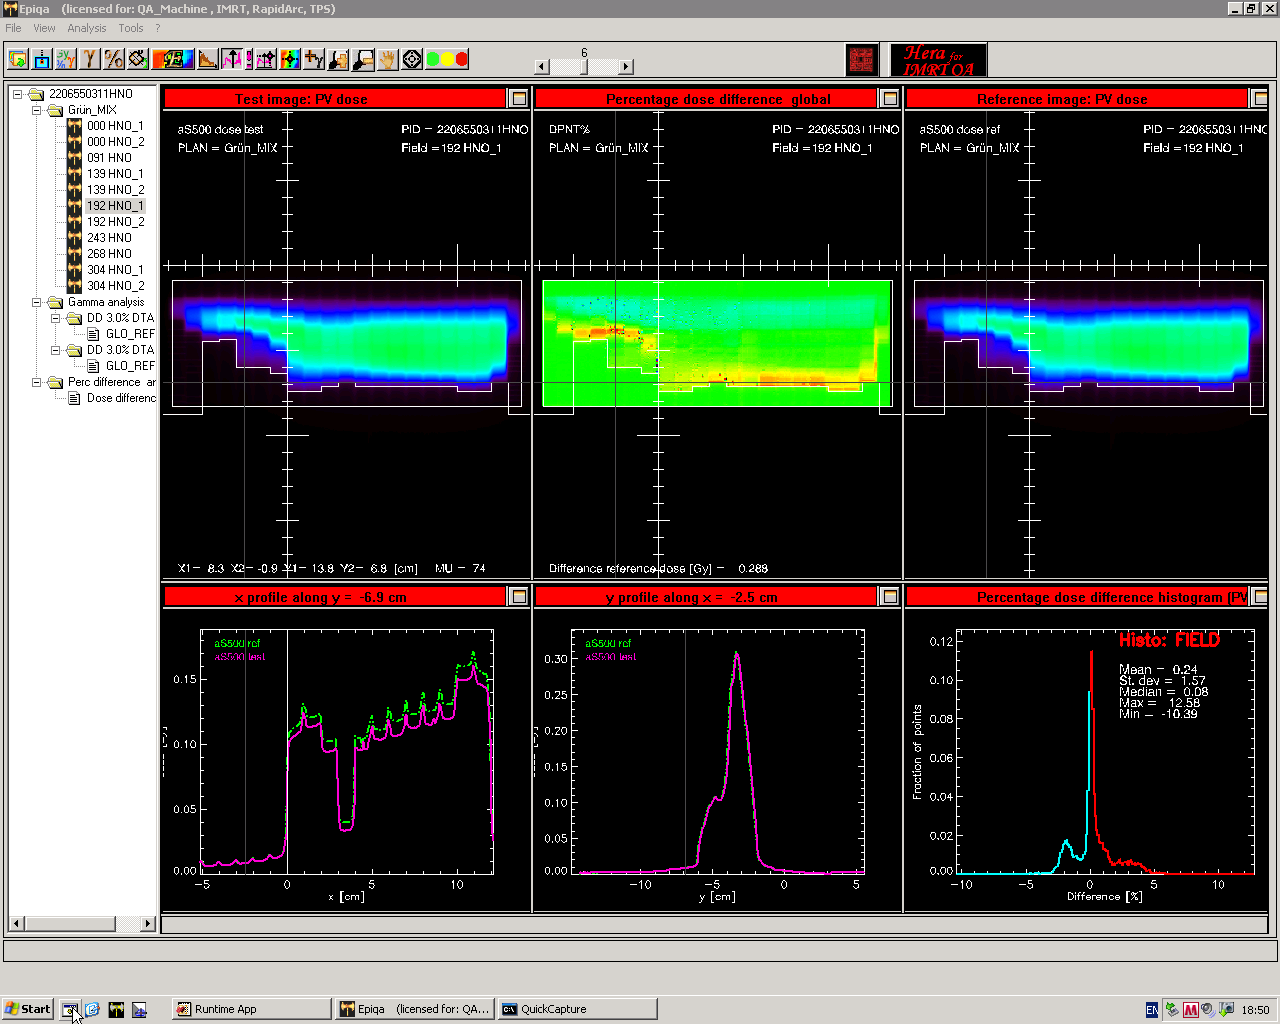
The percentage dose difference is plotted instead of the gamma map.
When closed leaf pairs move over the field, a characteristic stripe pattern appears. When the stripes are not exactly at the same location, they show up in the difference plot:
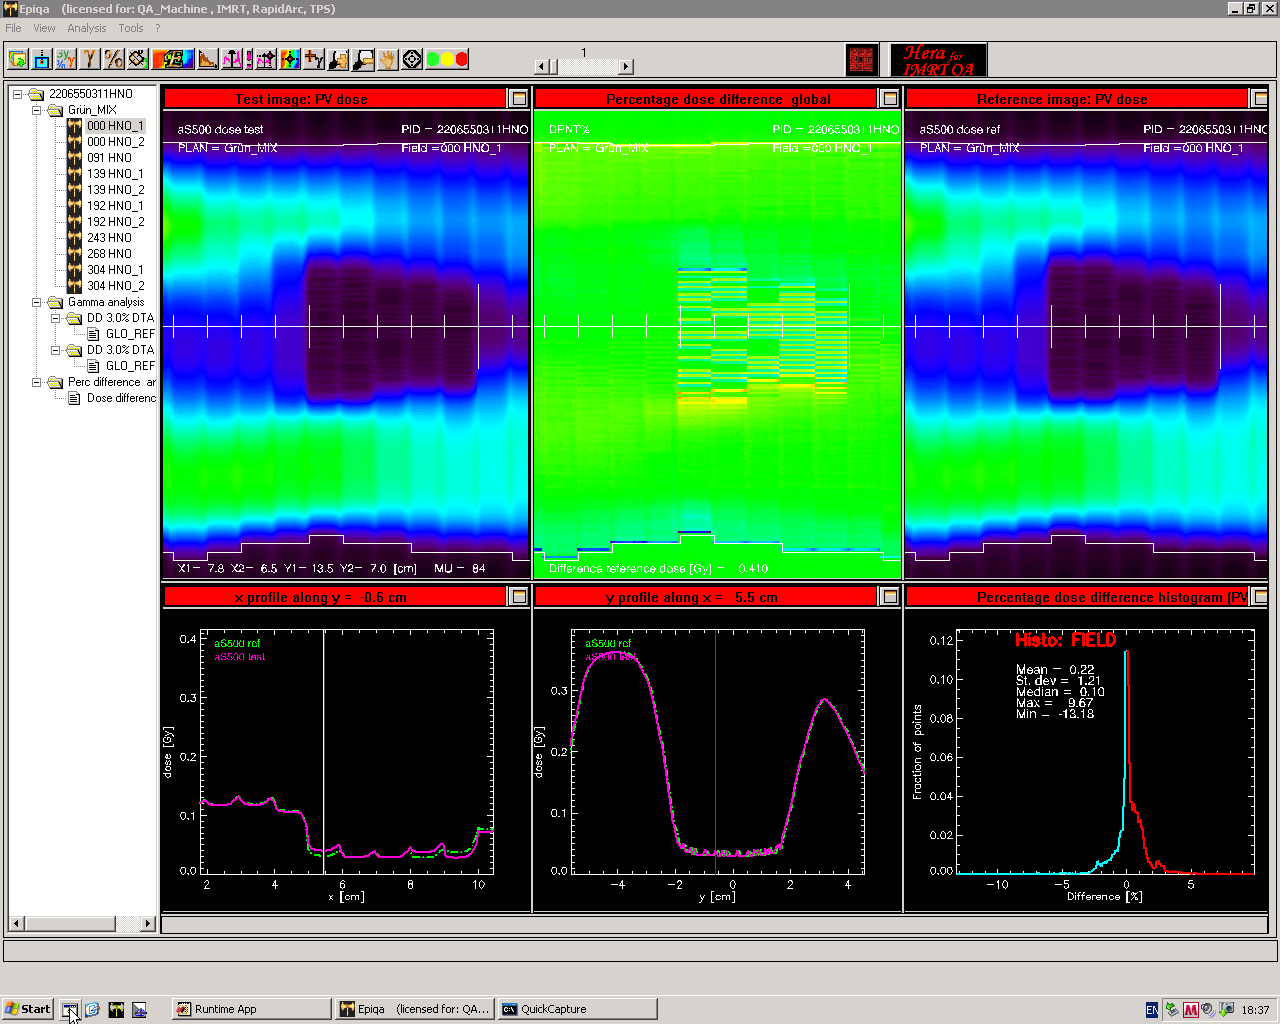
A closer look into the low dose region ...
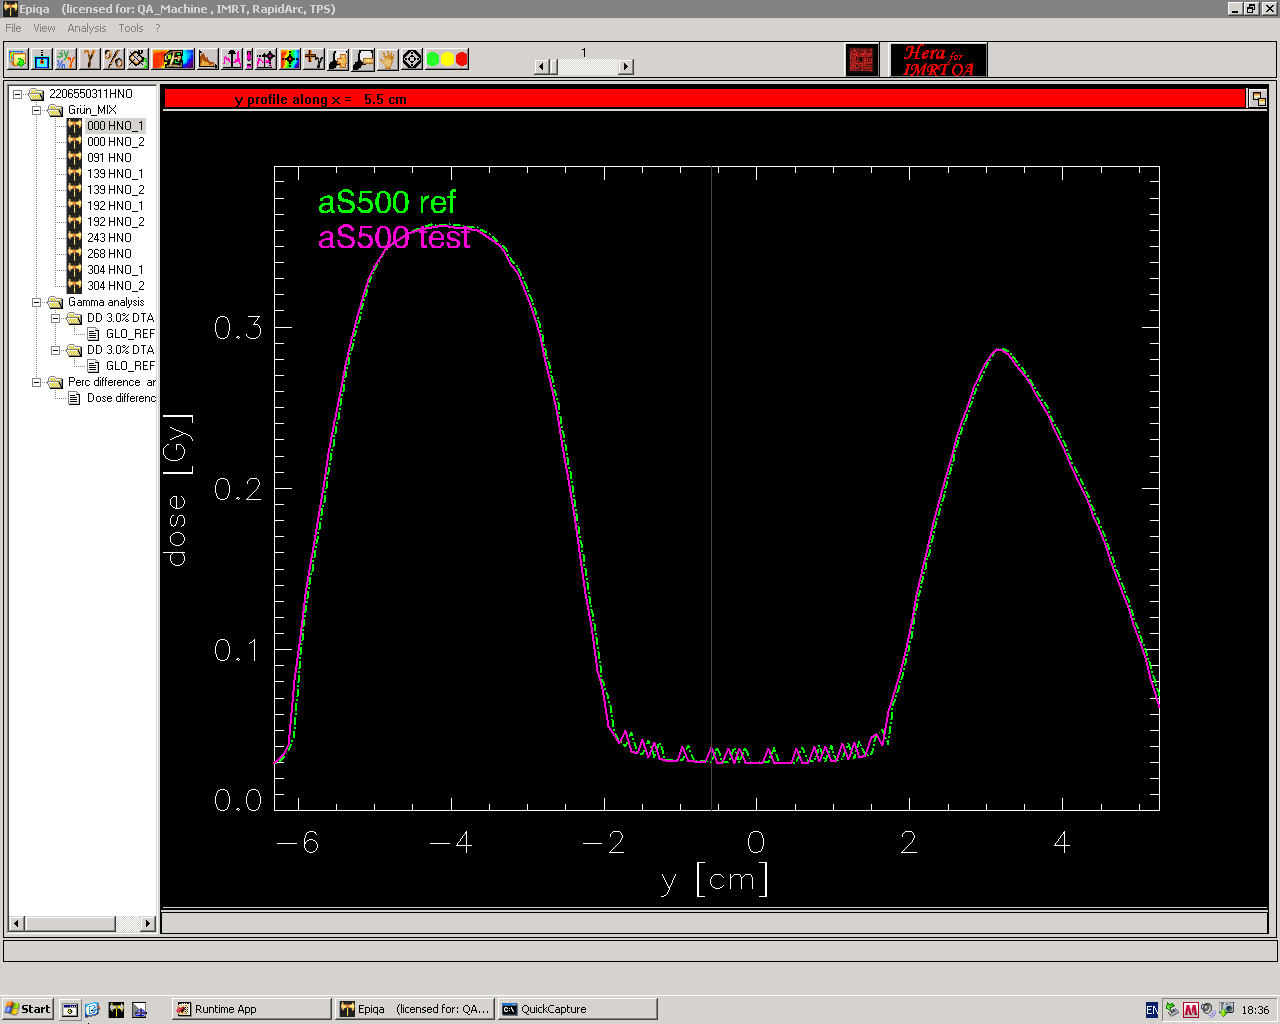
... indicates that the reason for the small shift could be an alignment problem, either from EPIQA or from the exact jaw setting of the 10x10 reference field: The pattern of small spikes in the central valley is shifted between the images. If this shift could be corrected (e.g. by auto-alignment), the match, at least for this profile, would be perfect:
Other differences are more likely coming from the aquisition system or the MLC, but not the analysis software:
The MLC trajectories are allowed to deviate by a certain amount, and initializing the MLC should also have a certain effect. Note however, that all deviations shown here are rather small.
These are the difference plots for our two suspicious fields:
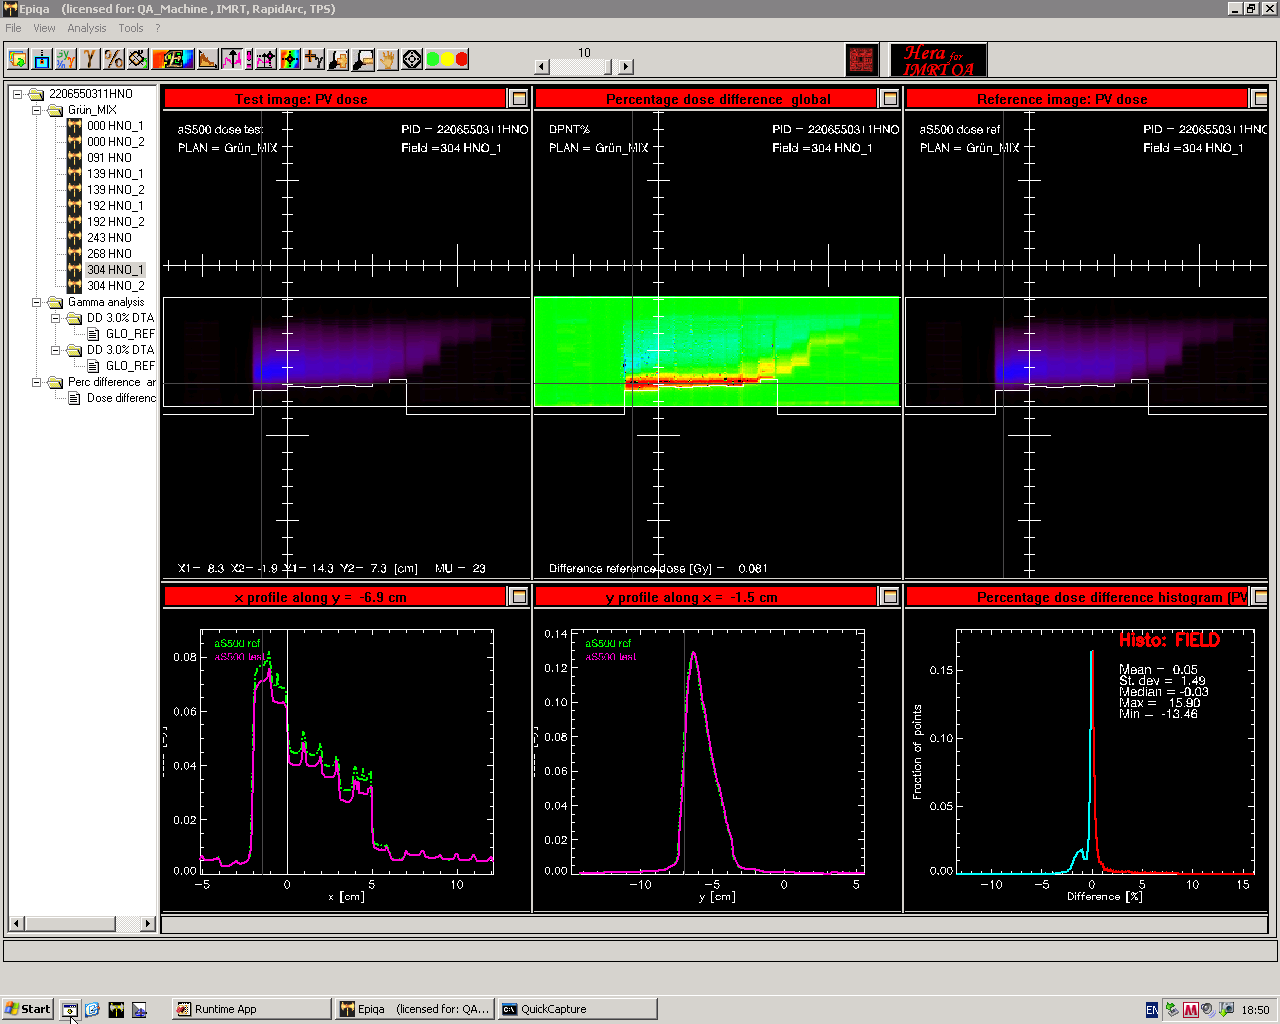
One conclusion can be drawn: the reproducibility of plan delivery is not 100% (nobody expected that), although the differences between two deliveries are rather small. The deviations between measured and planned dose distributions (gamma-method) are much larger.
But the reason for the deviations in the suspicious fields is still not clear. One reason could be that Eclipse still has some problems with split fields, as the "split field bug" which we reported to Varian a few years ago demonstrates (see also CP-03582 on my.varian.com).
Varian Portal Dosimetry
Analysis of this plan with VPD gave a "Failed" for only one of the fields (the 192_1). The result "Passed" was missed by only 0.1%:
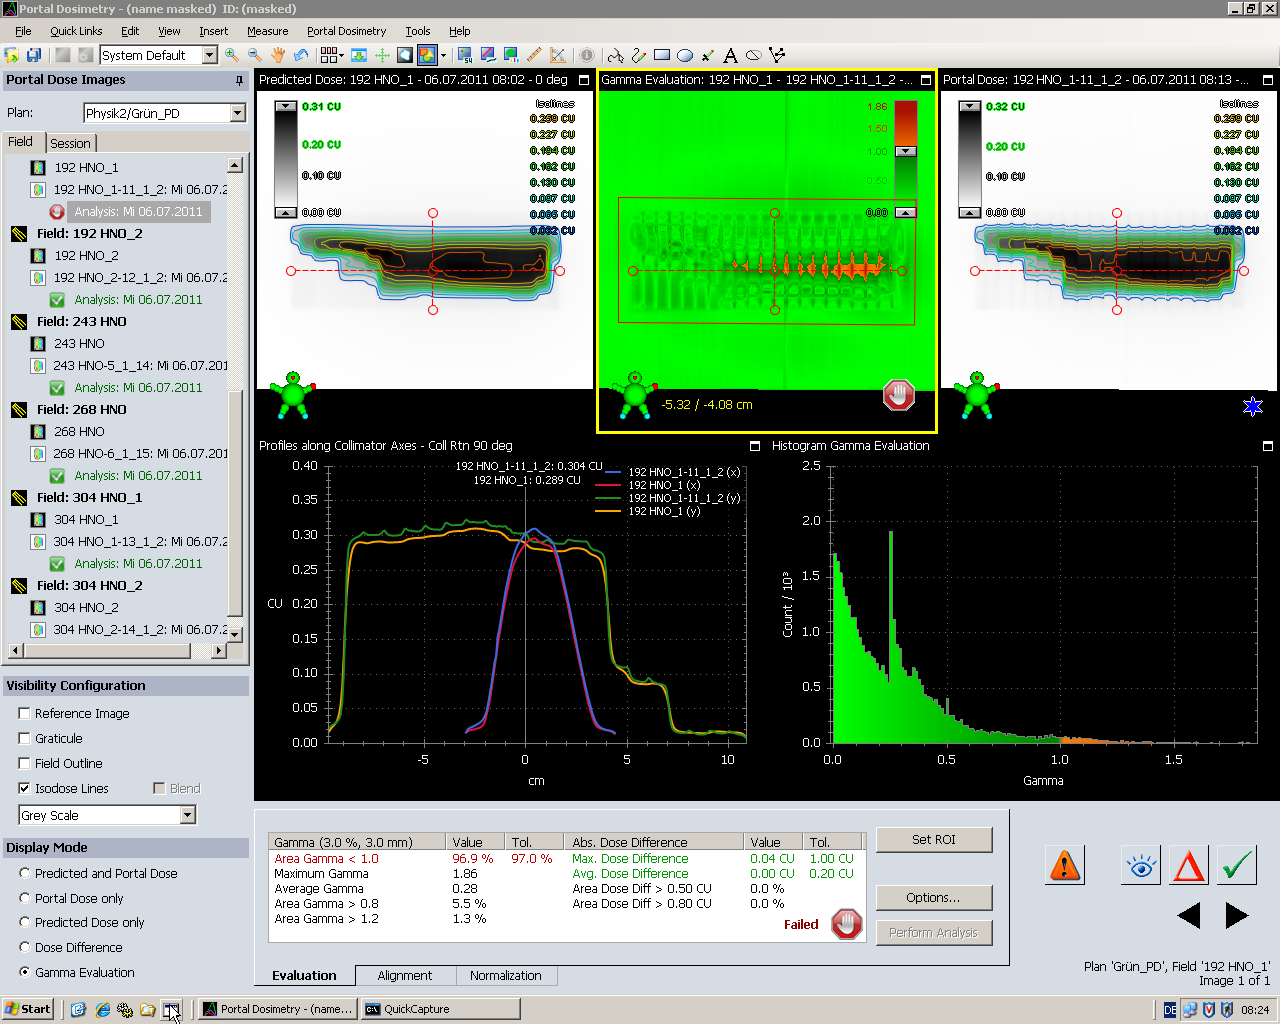
This means that EPIQA is clearly the more sensitive method.
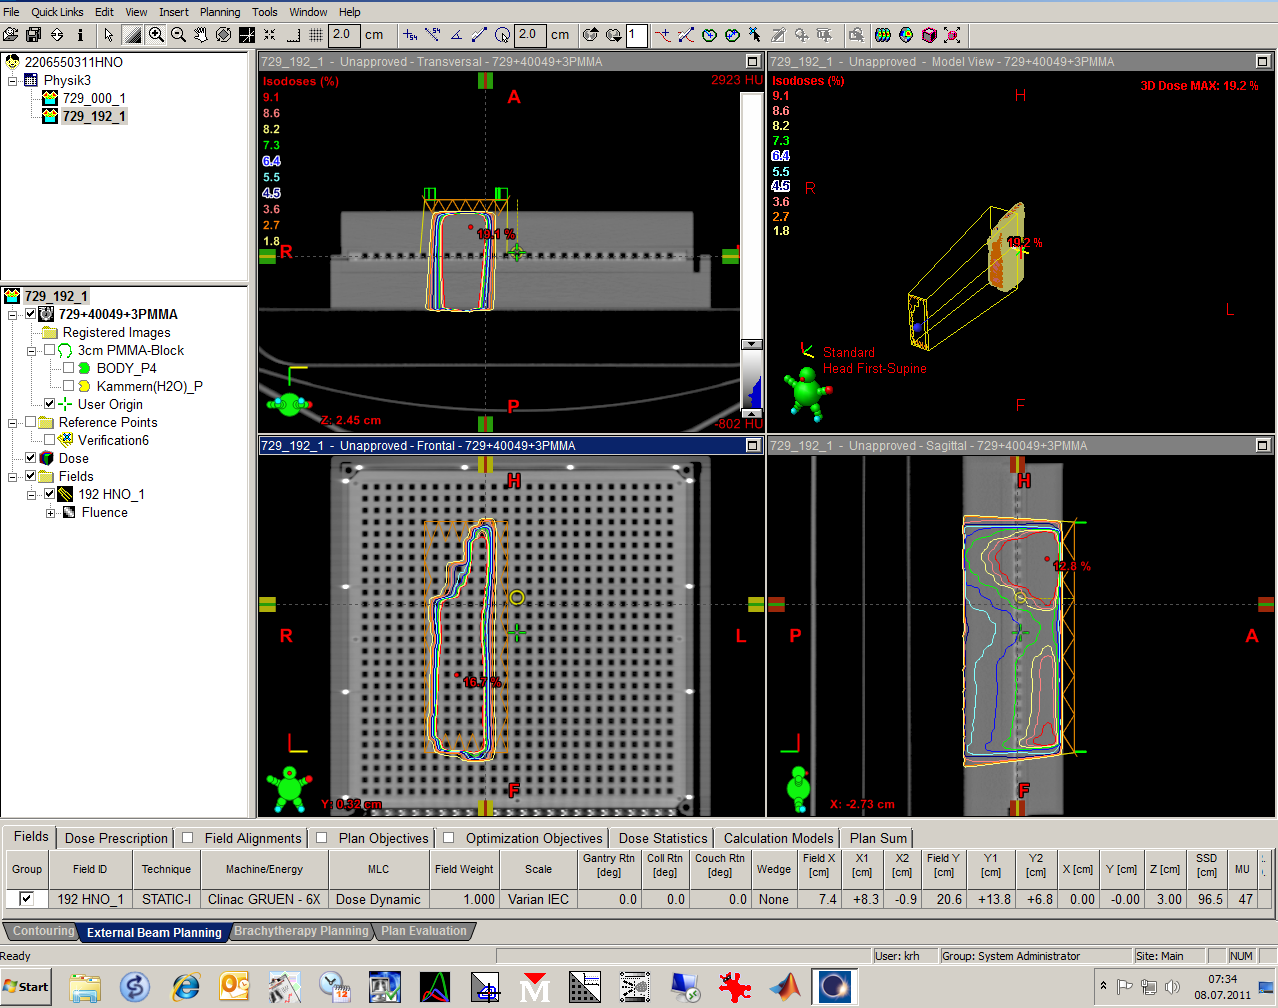
Seven29 analysis
A high-resolution seven29 analysis (our gold standard) gives the definite answer to the question: is there something wrong with the two split fields 192_1 and 304_1?
The fields were measured in 3.5 cm depth against a 10x10 reference field. To increase spatial resolution, a 4-field merge was performed with the T40049 positioning phantom. This increases the number of ionization measurement points from 729 to 2916.
Here is the calculation of the 192_1 field on the positioning phantom. The chambers are masked with water as described earlier, otherwise the 4-field merge would not work. A 3 cm PMMA plate is used as buildup:
The analysis is done in VeriSoft 4.1, using a 2%/2mm gamma criterion. It looks like nothing is wrong with the field:
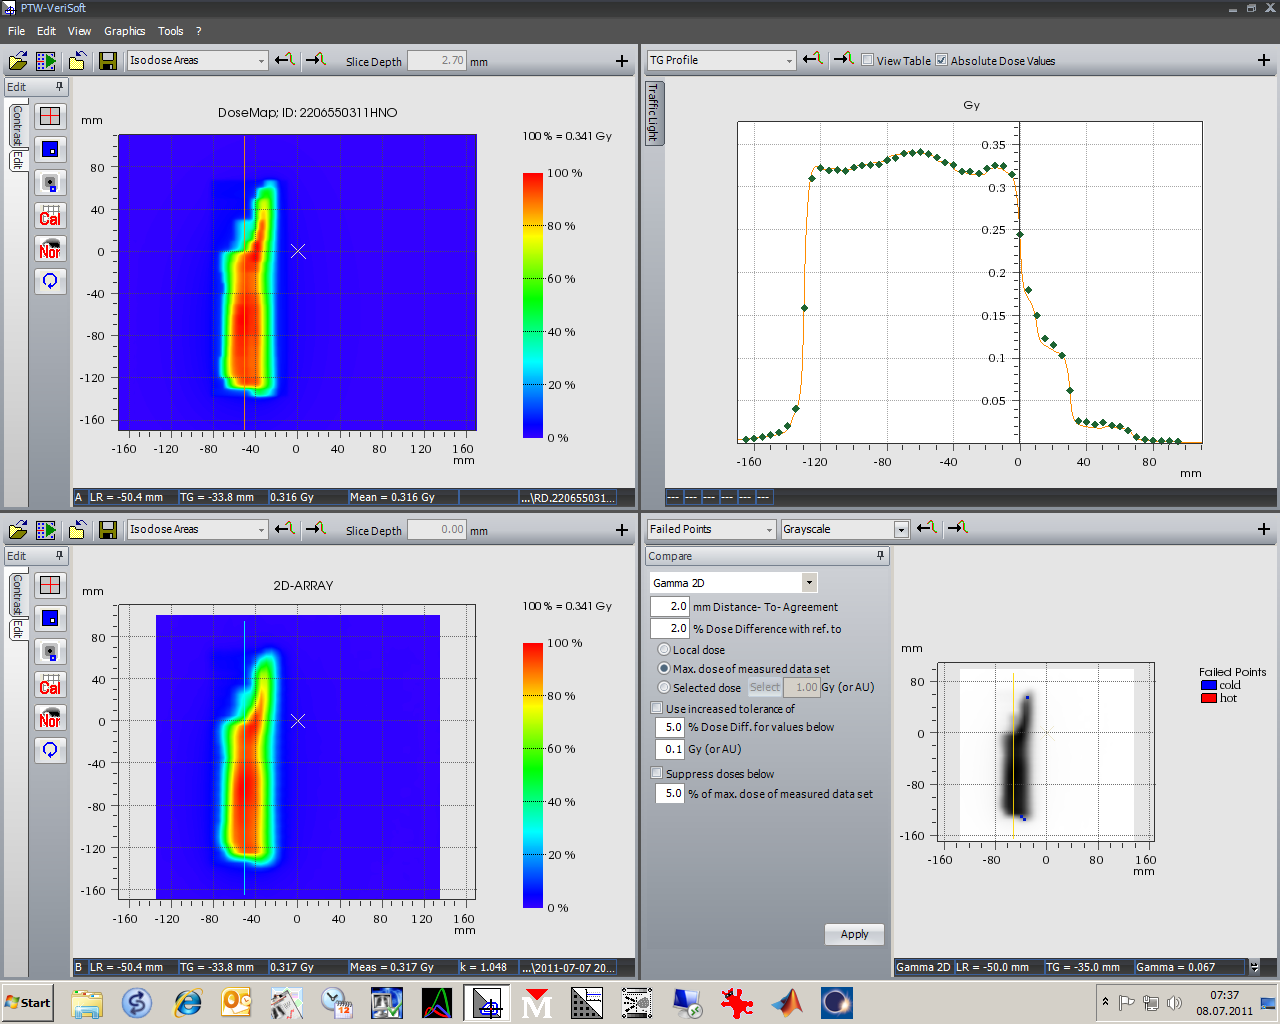
Some words on the field placement on the array: the isocenter of the fields were shifted towards the Gantry by 35 mm. A longitudinal shift of 5 mm aligns the MLC leaves with the array's chambers, 30 mm center the (asymmetrical) field on the array. The detected field area is 100%, as described here.
Conclusion
Having a fast method for daily routine is important. However, for "suspicious cases" like this one, it helps to use a completely different measurement method, like the 2D-Array. In the end, a decision has to be made which system should be trusted.