The seven29's Effective Point of Measurement
A question that comes up sometimes when using the 2D-ARRAY for IMRT verification or other comparisons between measurement and TPS calculation is this:
Where is the 2D-ARRAY's effective point of measurement? This information is needed in order to select in the treatment planning system the correct plane for dose comparison. But at which vertical position should the horizontal dashed line exactly be set? Which calculated plane corresponds to the 729 measured dose values?
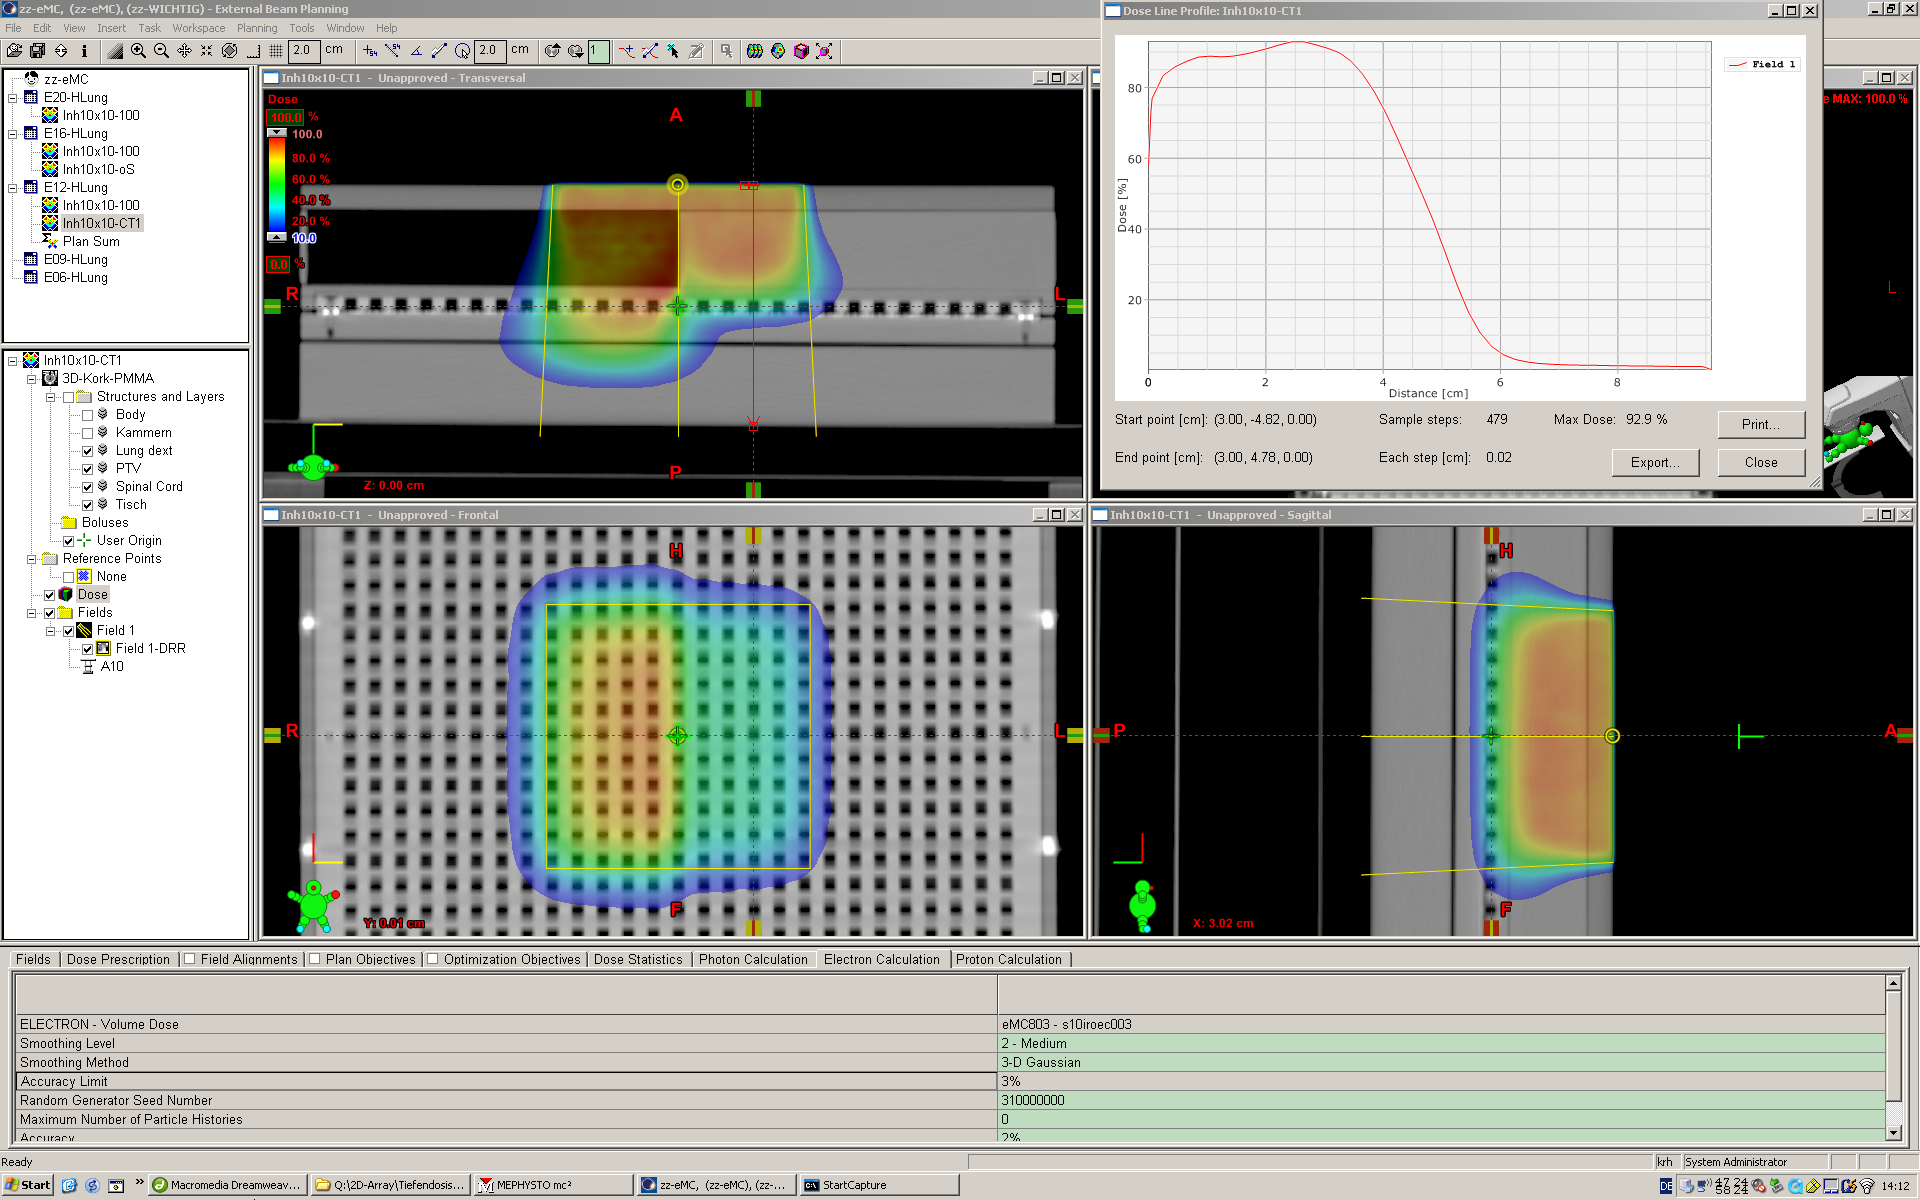
Fig.1: Preparation of a Verification Plan in Eclipse (Electron Monte-Carlo, 12 MeV). Here, the horizontal dose
plane (dashed) is placed in the chamber center. Click to show full setup.
If the ARRAY's chambers were plane-parallel, one could expect the effective point of measurement P(eff) at the center of the entrance window's inner surface.
If the chambers were cylinders, there would be displacement theories, like "the effective point is shifted in direction of the focus 0.5 times the chamber's inner radius" etc.
But the 729 chambers are cubic.
Experimental determination of P(eff)
We determined P(eff) experimentally: taking a Roos chamber depth ionization curve in water as reference, pointwise depth dose curves were measured with the 2D-ARRAY in RW3 solid water and compared. For the solid water measurements, the zero depth was taken at the surface of the 2D-ARRAY:
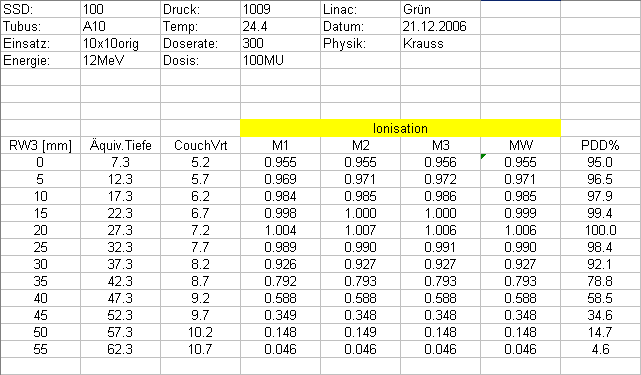
For the water phantom measurements, the Roos curve had the zero point at the inner center of the entrance window. The 1 mm thick PMMA window of the chamber was also corrected for (this gives an additional shift of 0.2 mm).
The resulting curves were shifted in depth until they matched with the reference curve. From this, the location of P(eff) was determined.
Photons
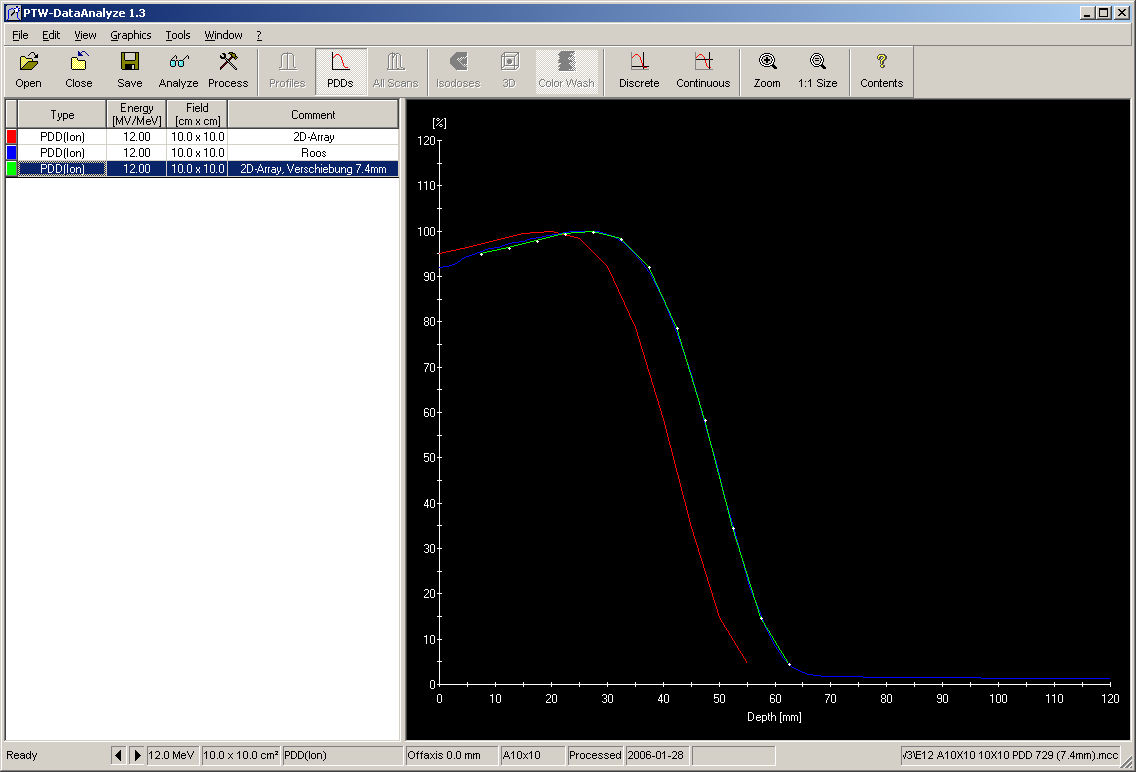
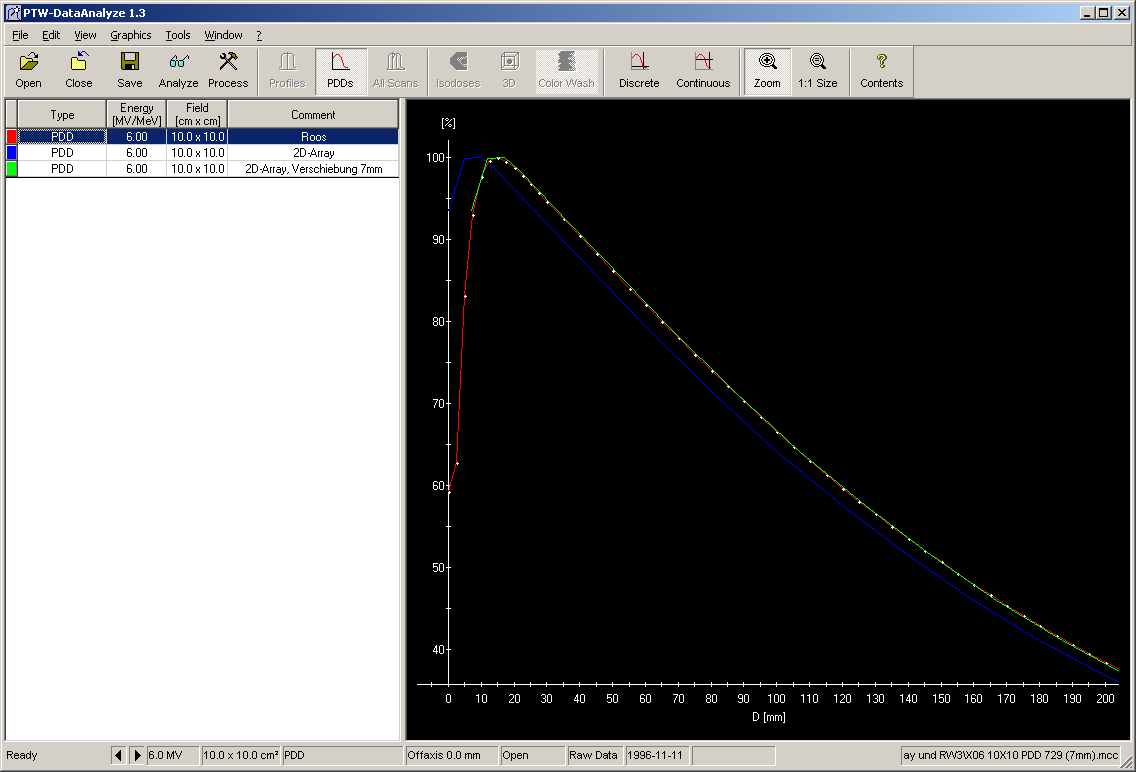
The following screenshots show the results for 6 and 15MV Photons. The necessary shift of the curves in both cases was 7 mm. (Red: Roos chamber in water. Blue: 2D-ARRAY in RW3 (unshifted). Green: same curve shifted until match.)
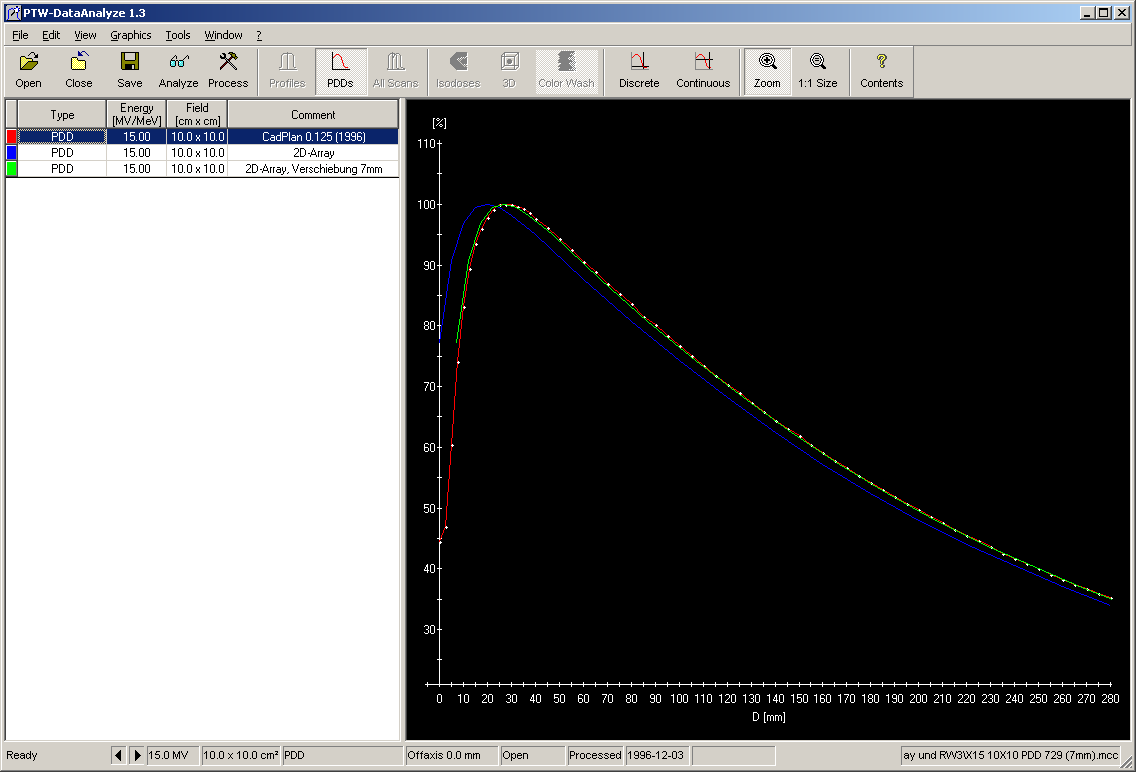
The physical thickness of the ARRAY's entrance plate is 5 mm. The radiological thickness (area density) of the phantom material is 0.6 g/cm2, according to the PTW specifications. This should normally be taken into account by the TPS - if inhomogeneities are corrected for - when calculating dose based on a CT-scanned ARRAY.
Therefore, the plane 1 mm behind the ARRAY chamber's entrance windows represents the measured values best. In other words: P(eff) seems to be shifted upstream by about 1.5 mm.
Update (Jan 2021): This conclusion seem to be wrong (Thanks to L.V. for pointing out the error). If the blue curve has to be shifted downstream by 7 mm in order to match with the reference curve in the graph, this is equivalent to shifting the unknown "measurement point" P(eff) from its assumed location at the ARRAY surface down by 7 mm. P(eff) should therefore be 2 mm (not 1 mm) behind the chamber's entry window (0.5 mm above chamber center). This is a pure geometrical consideration. A higher material density upstream of the chamber is irrelevant and would already be reflected in the measured blue curve.
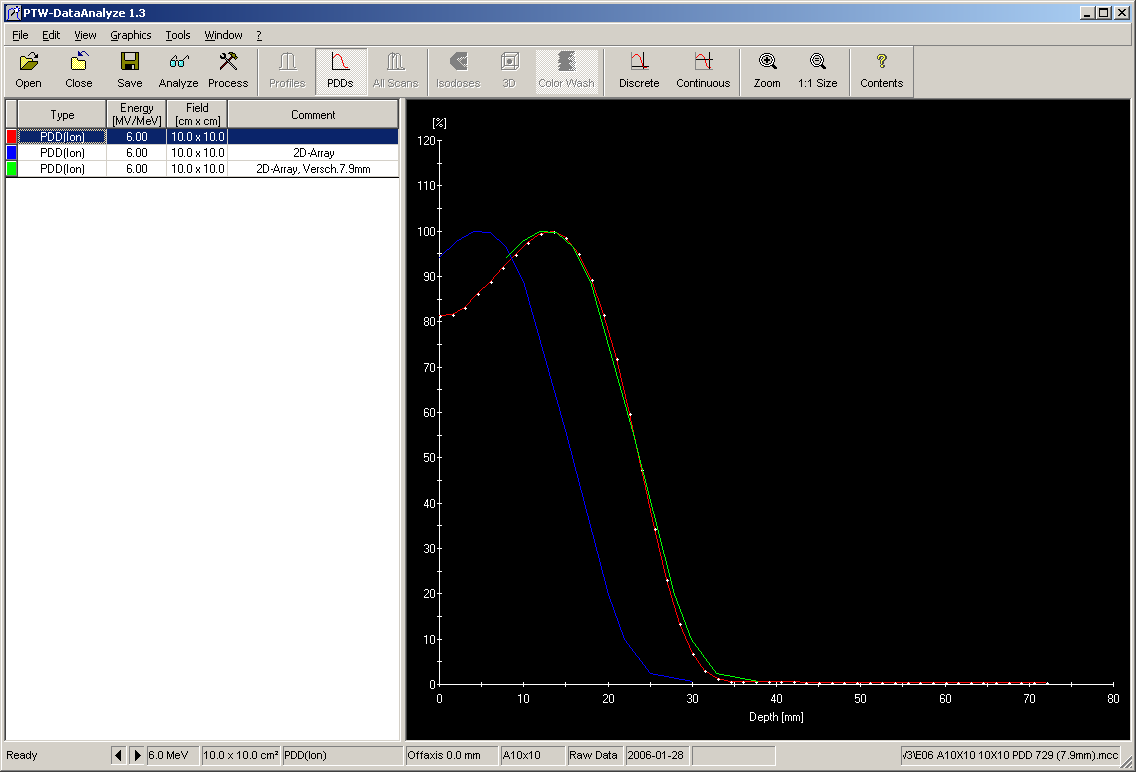
Electrons
For Electrons the shift was found to be slightly higher. The curve for 6MeV Electrons had to be shifted by 7.9 mm:
The curve for 12MeV Electrons was shifted by 7.4 mm: