
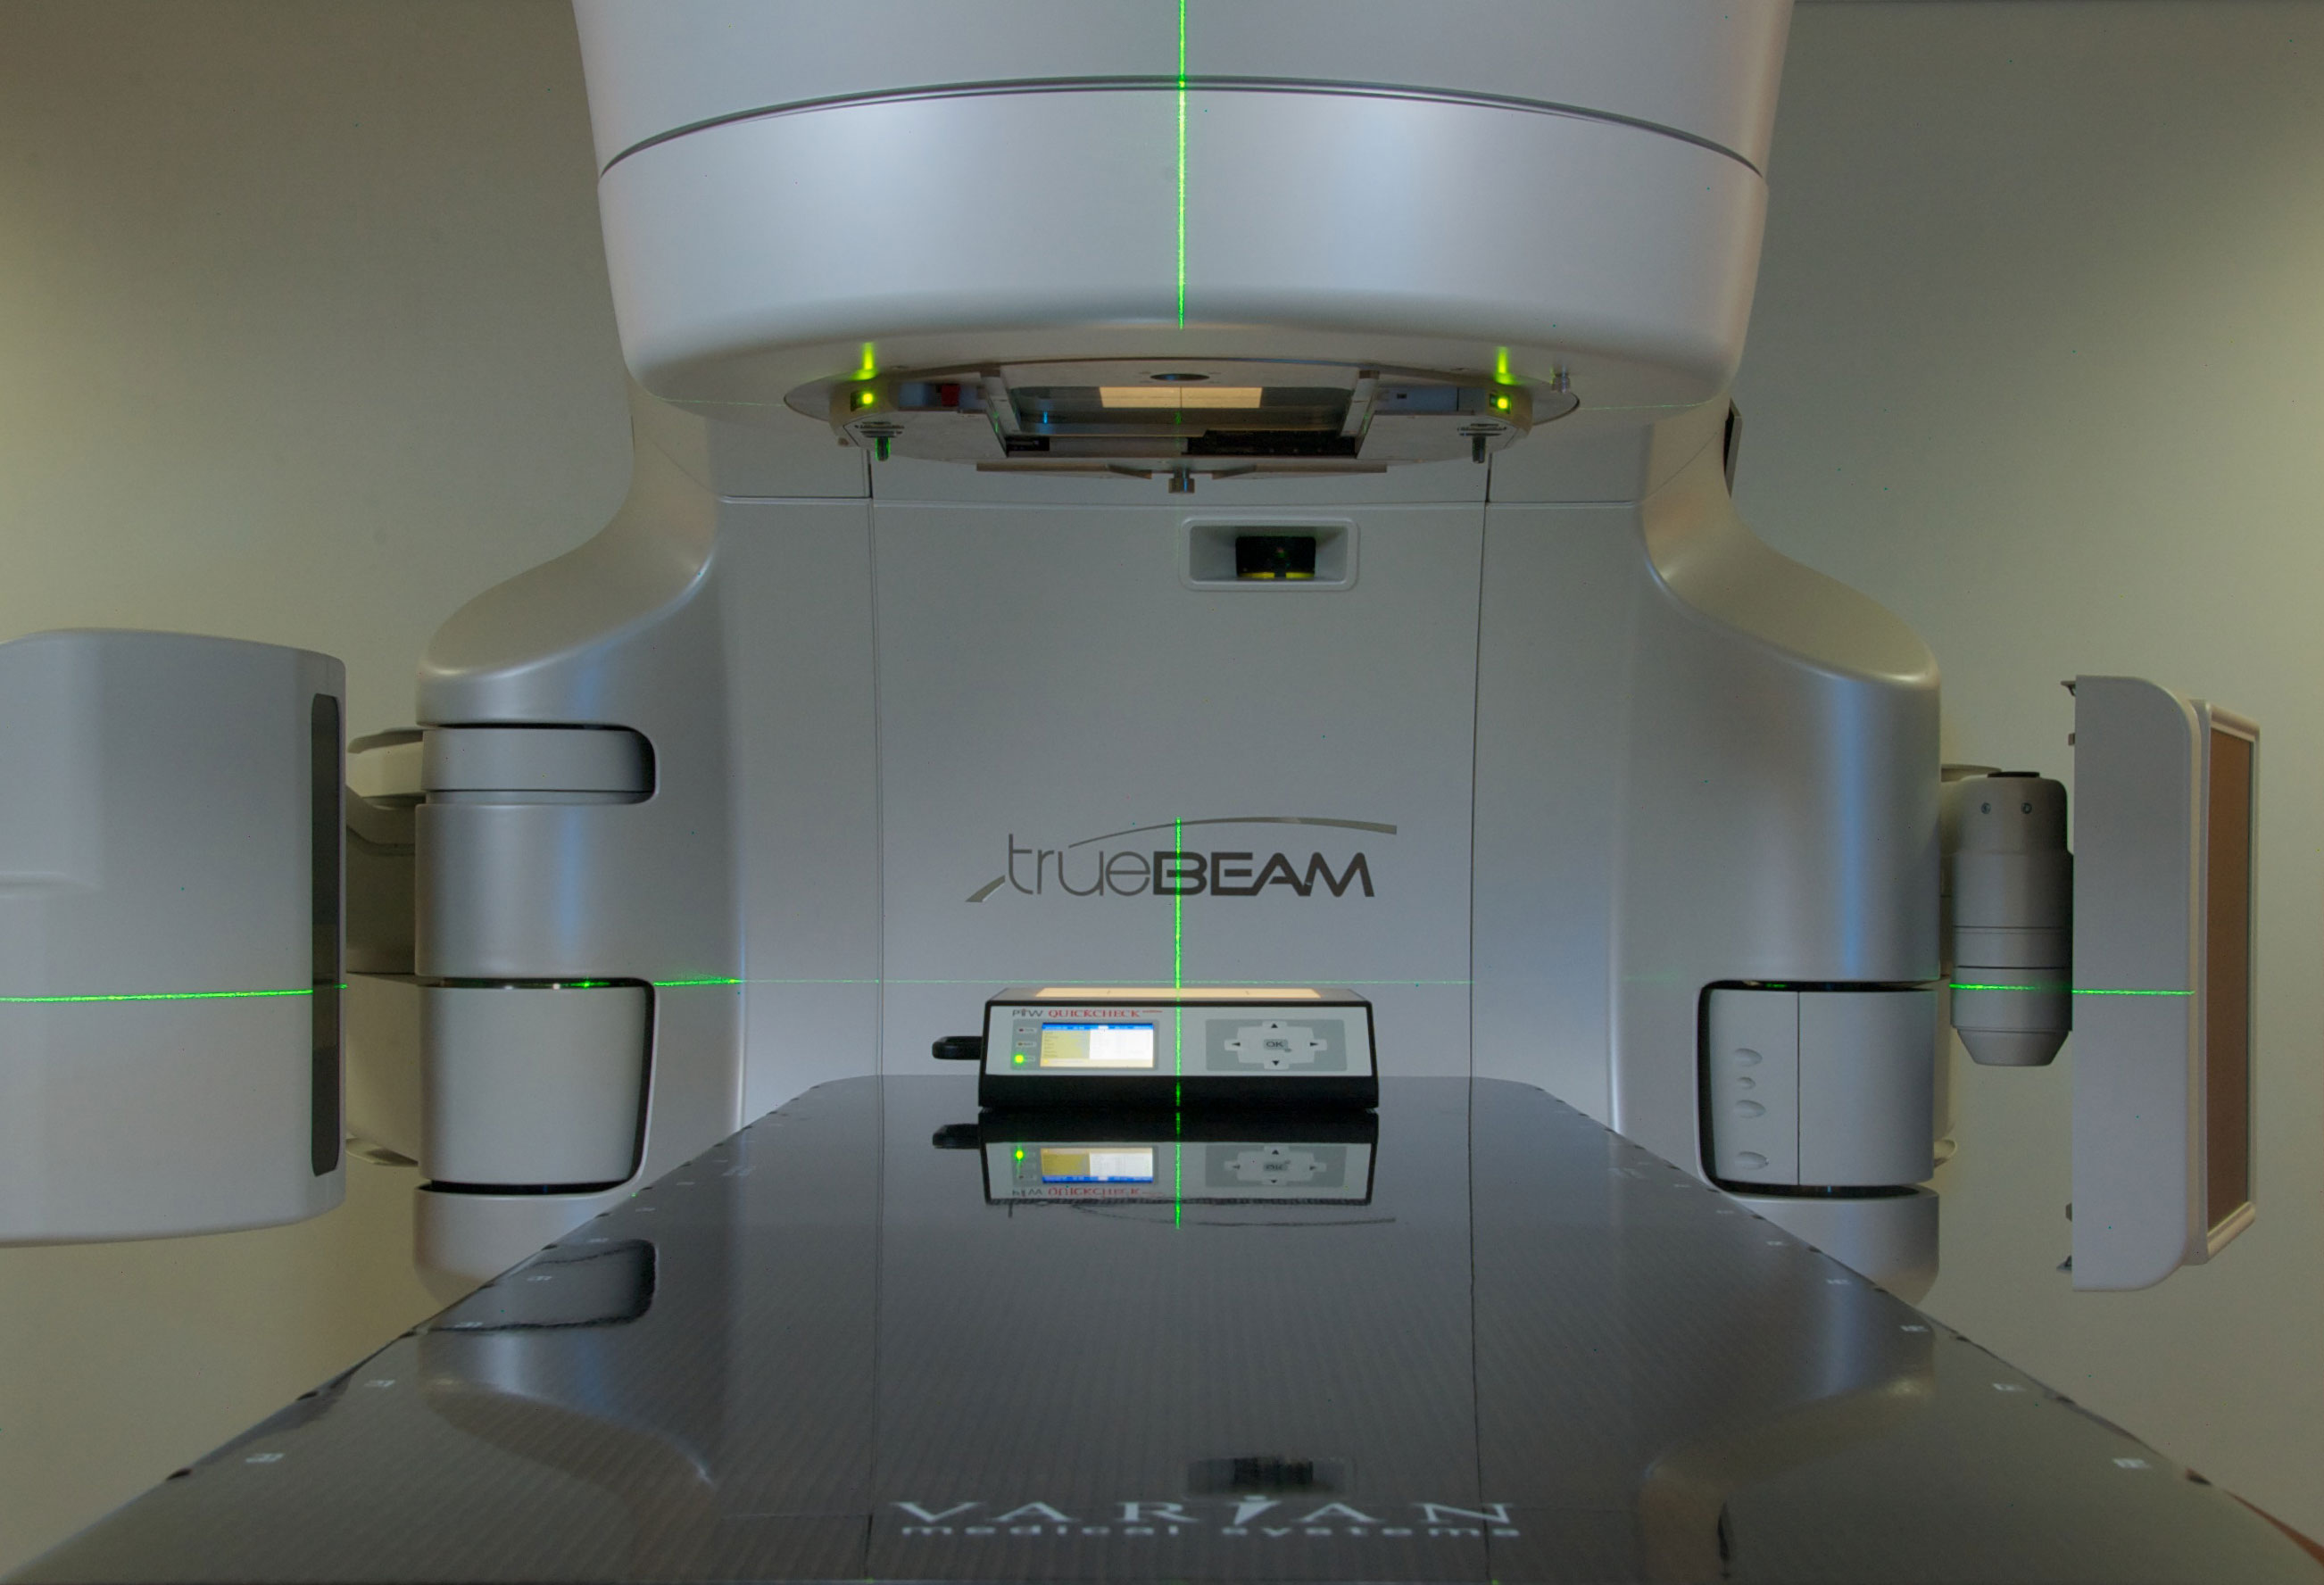
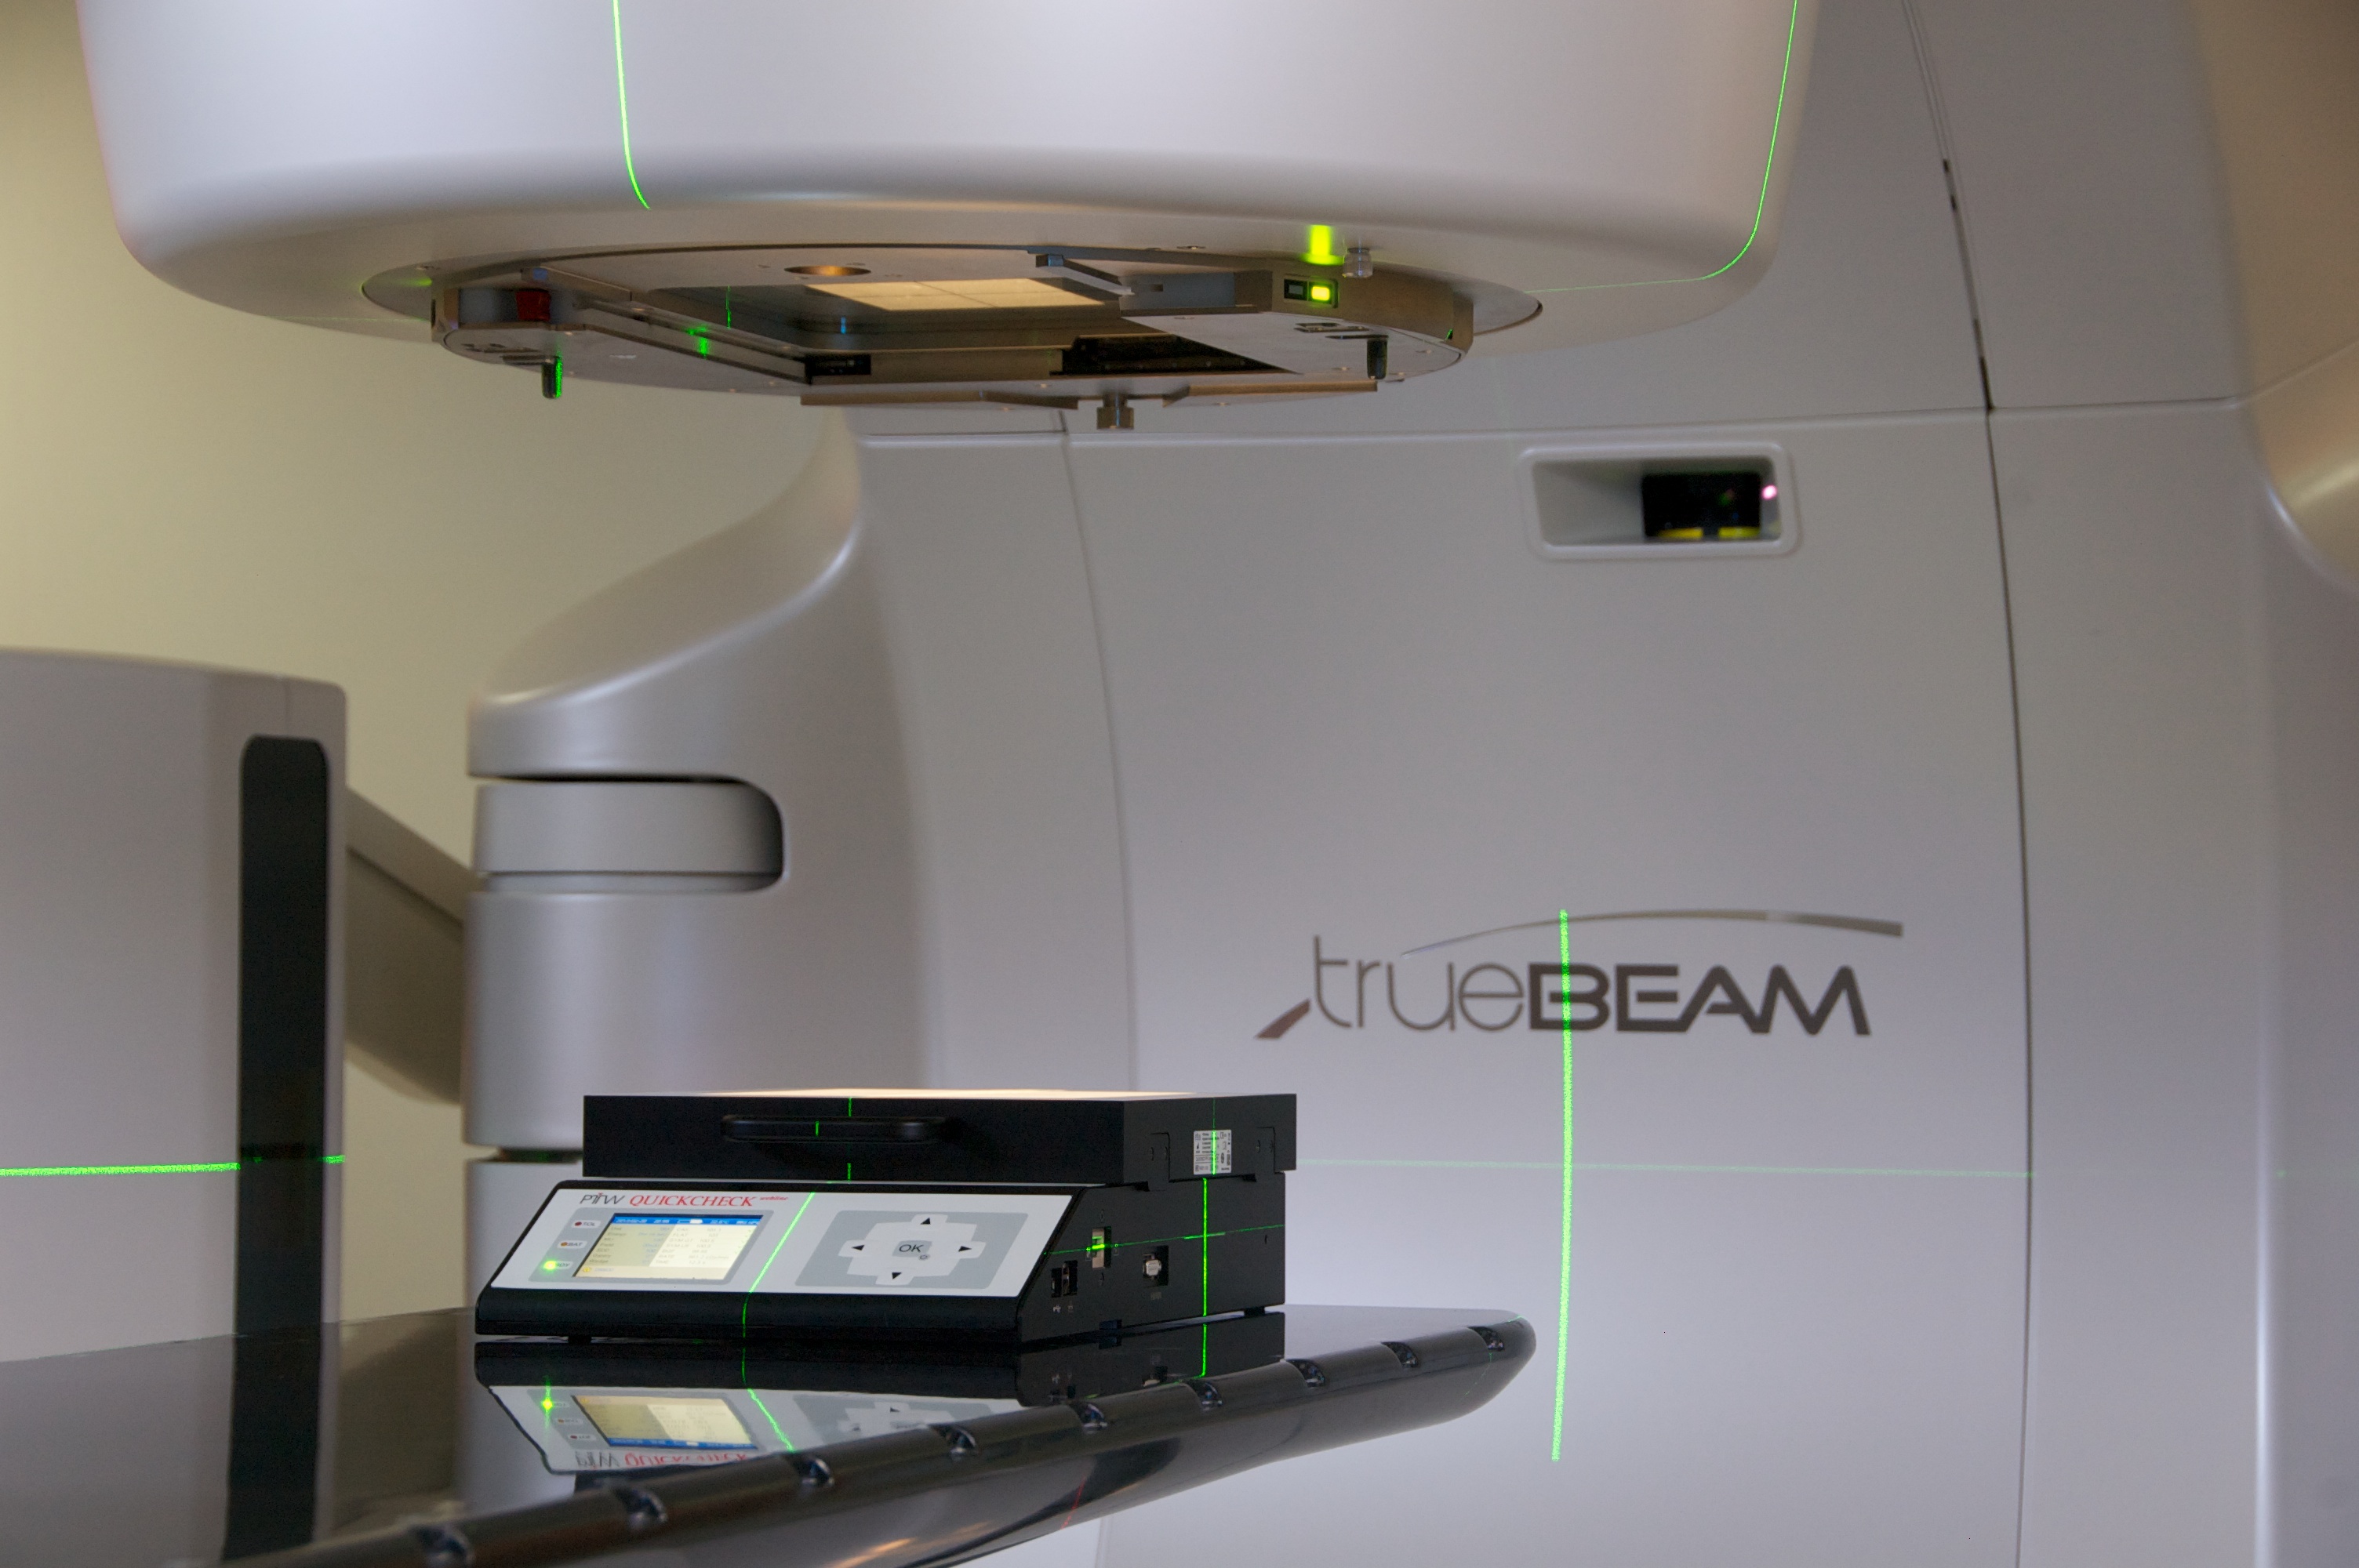
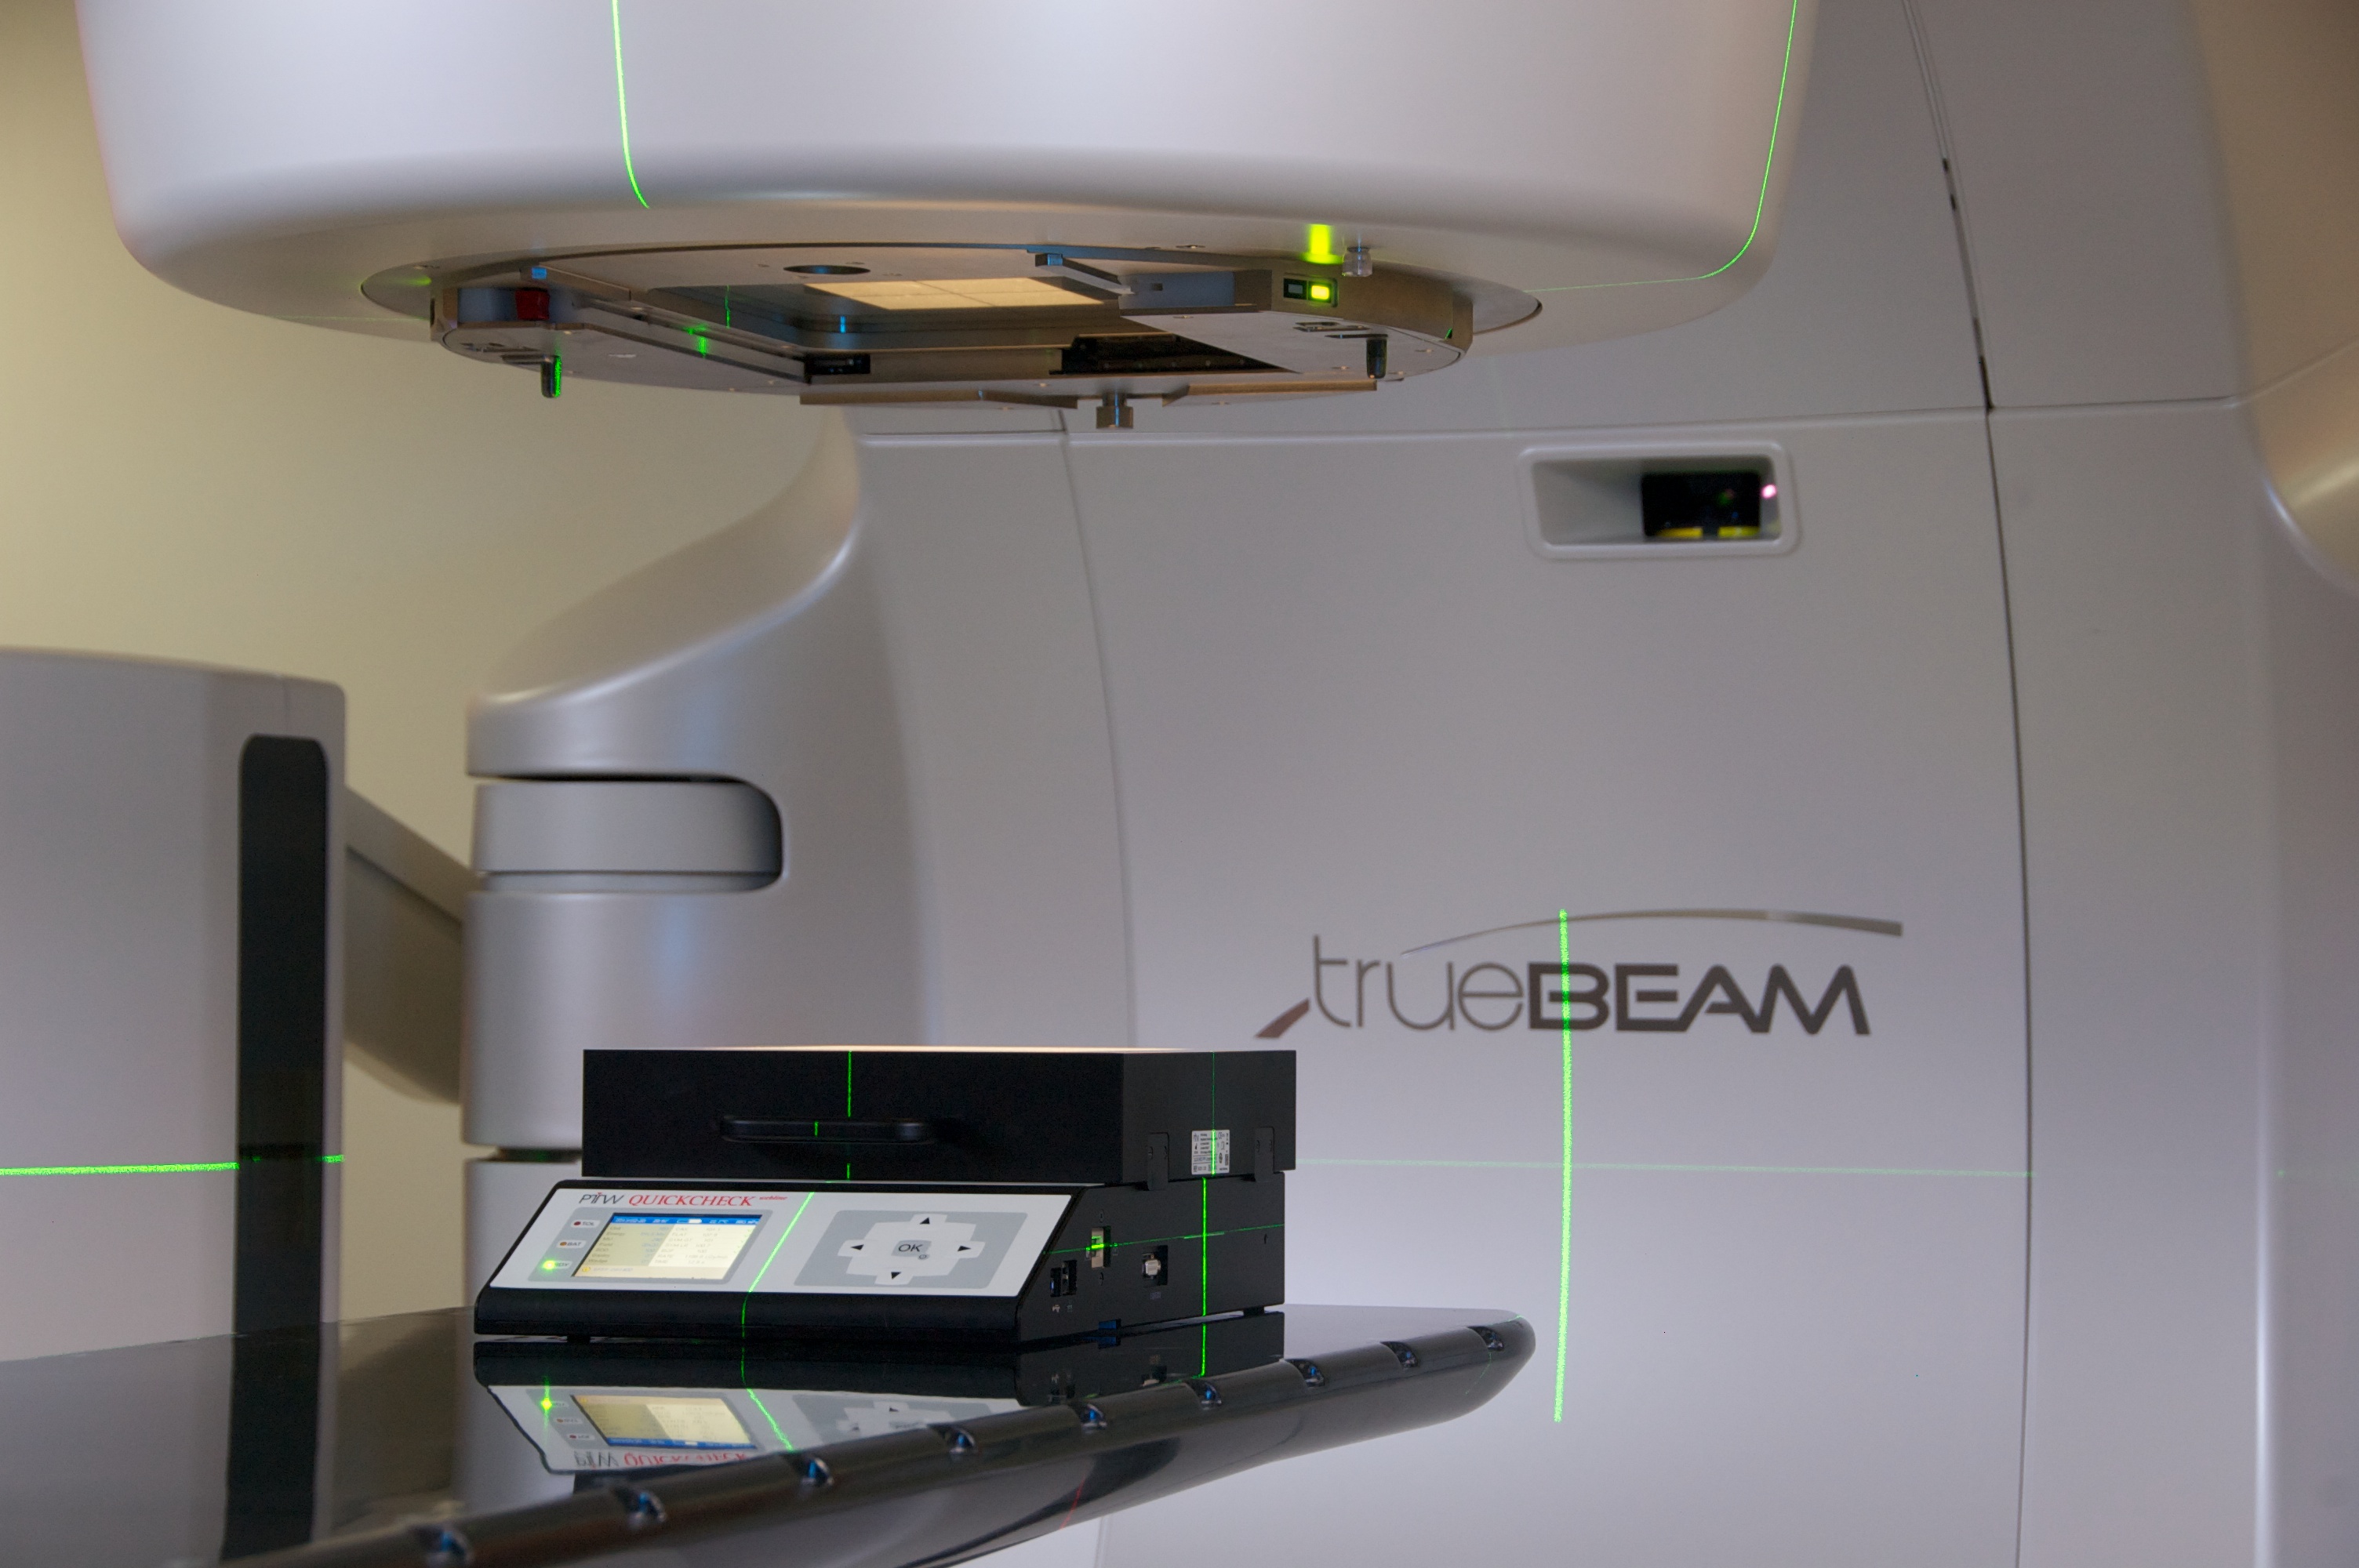
During daily QA on the TrueBeam STx, the beam performance parameters CAX dose, flatness, symmetry and beam quality factor (BQF) are measured with a QUICKCHECKwebline (QCw) from PTW.
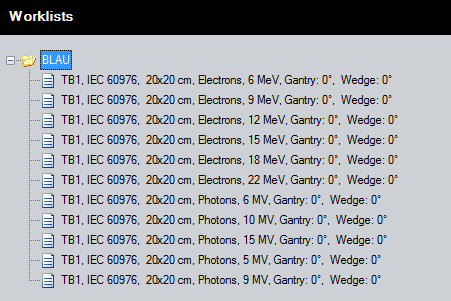
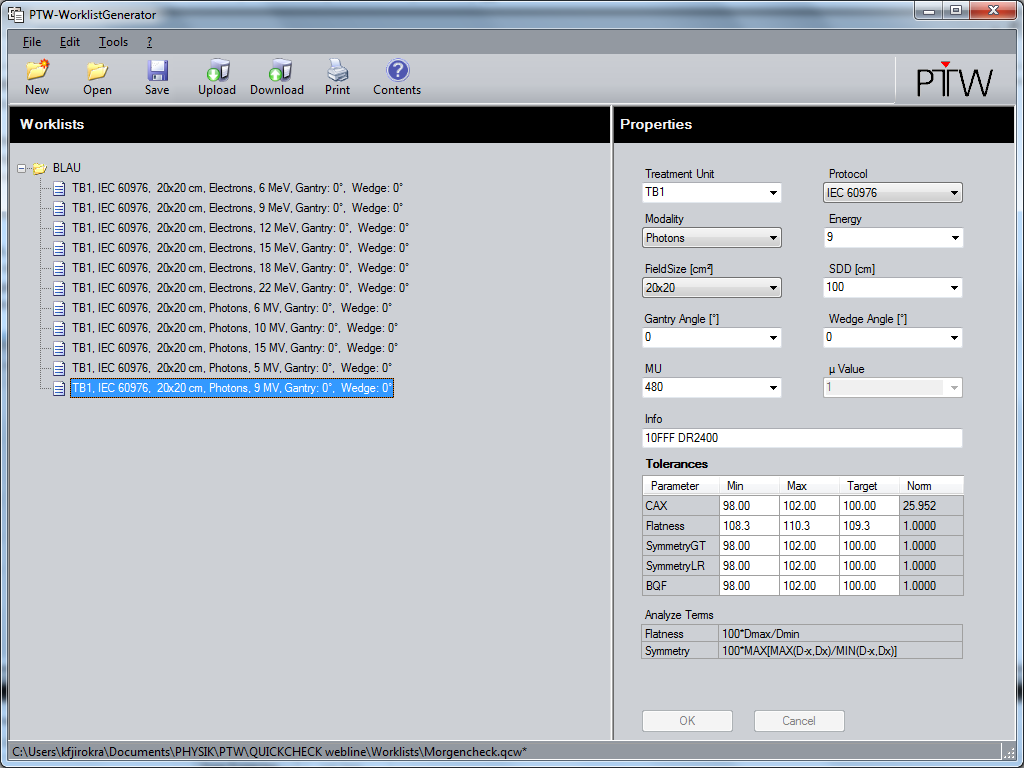
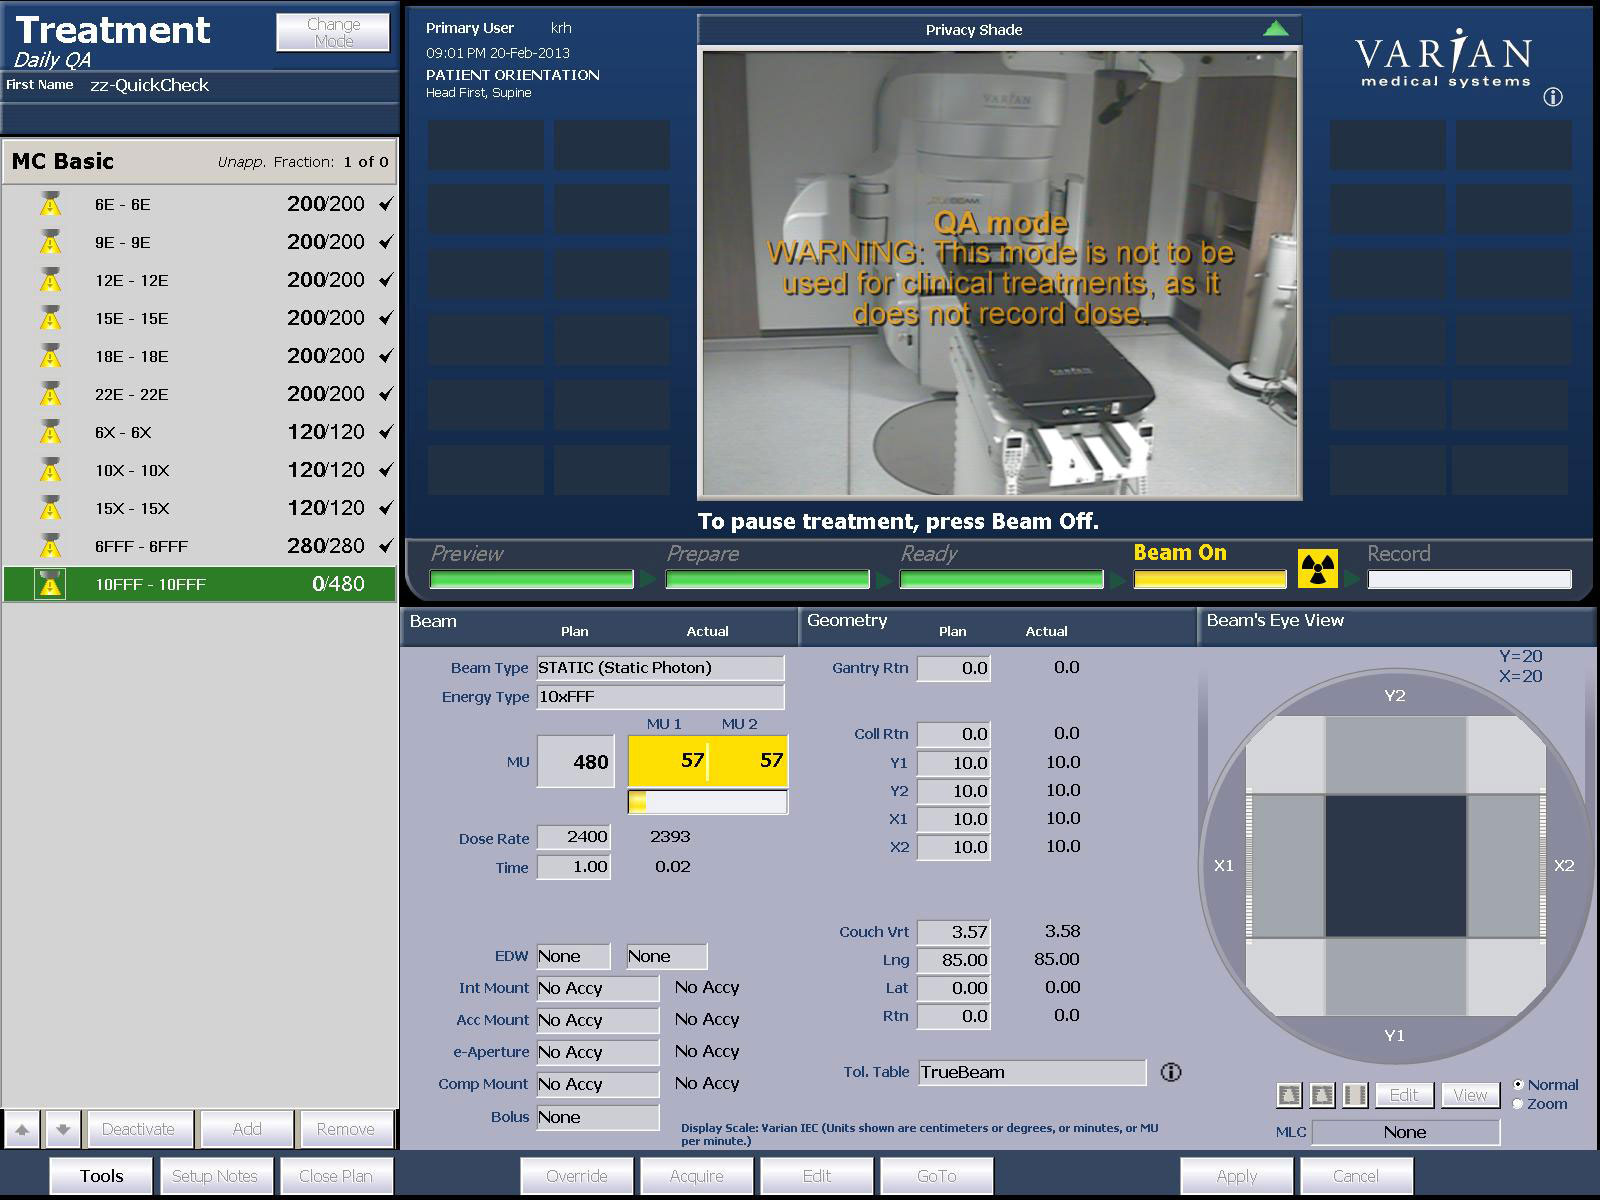
The daily check, which is typically performed between 6:00 and 6:30 a.m., consists of 11 static beams with the field size 20x20 cm for the energies E6, E9, E12, E15, E18, E22, X6, X10, X15, 6FFF, 10FFF. TrueBeam has six electron energies, three flattened and two flattening-filter free photon energies.
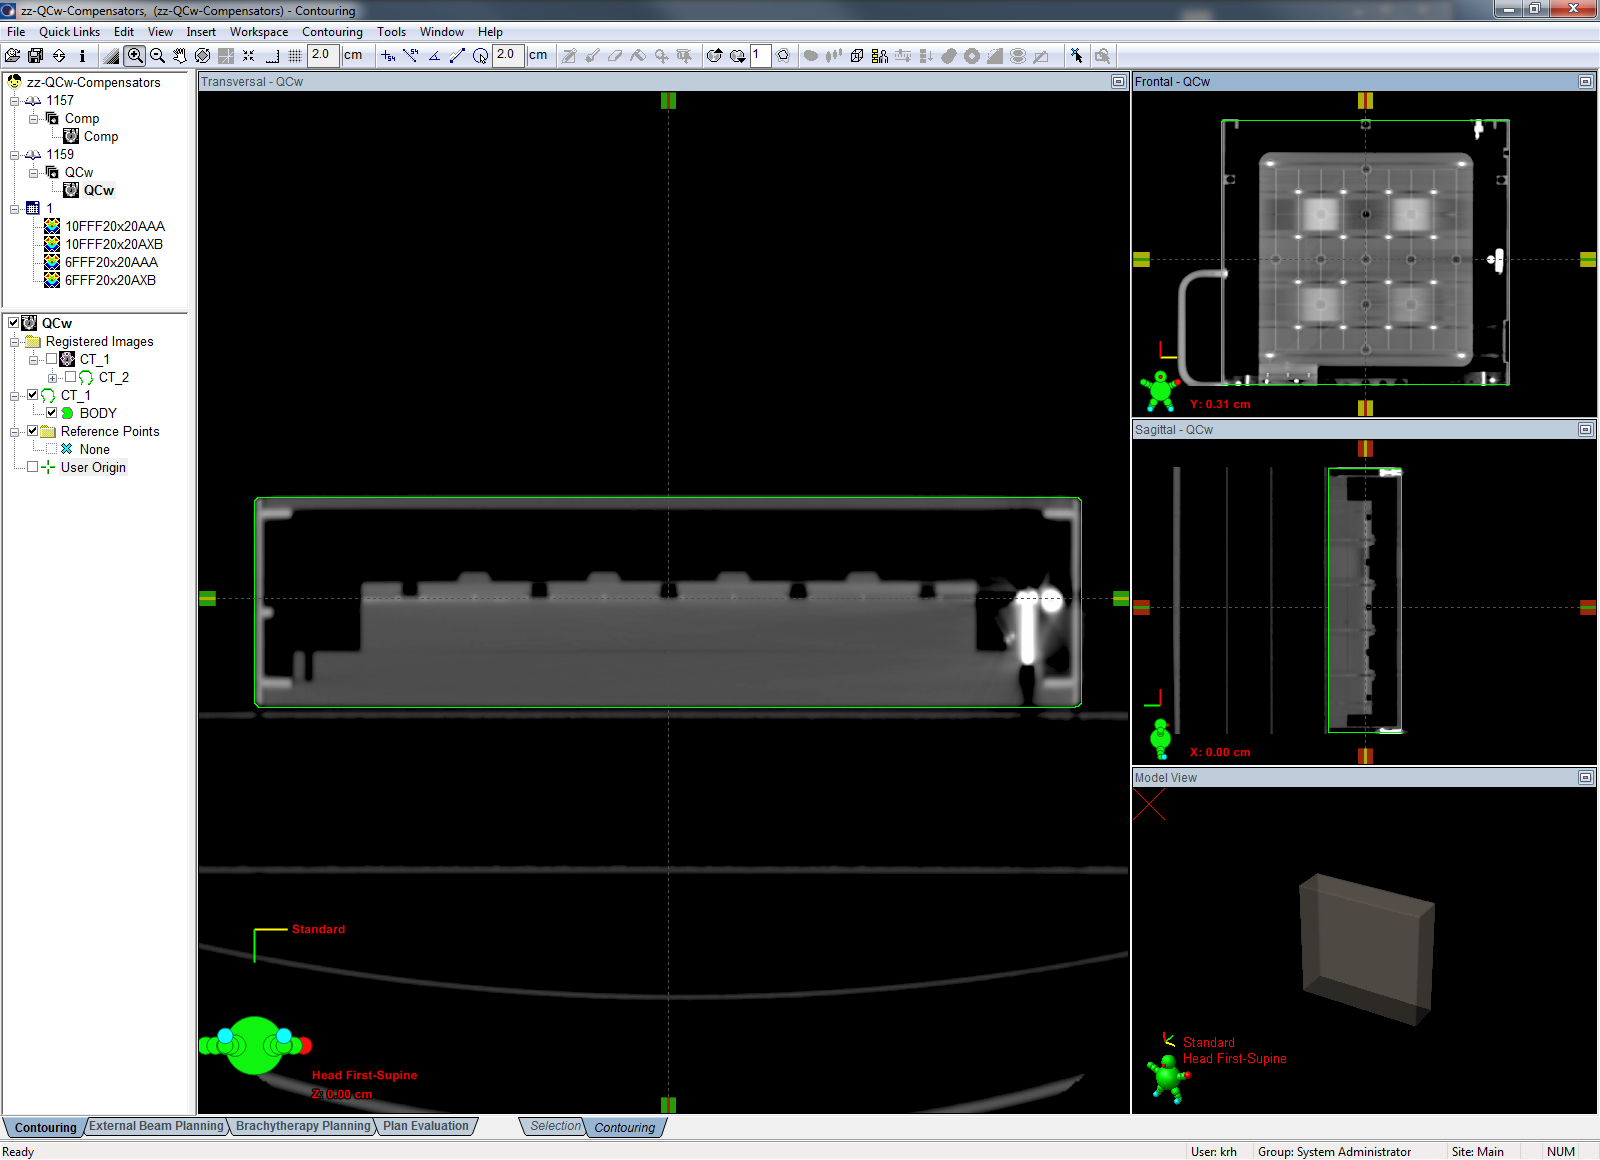
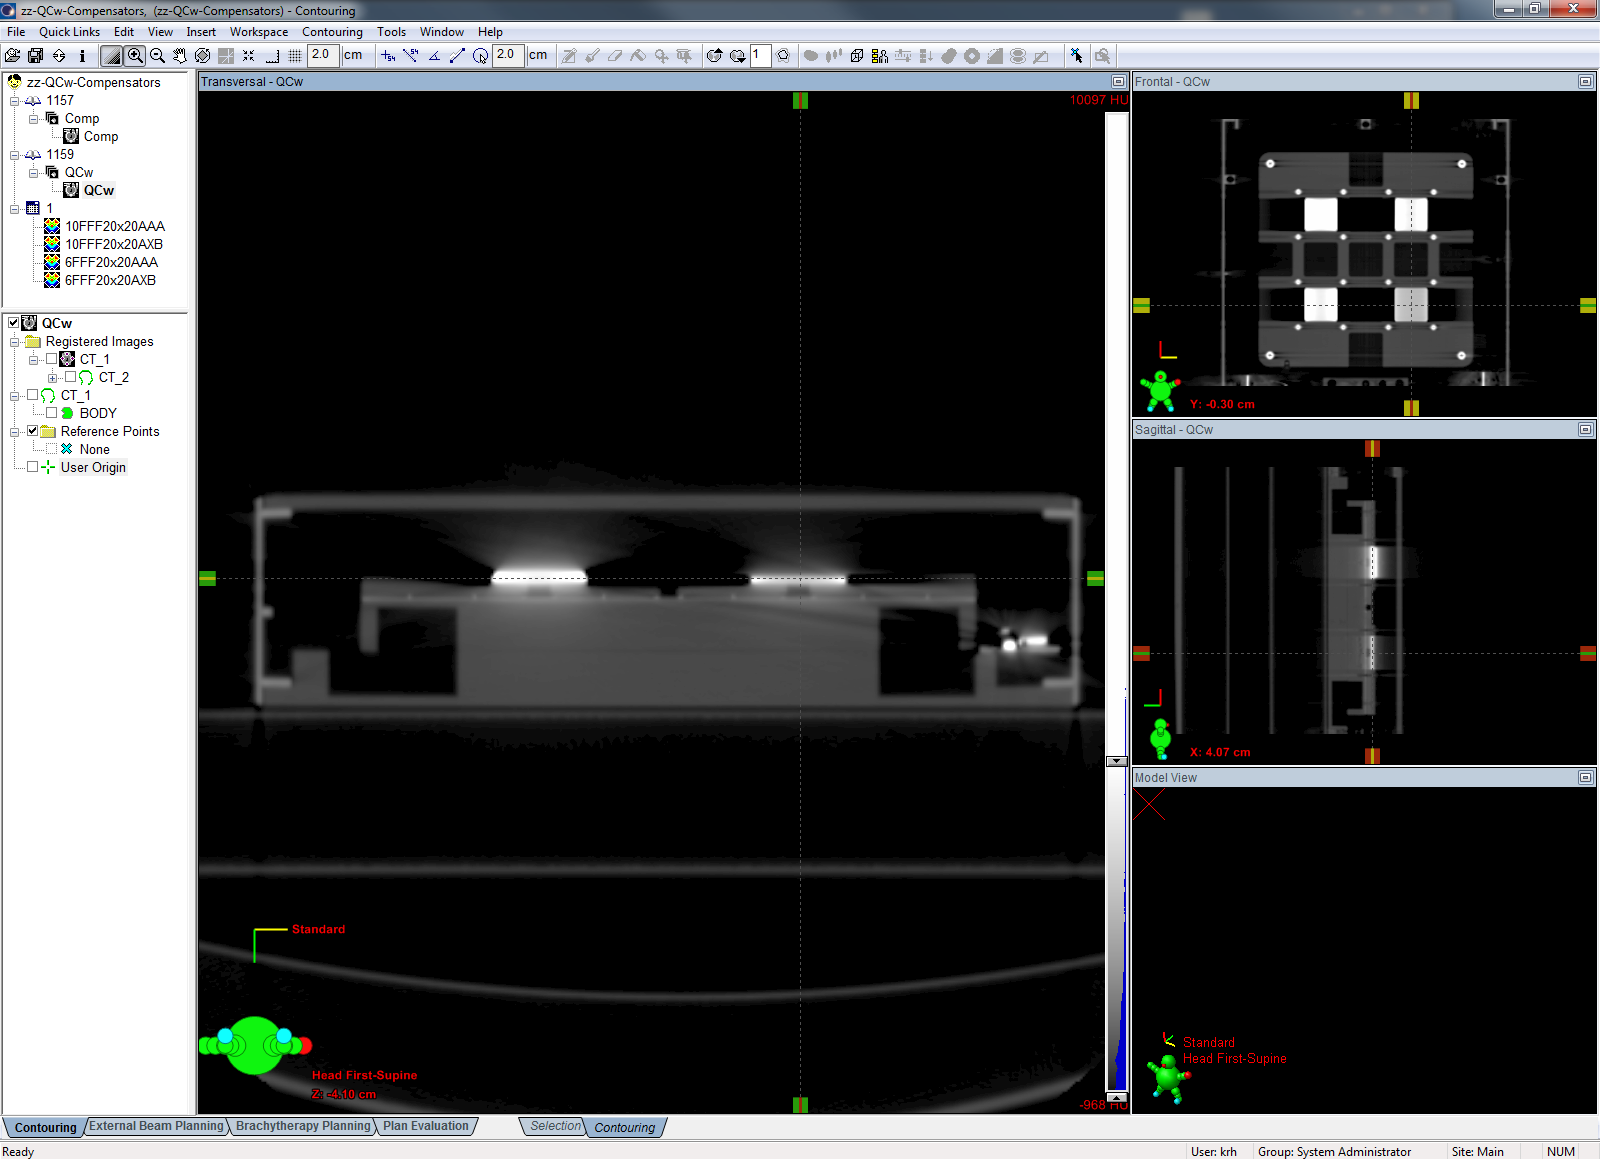
The DICOM file describing the field sequence is loaded on the TrueBeam in Daily QA mode:
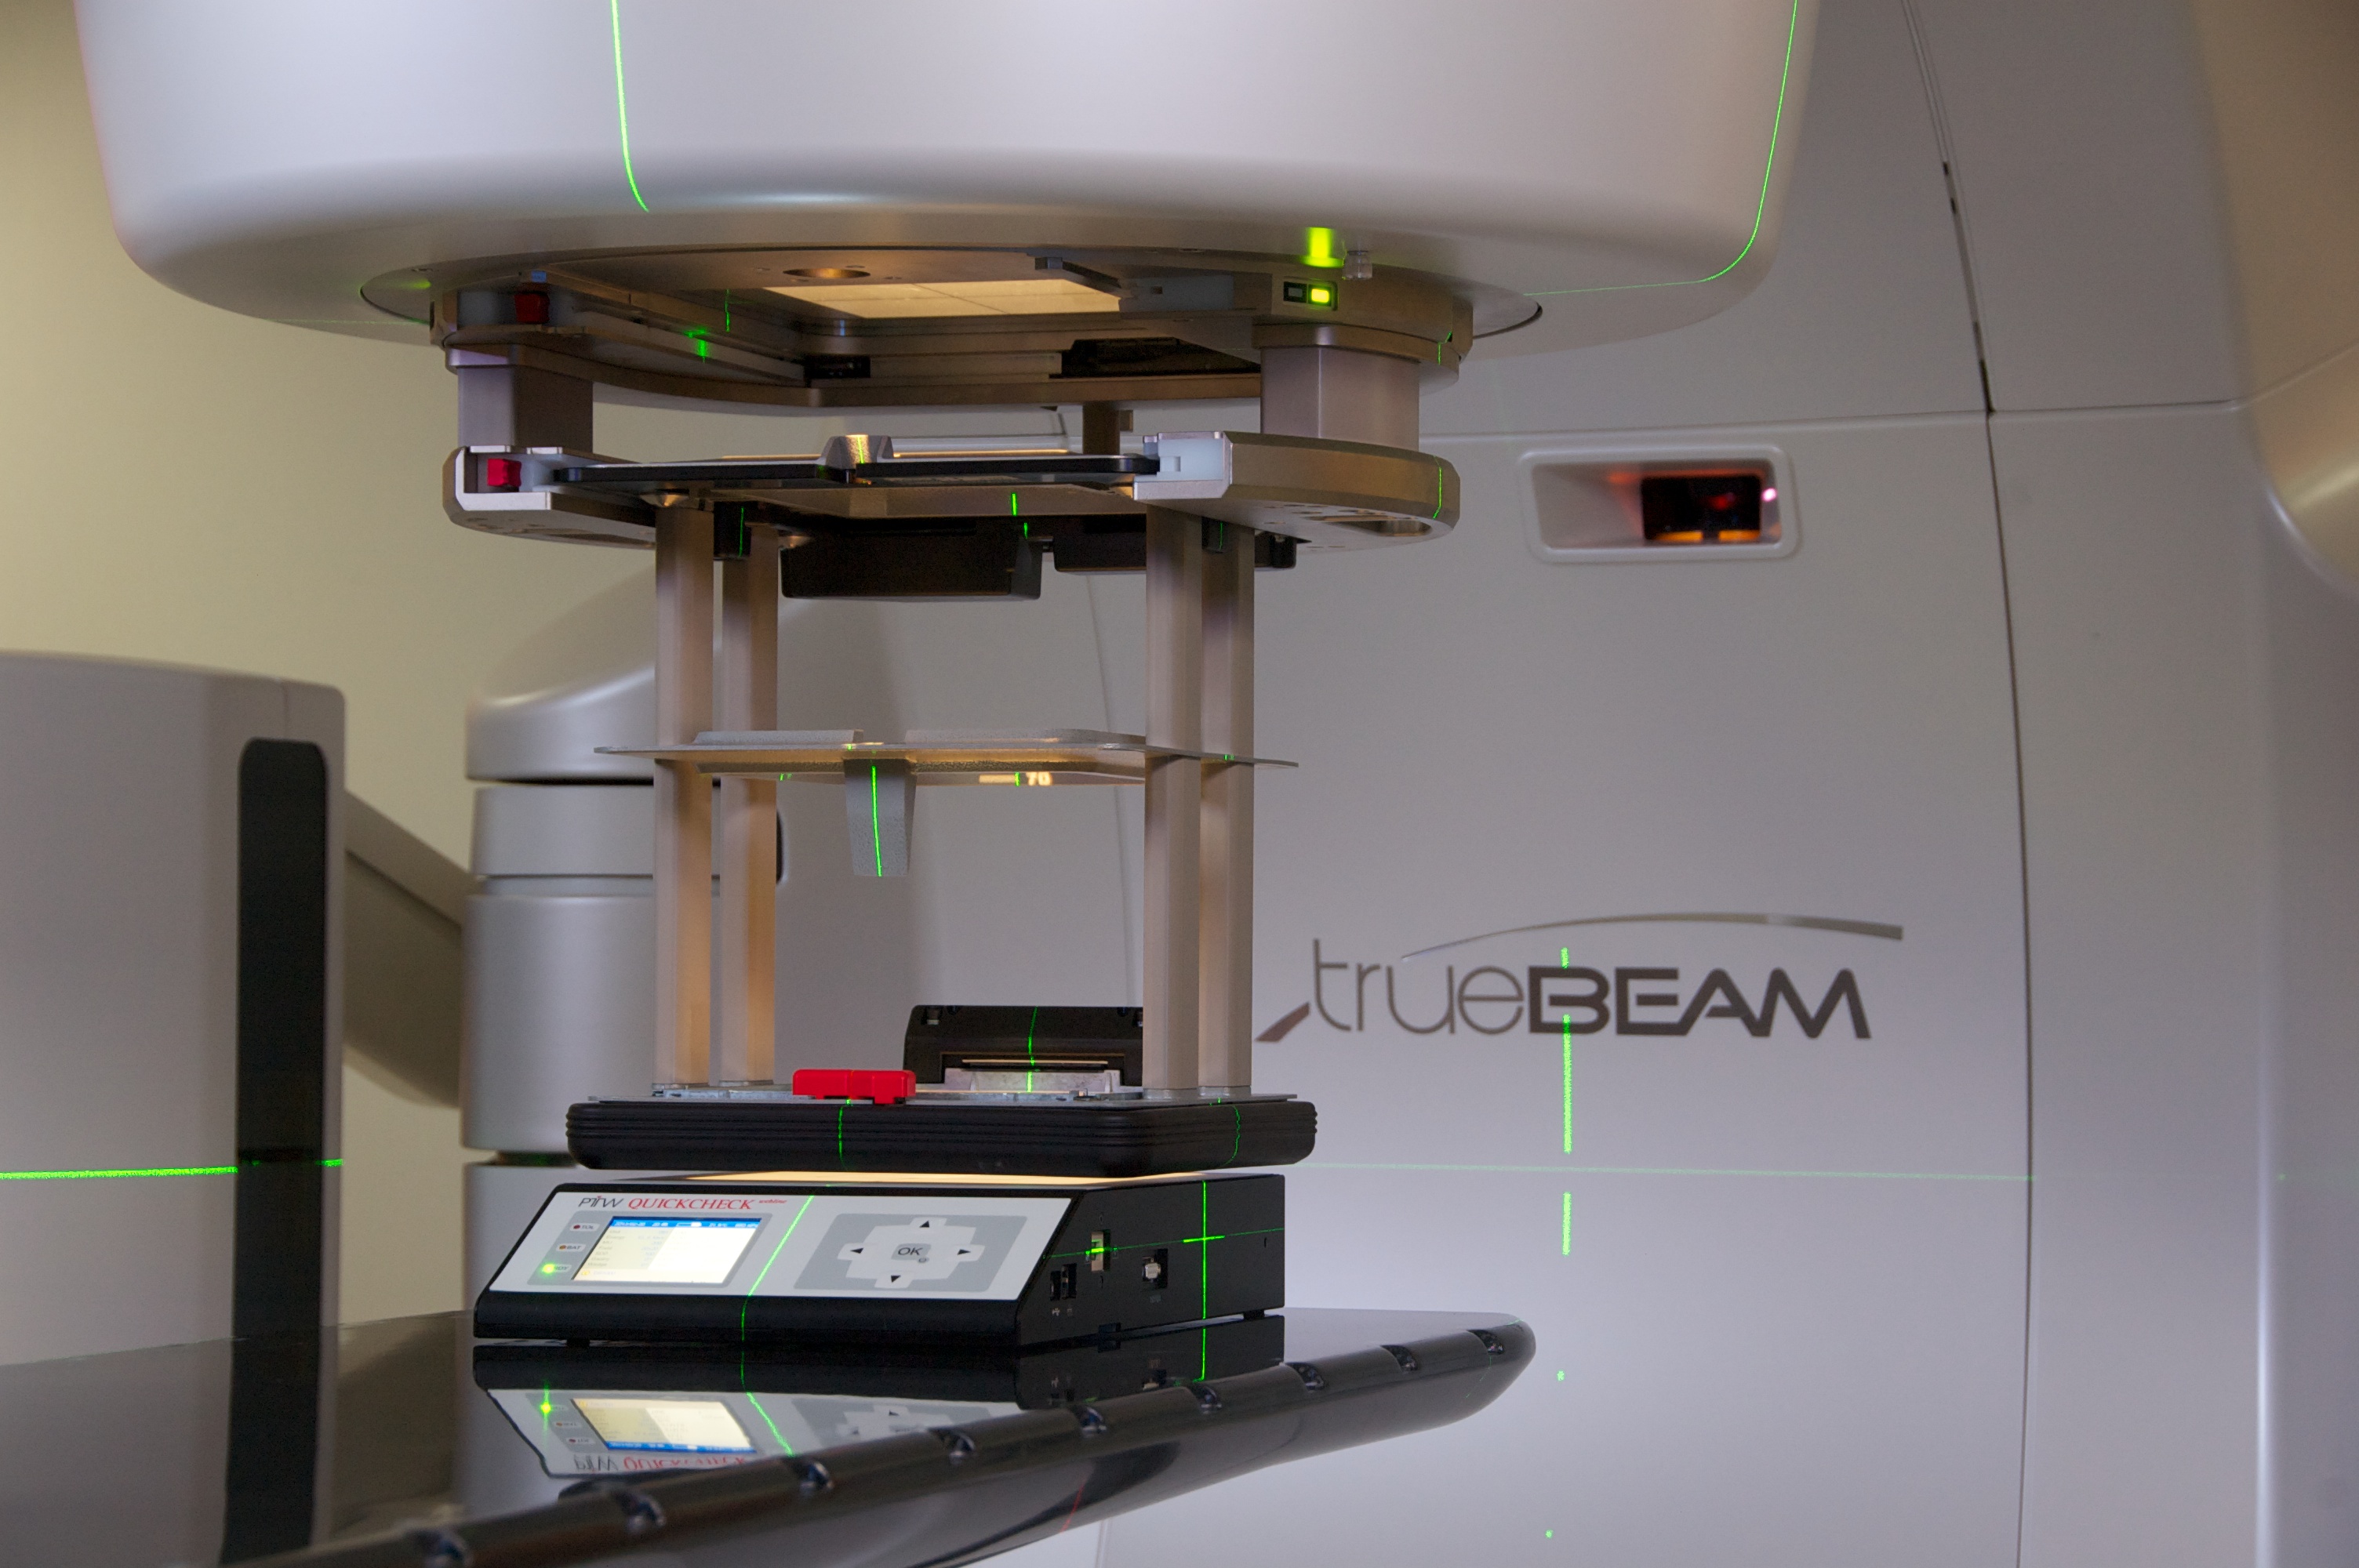
The couch parameters are part of the plan, which means that after the machine has moved to target, the QCw simply has to be aligned with the isocenter lasers longitudinally and laterally.
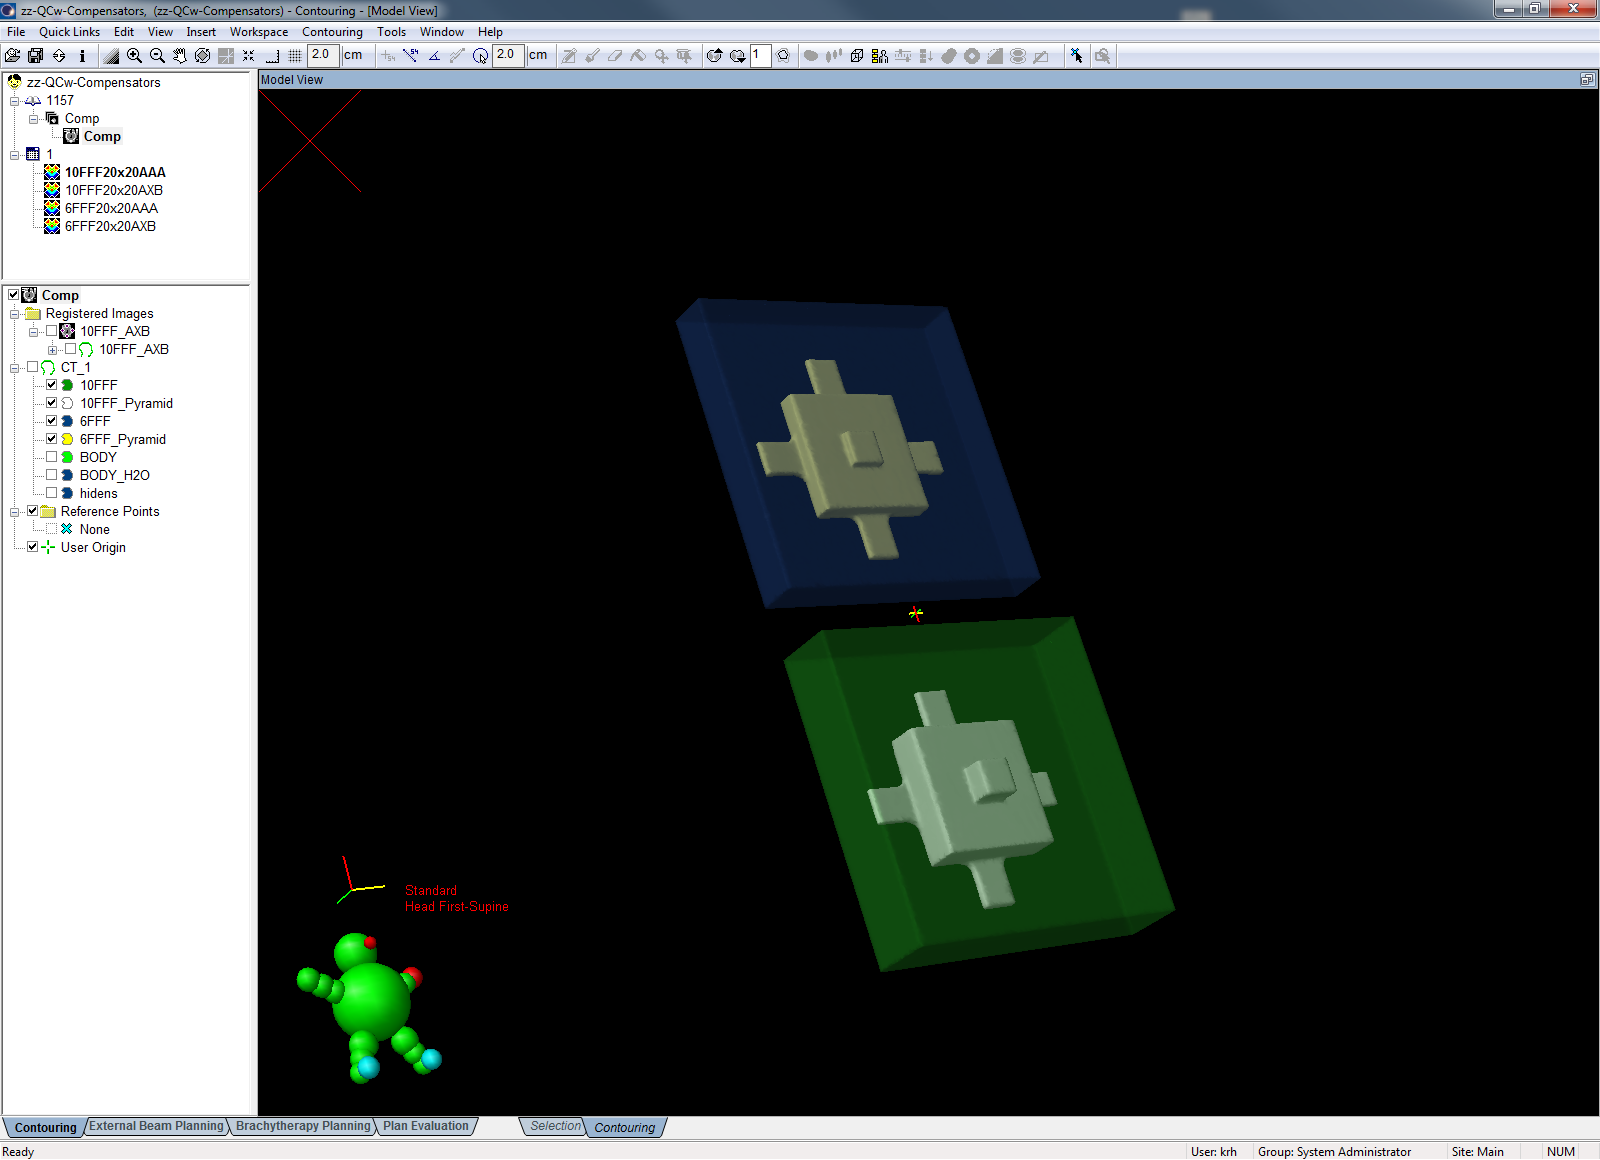
Each beam uses maximum dose rate. Since the QCw needs at least 5 seconds of beam to recognize a valid measurement, treatments must not be too short. We adjusted the number of MU to keep the beam-on time at a constant 12 seconds for all energies. This gives 120 MU for flattend photons (600 MU/min), 200 MU for electrons (1000 MU/min), 280 MU for 6FFF (1400 MU/min) and 480 MU for 10FFF (2400 MU/min). Dedicated FFF-compensators for 6FFF and 10FFF are placed on the QCw before measurement. For electrons, the A20 applicator is installed.
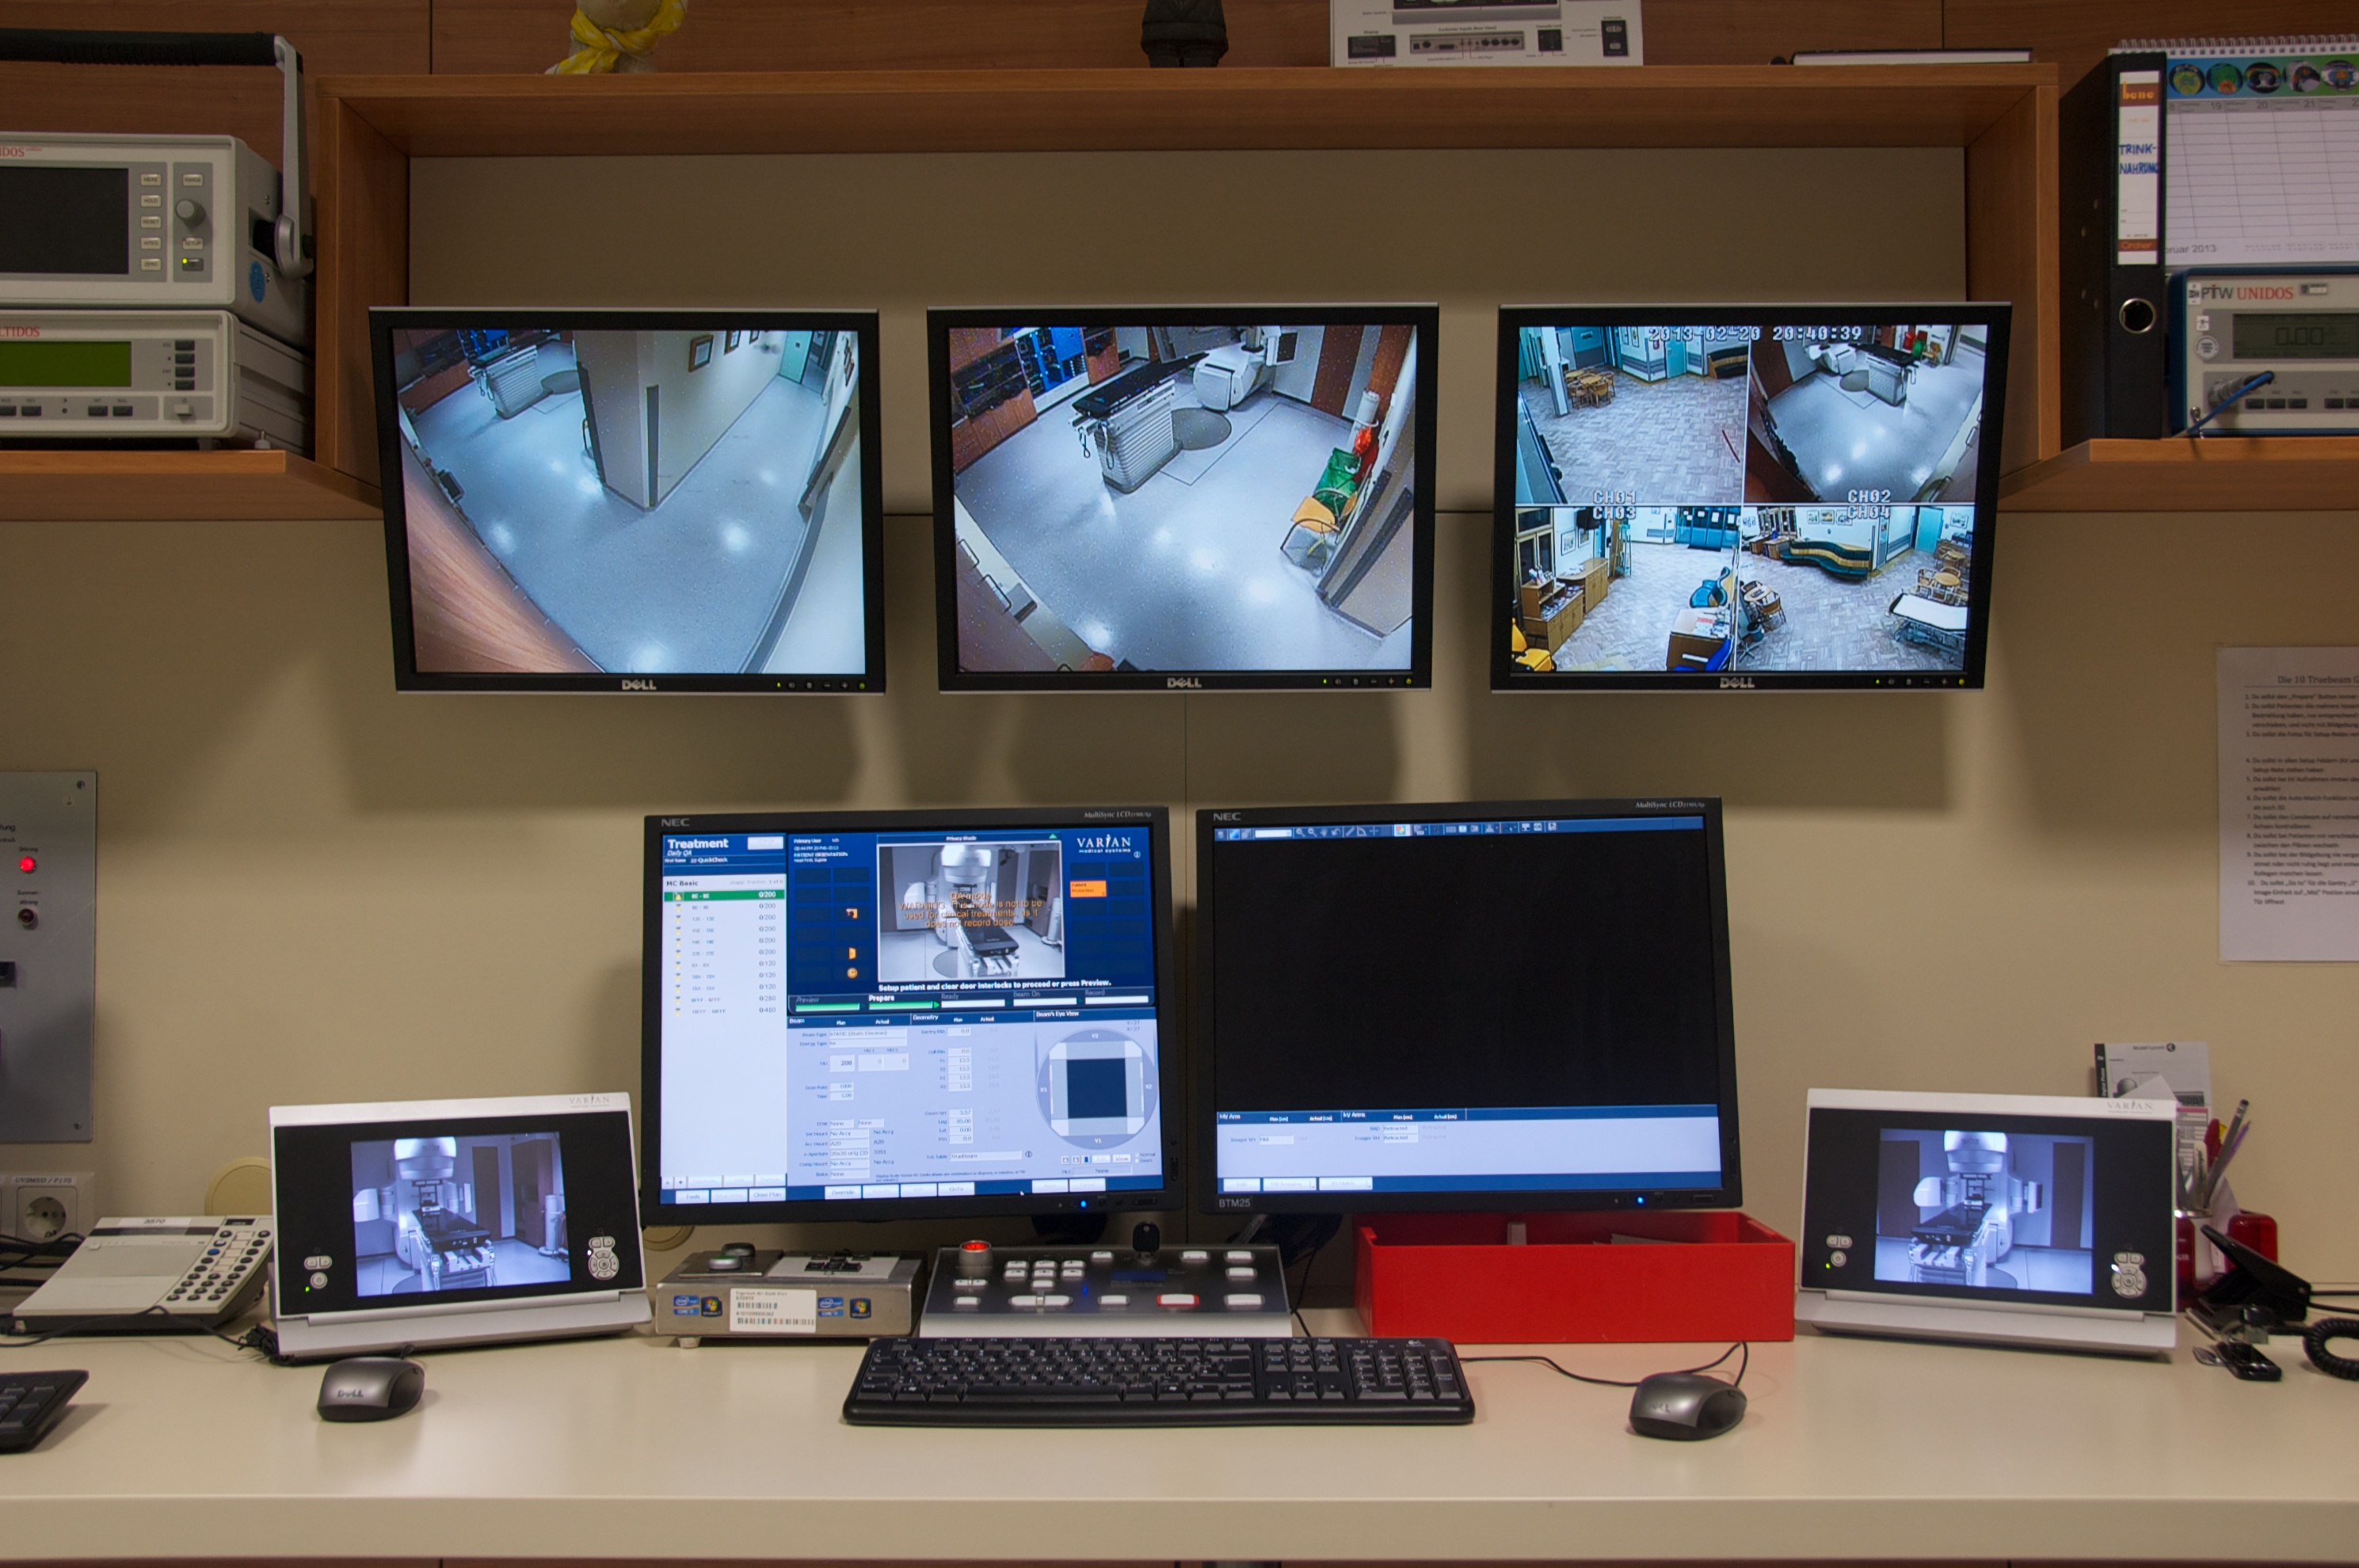
After all beams are delivered, the QCw is removed from the treatment room and attached to the docking station which is situated in the TrueBeam control room. On a PC, the results are downloaded into QUICKCHECK 1.5 software and added to a working file. Finally, the measurements are deleted from the QCw device.
Results for TrueBeam S/N 1275
TrueBeam S/N 1275 Installation Product Acceptance (IPA) was on July 26, 2012. Shortly afterwards, we established the QCw baseline and began to collect data. Between July 31, 2012 and Sep 30, 2013 we saved all records into a single file.
Clinical treatments on TB 1275 started on Jan 2, 2013. The first 5 months of data were acquired during the commissioning and training phase. "Holes" in the timeline indicate that the water phantom was in place over night, and that no morning checkout was performed.
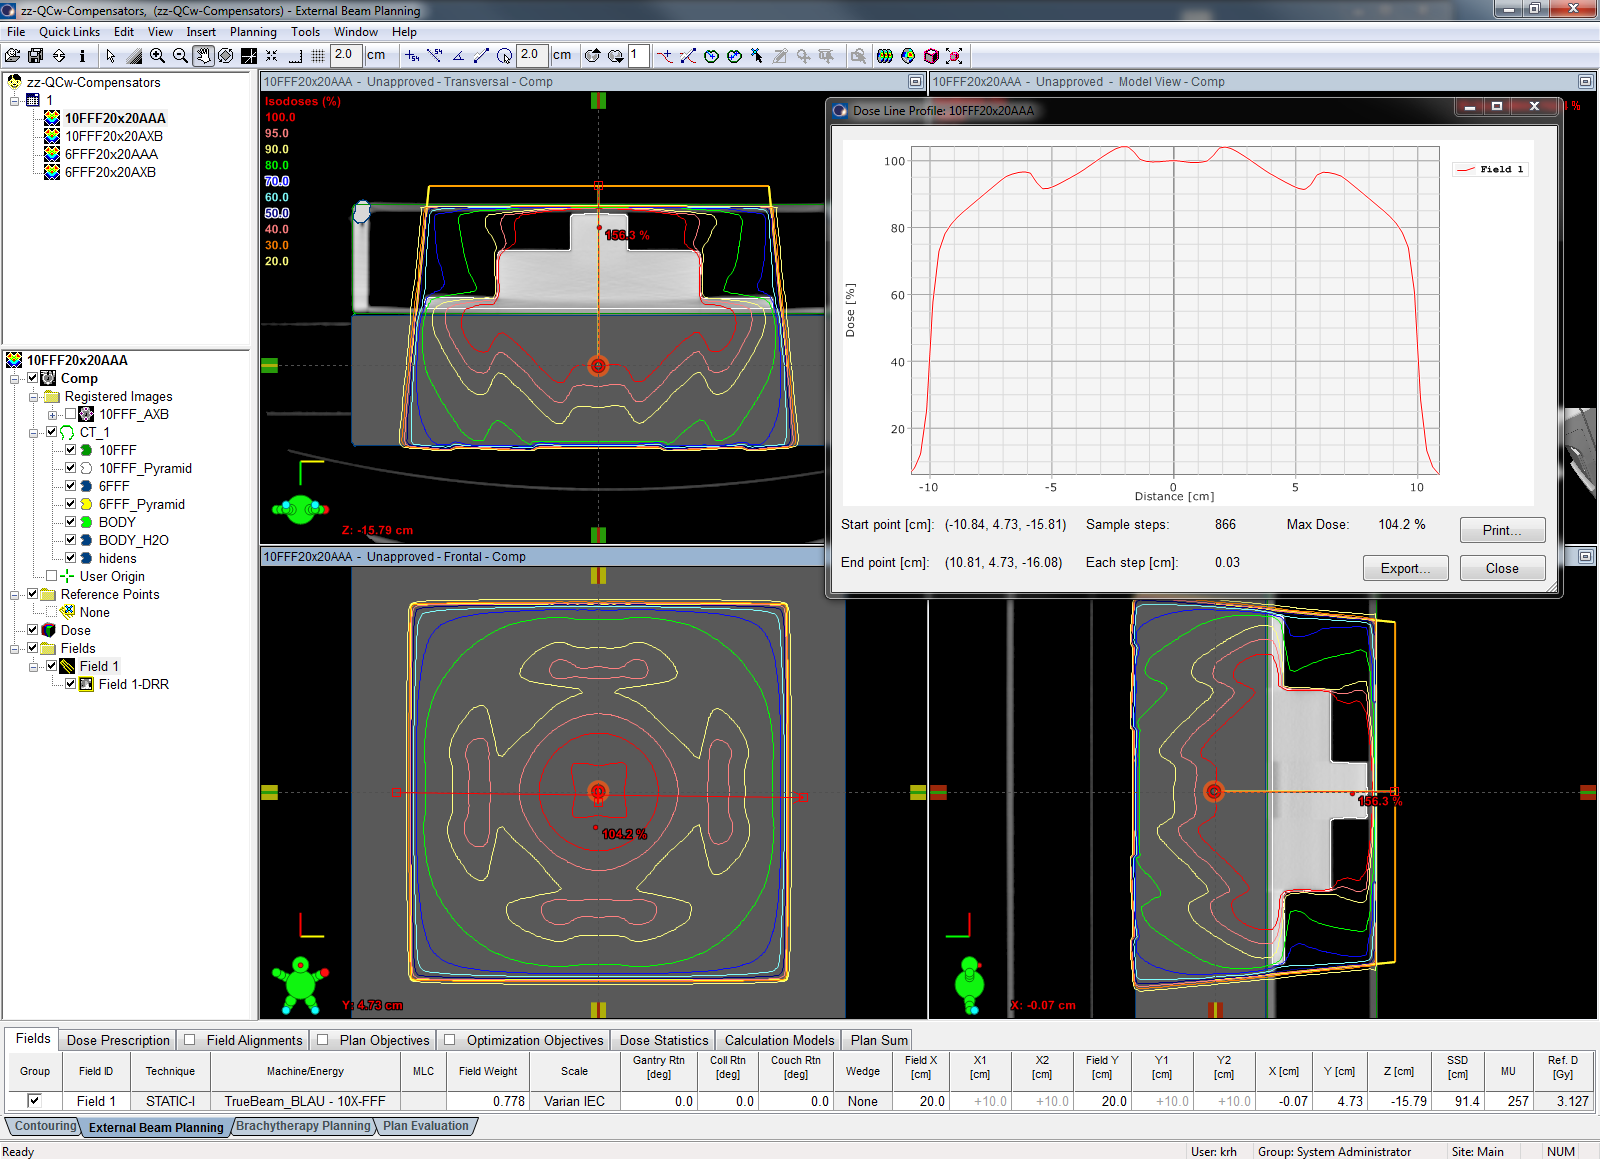
CAX Dose and Initial Output Drift
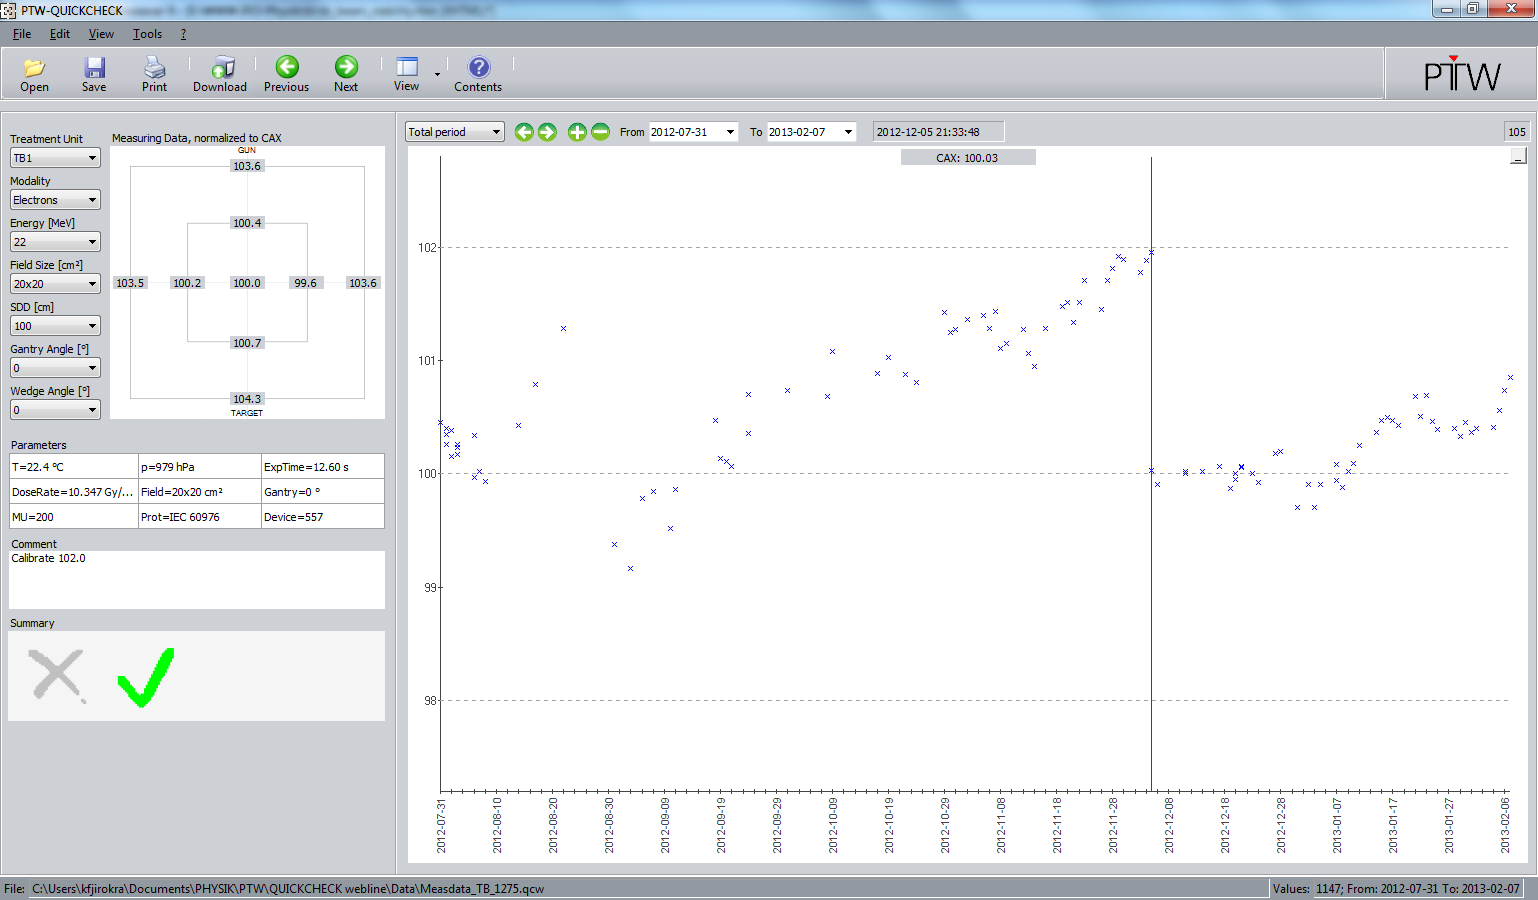
About a month after IPA, the 2% dose limit was exceeded for all energies (photons and electrons), requiring an output calibration1. The screenshot shows the drift of the 10FFF energy. At the vertical cursor line, TrueBeam output was reduced in two steps: first by 2%, then once again by 1.5%:

The reason for the drift was probably a gradual loss of chamber sensitivity of TrueBeam 1275. Beam-hours counter at this point showed 106 h after IPA (after which QCw baseline had been established). If one assumes an average dose rate of 800 MU/min over the months, 106 beam hours correspond to a CAX dose of about 50 kGy.
A second output recalibration, which mainly affected electrons, was performed on Dec 5: after CAX dose limit was exceeded for some electron energies, we reduced TrueBeam output once again by 2% for all electron beams. Here the drift can be seen for E22 as a slow increase in dose output, to the left of the cursor line:
Taking the opportunity, we also recalibrated all photon beams by reducing TrueBeam output by 0.5% on Dec 5.
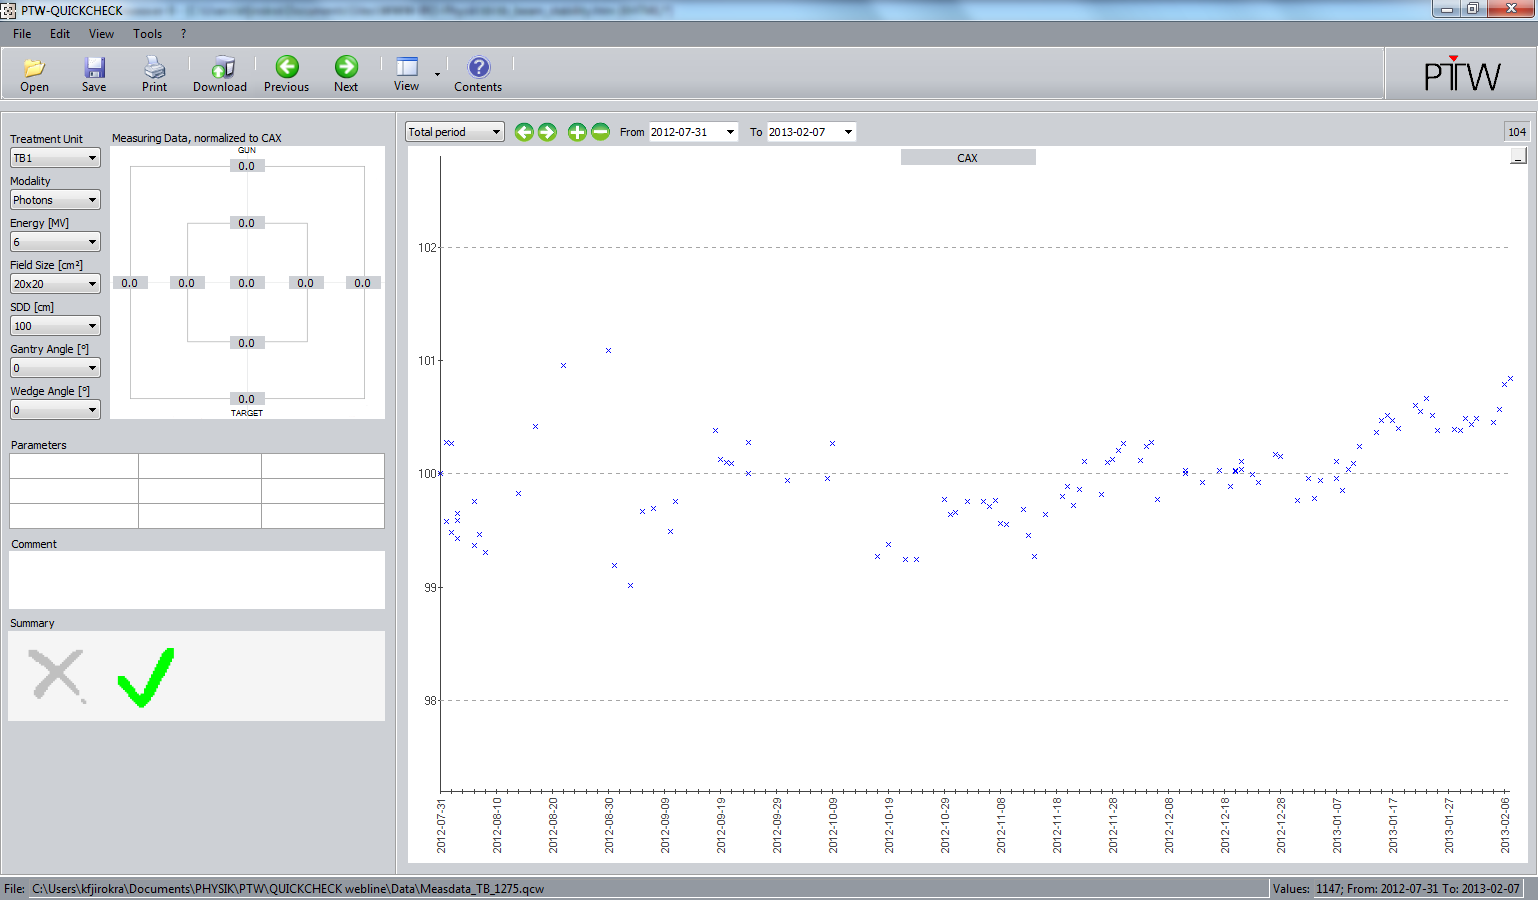
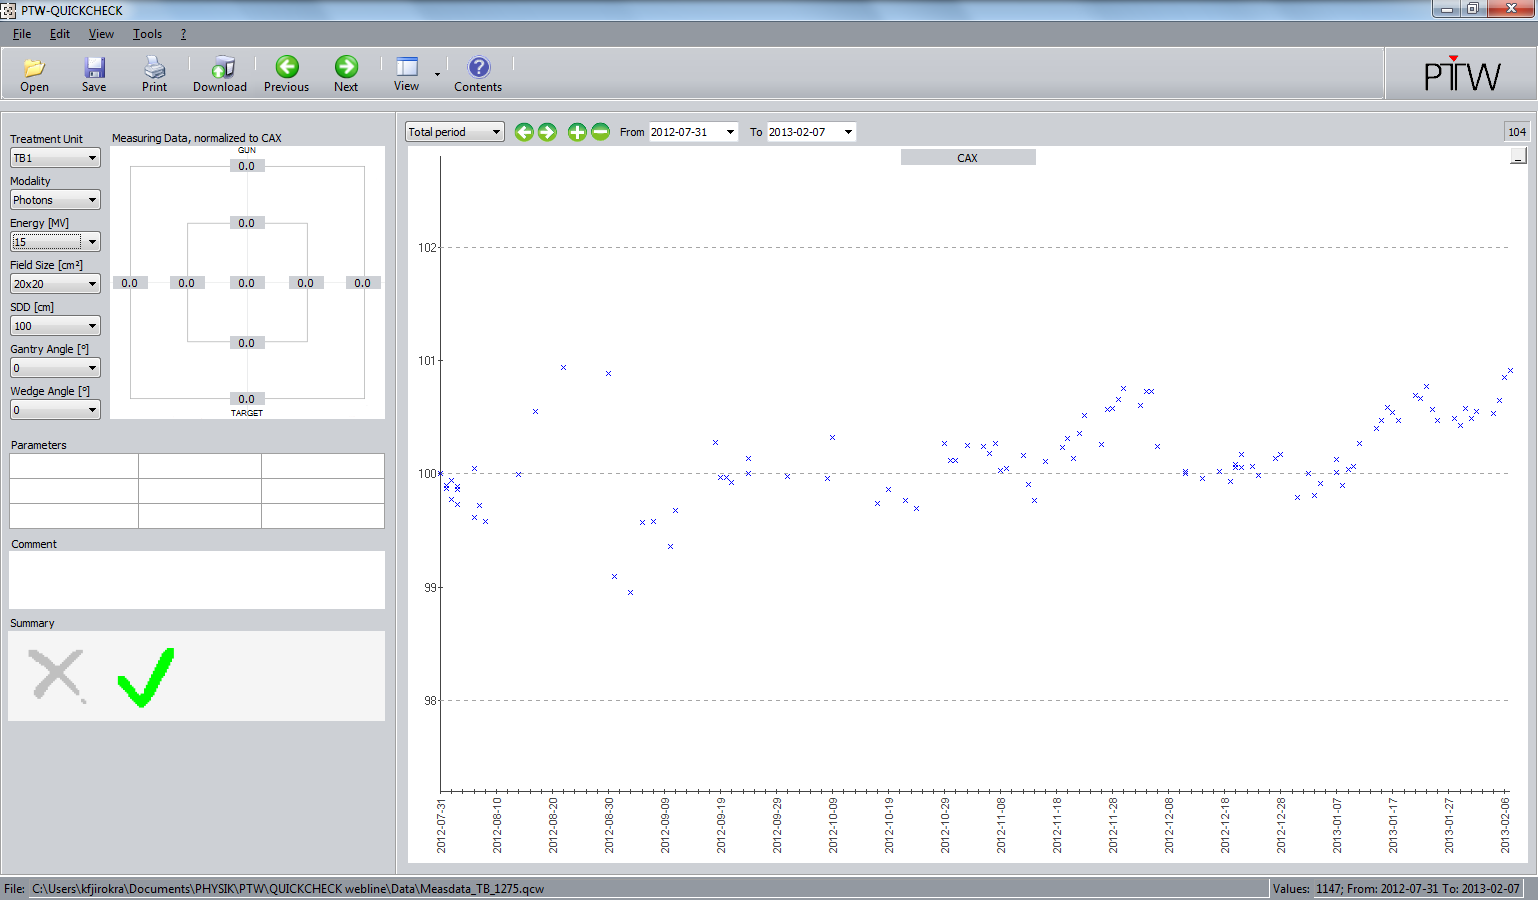
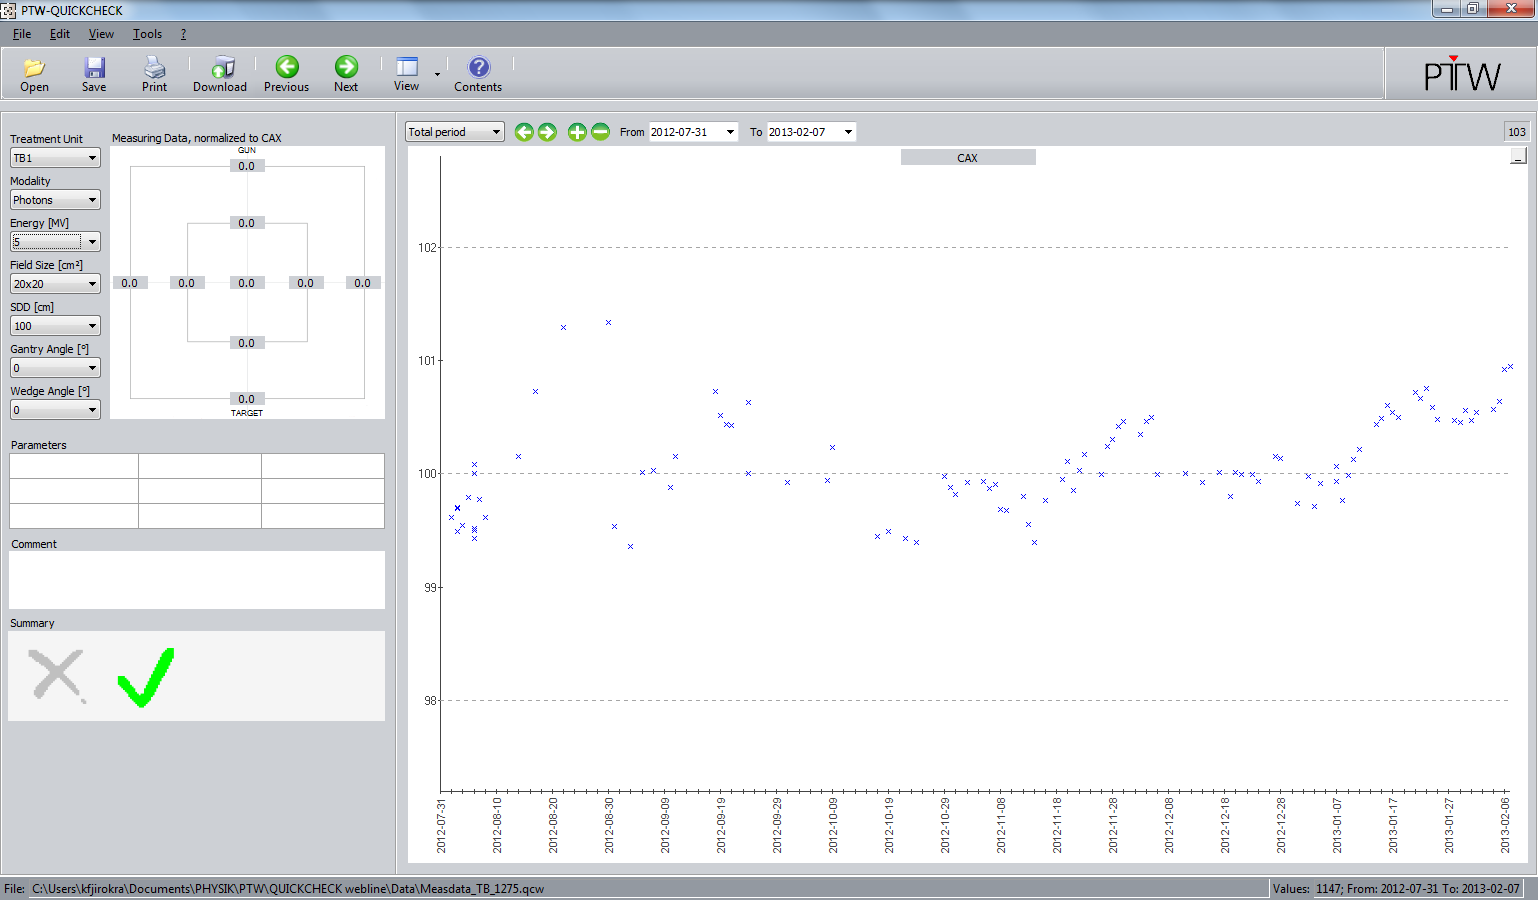
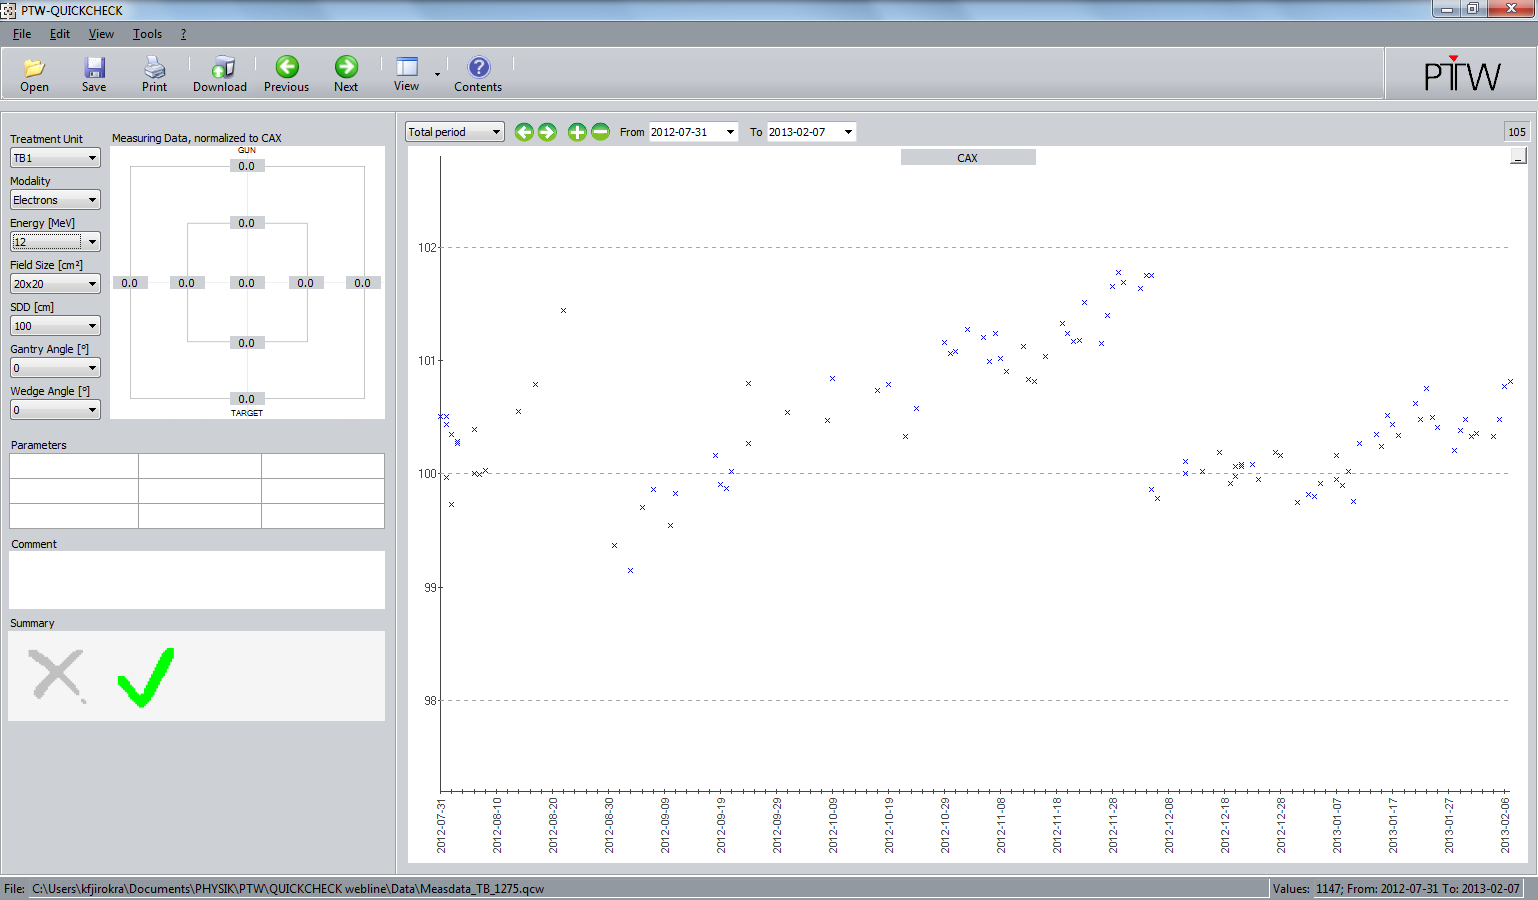
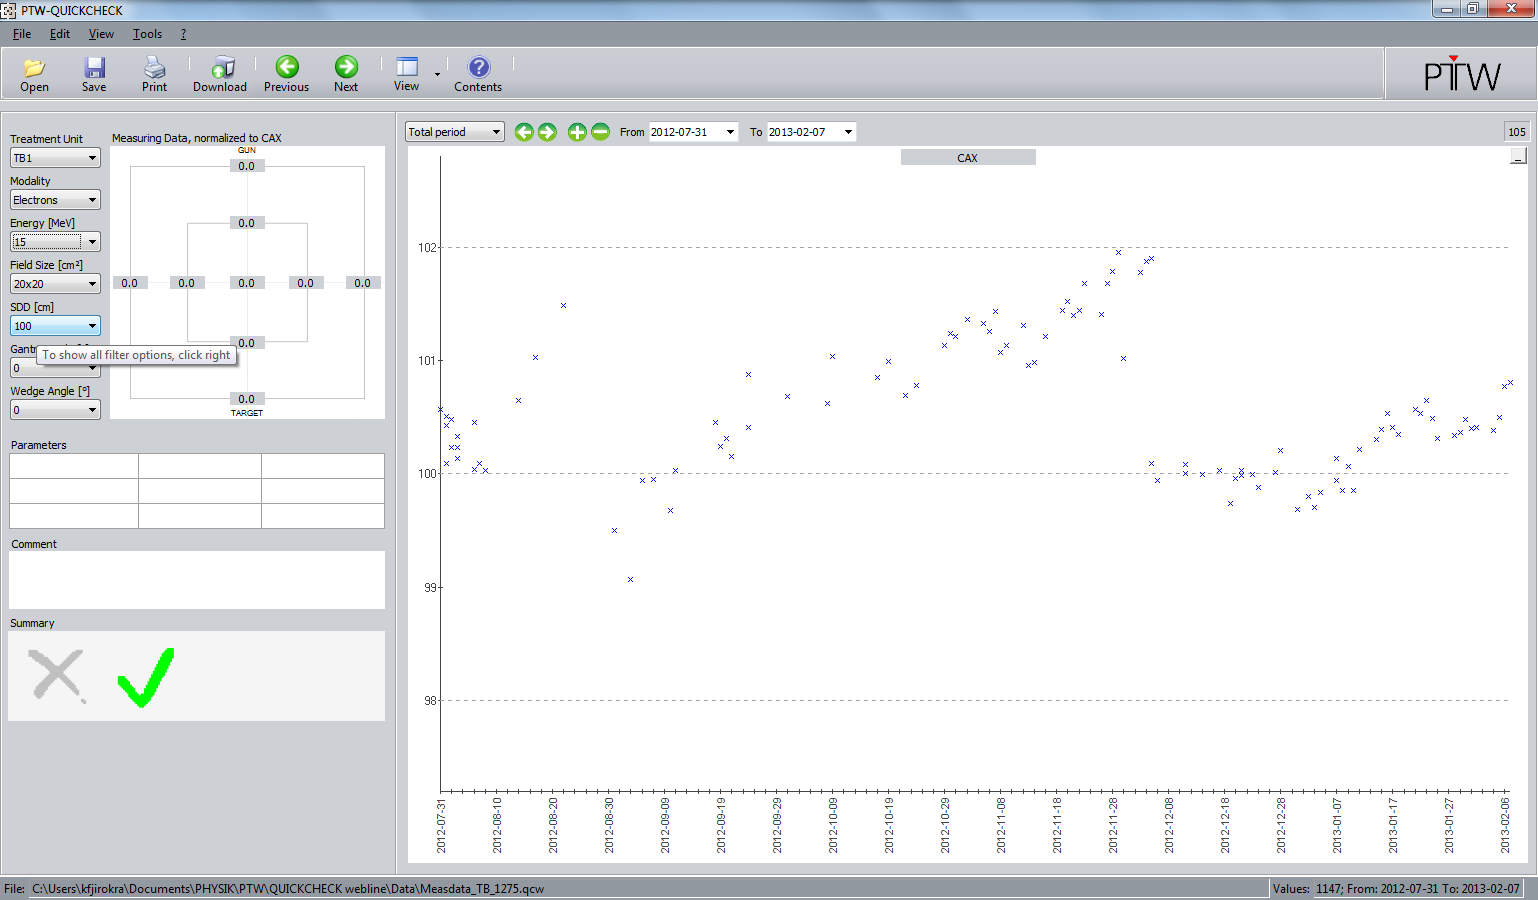
Here are the long-term trends for the photon energies X6, X10, X15, 6FFF, 10FFF and the electron energies E6, E9, E12, E15, E18, E22.
Symmetry
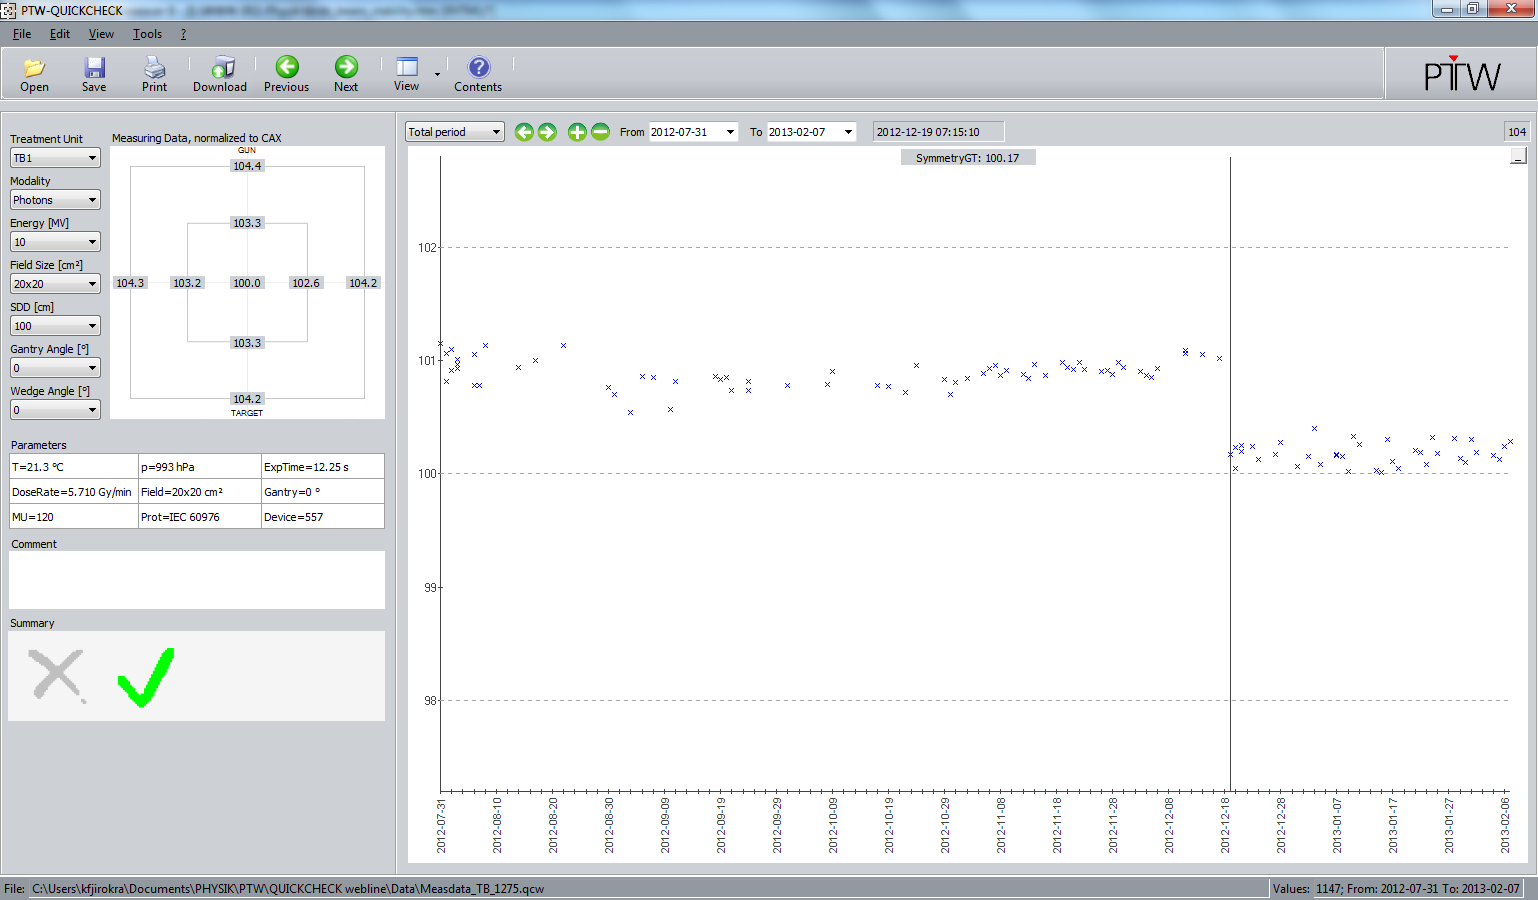
The protocol we use for calculating symmetry is IEC 60976, which is our standard protocol. Only one minor adjustment was done within the 6 months: on Dec 18, the radial beam angle servo were zeroed (not calibrated). This levelled the beam inplane to near-perfect symmetry. The zeroing was done for all flattened photon beams.
Here the effect on radial symmetry can be seen for X10:
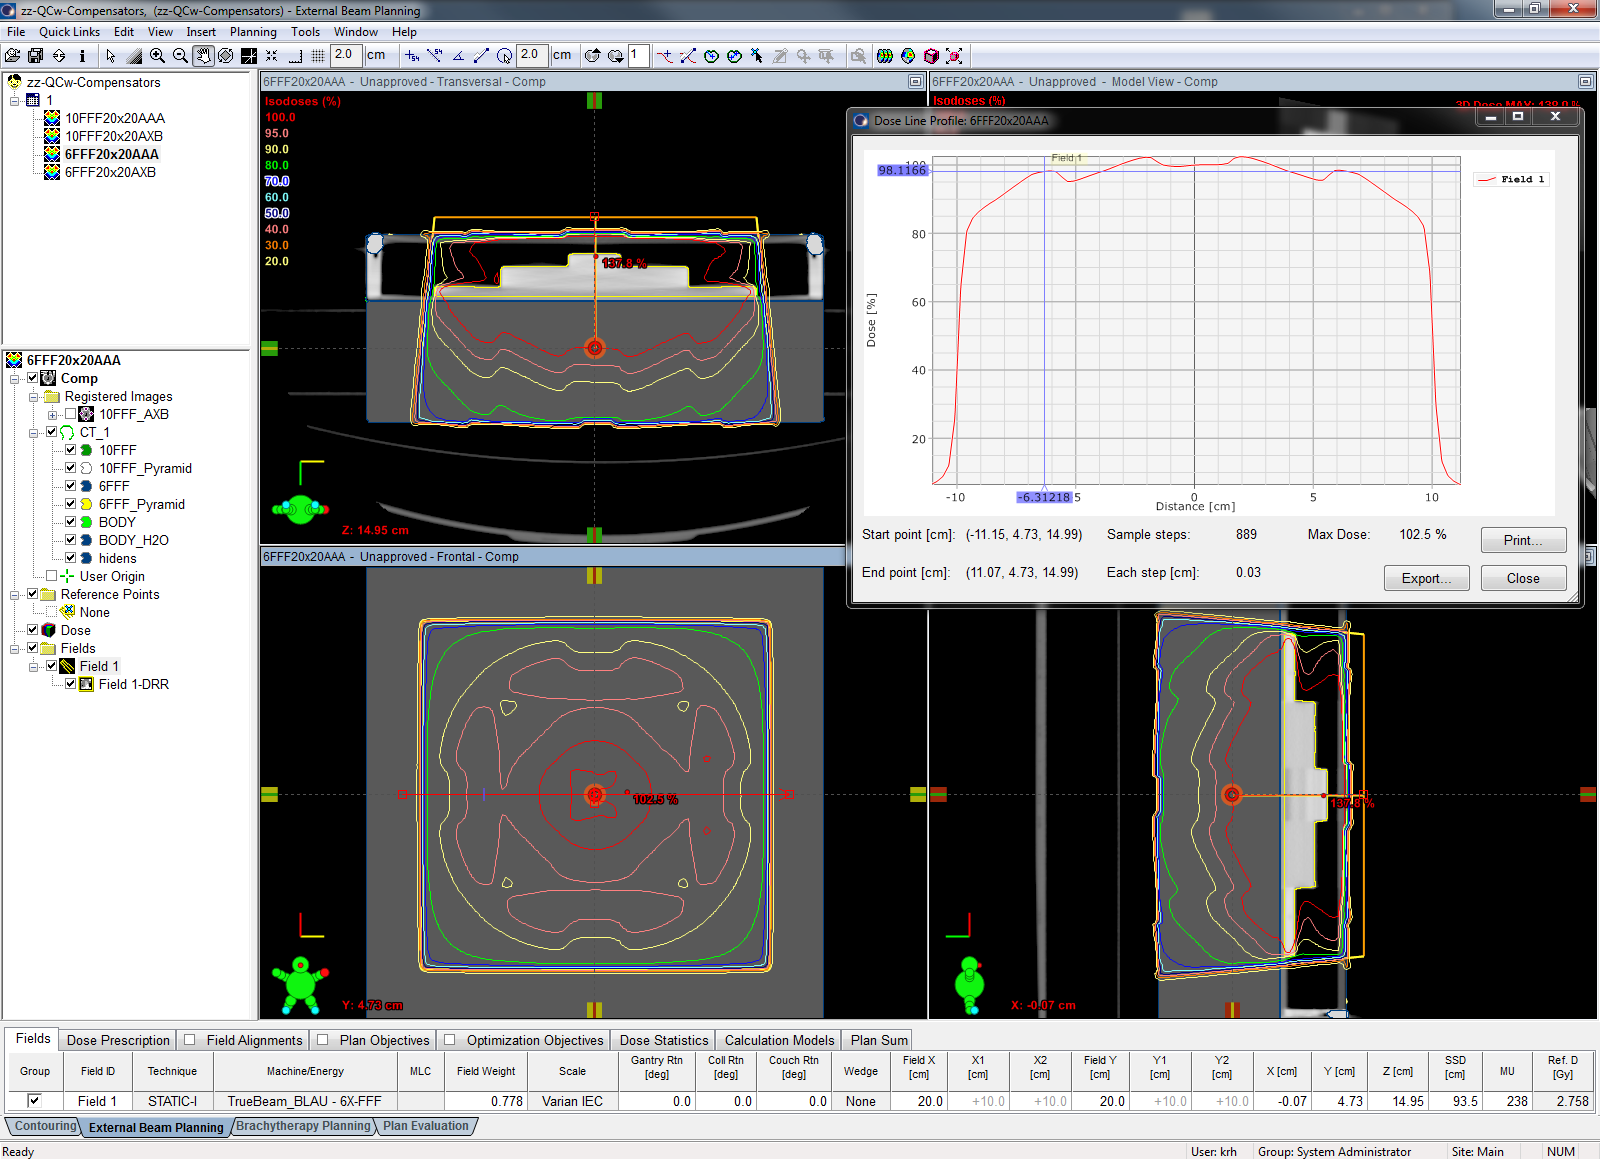
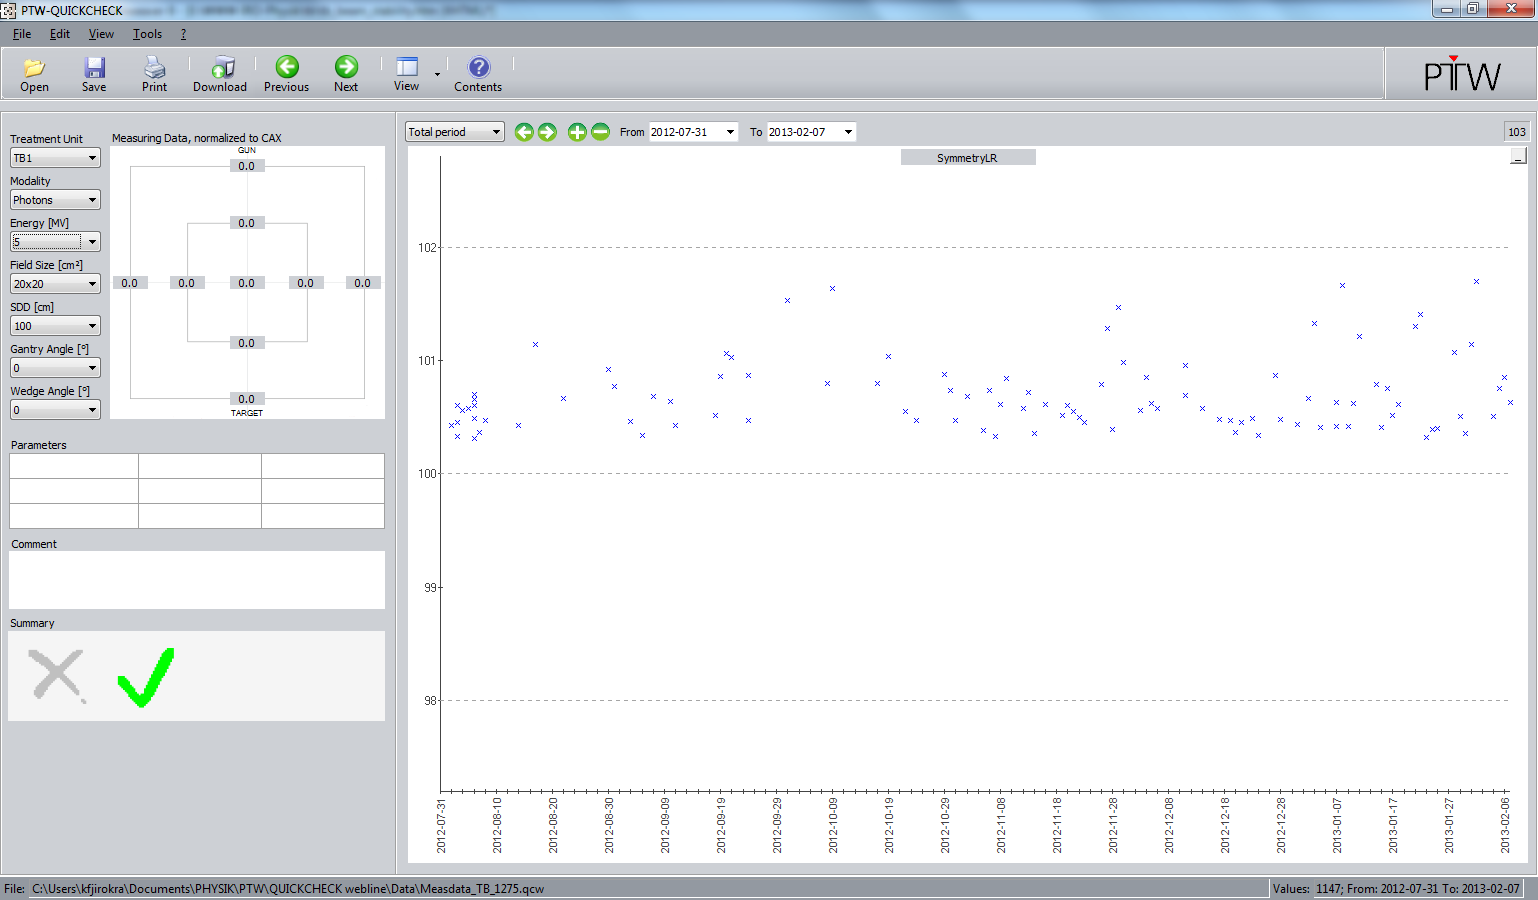
We saw no reason to touch the FFF symmetry settings. However, compared to flattened beams, the daily variation of FFF symmetry is generally somewhat larger. Here is the inplane symmetry for 6FFF:

See also 10FFF inplane, 6FFF crossplane and 10FFF crossplane, which look similar.
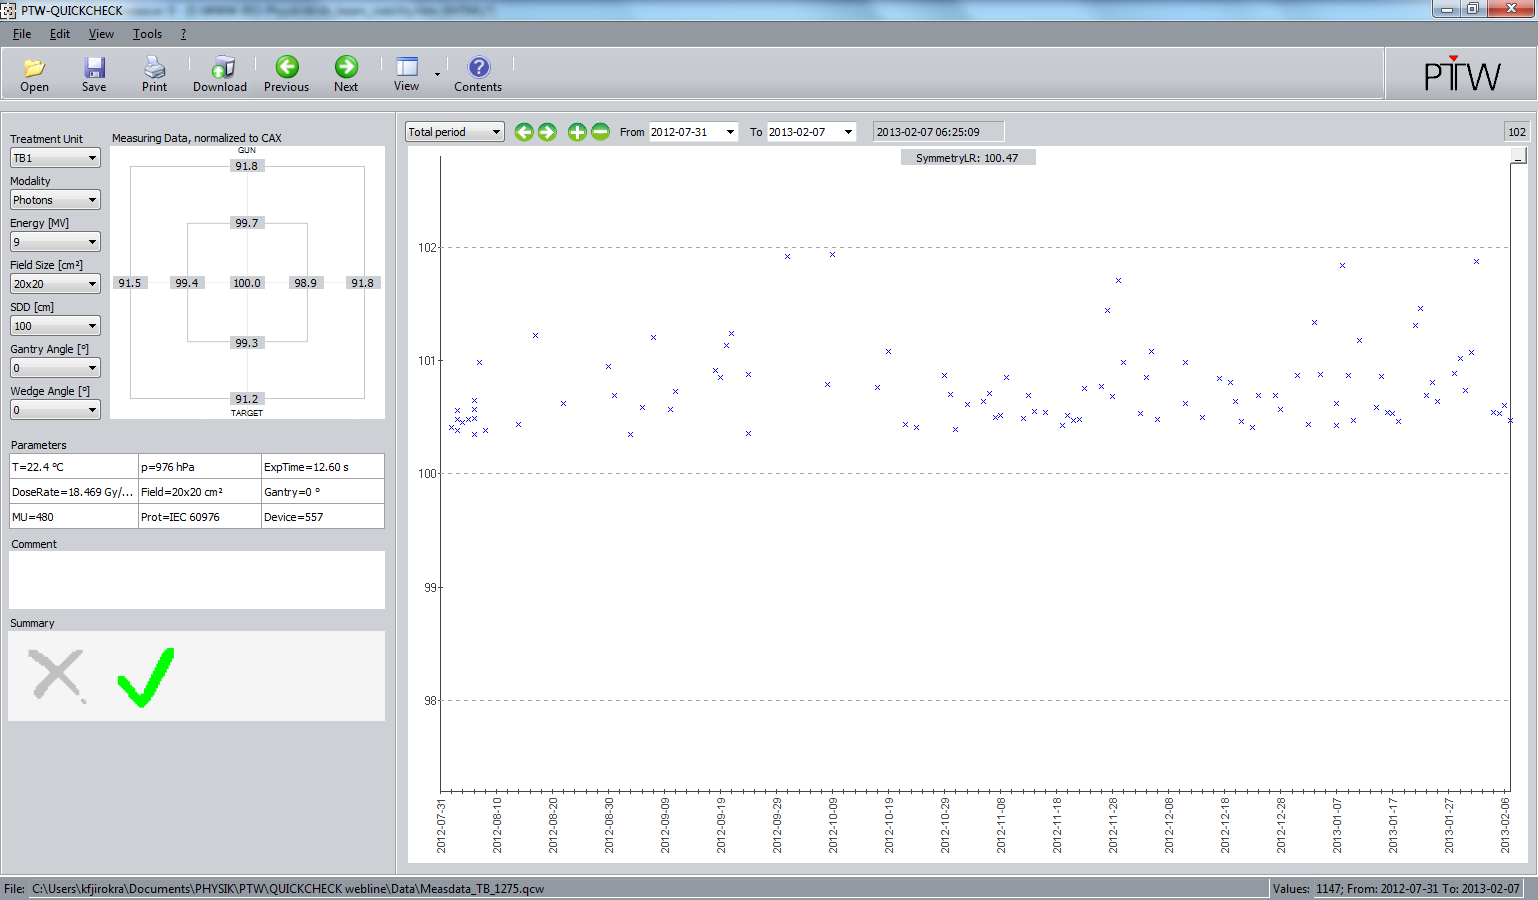
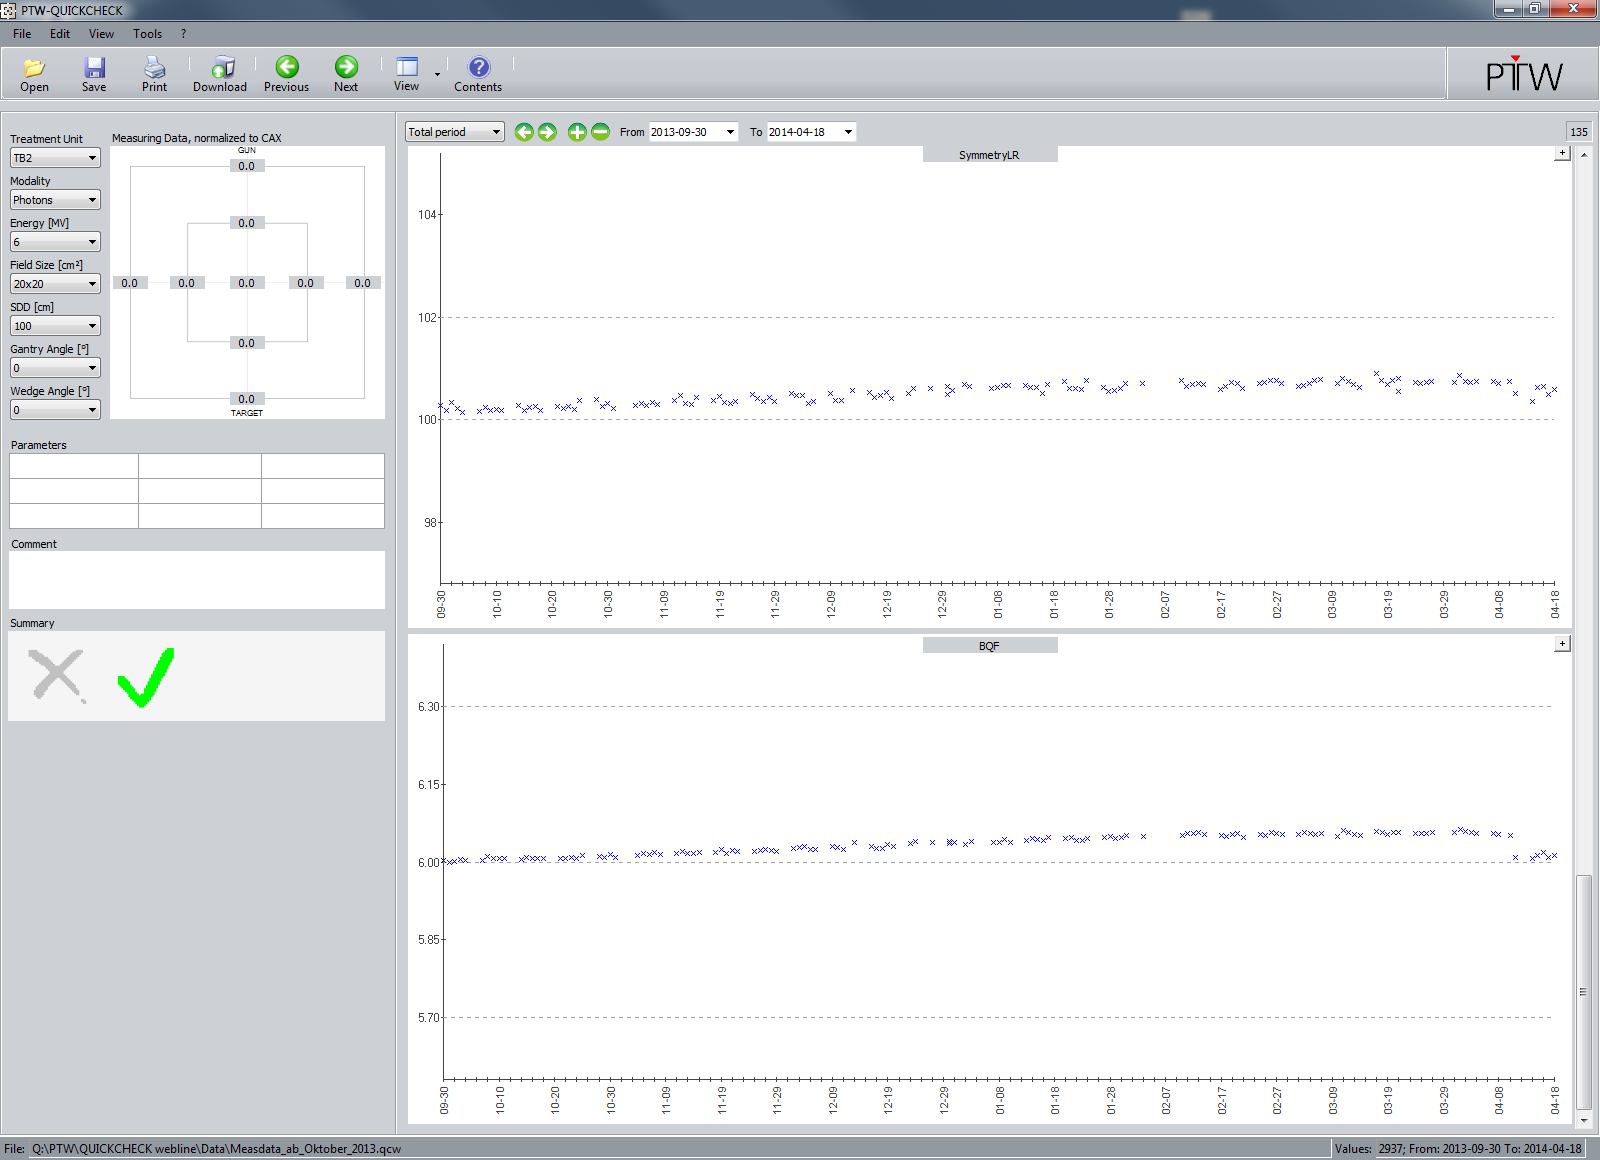
The following graph shows the crossplane symmetry for all five photon energies. The flattened beam data points are connected with a line, the FFF data points are not:
Statistically, the standard deviation of the crossplane symmetry values for the energies X6, X10, X15, 6FFF, 10FFF in the full 6 month period is 0.104, 0.132, 0.166, 0.323, 0.360, respectively. This confirms the visual impression that the QCw-measured daily symmetry variation is higher for FFF beams than for flattened beams, by a factor two to three.
Flatness
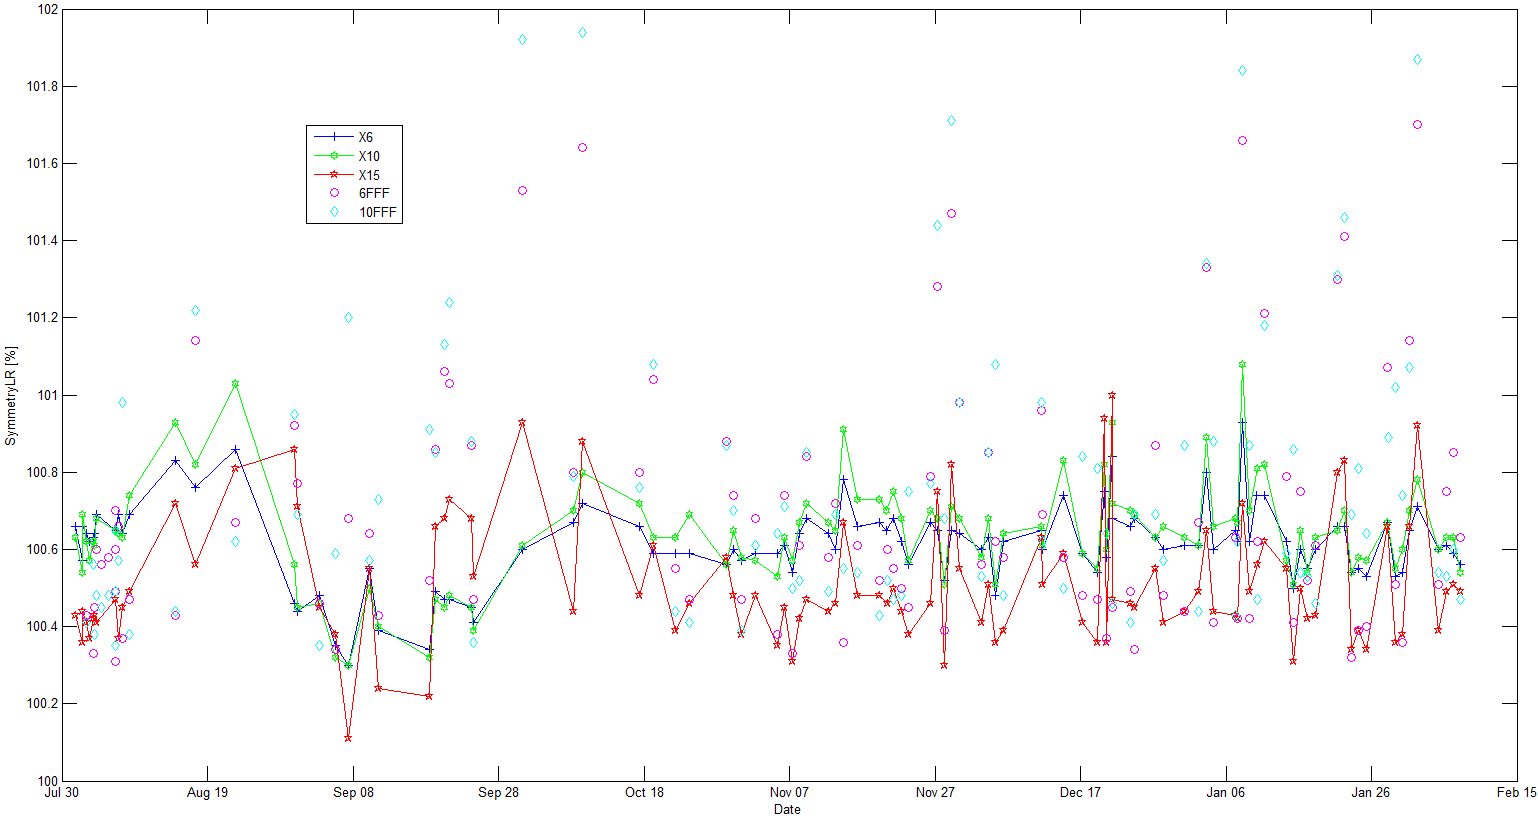
It is not possible to influence the flatness of a beam via beam steering. In particular, there is no such thing as "flatness calibration" on the linac. But it can be influenced by symmetry adjustments. After the Dec 18 symmetry intervention, flatness changed a little for the flattened beams (taking a new baseline at this point would probably have been a good idea):

In the 6 month period, flatness was always within the allowed tolerance (±0.5% for flattened and ±1% for unflattened beams). Here are the flatness plots for 6FFF and 10FFF.
According to the IEC 60976 protocol, flatness is determined only for photons, not for electrons.
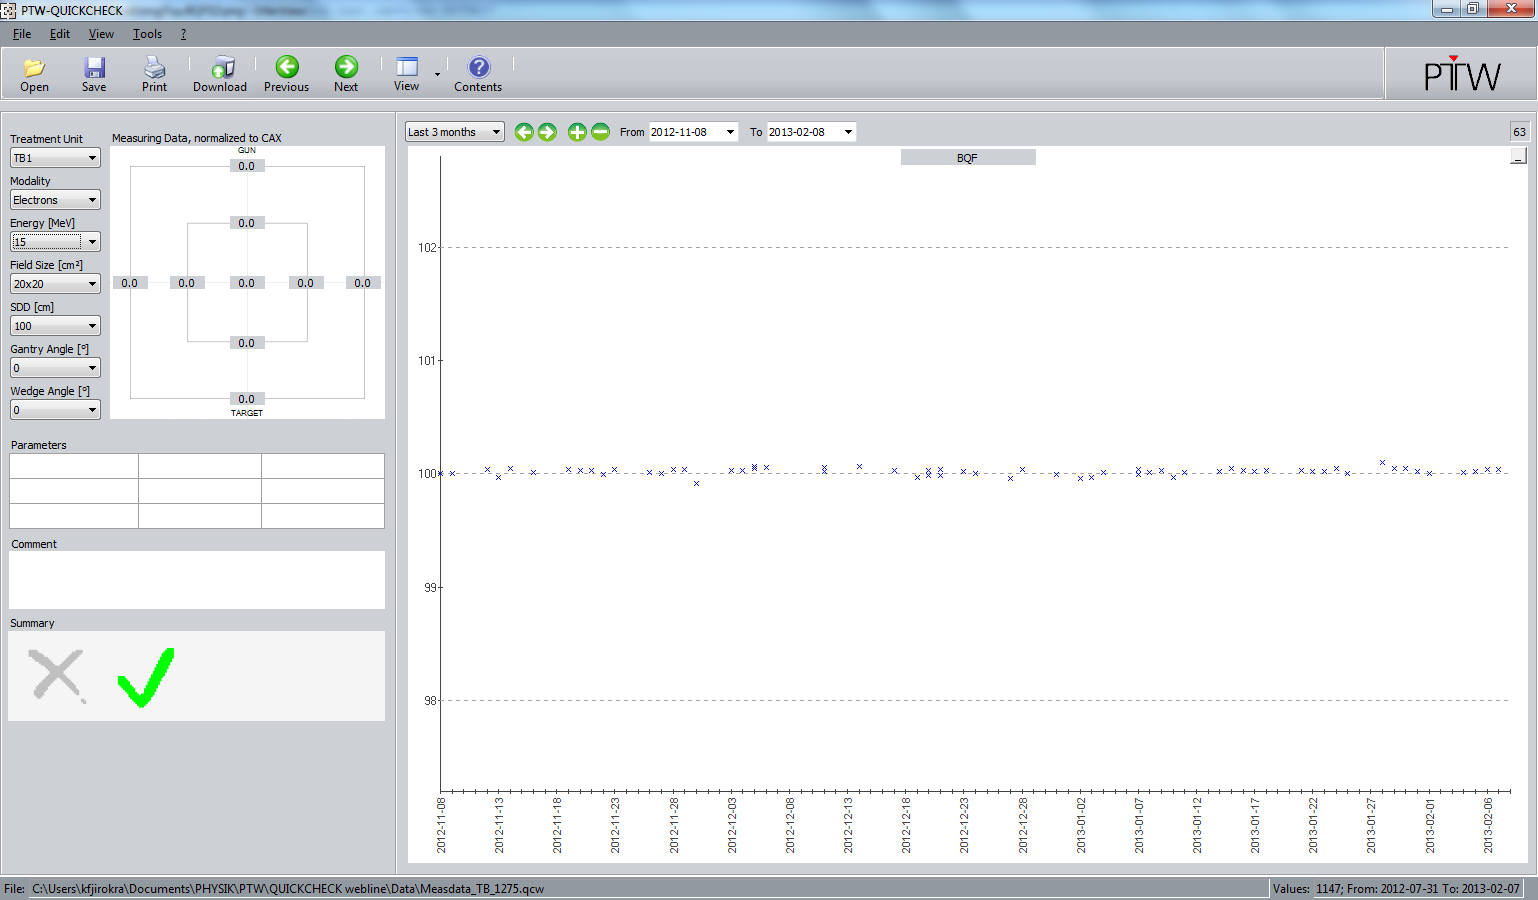
Beam Quality Factor
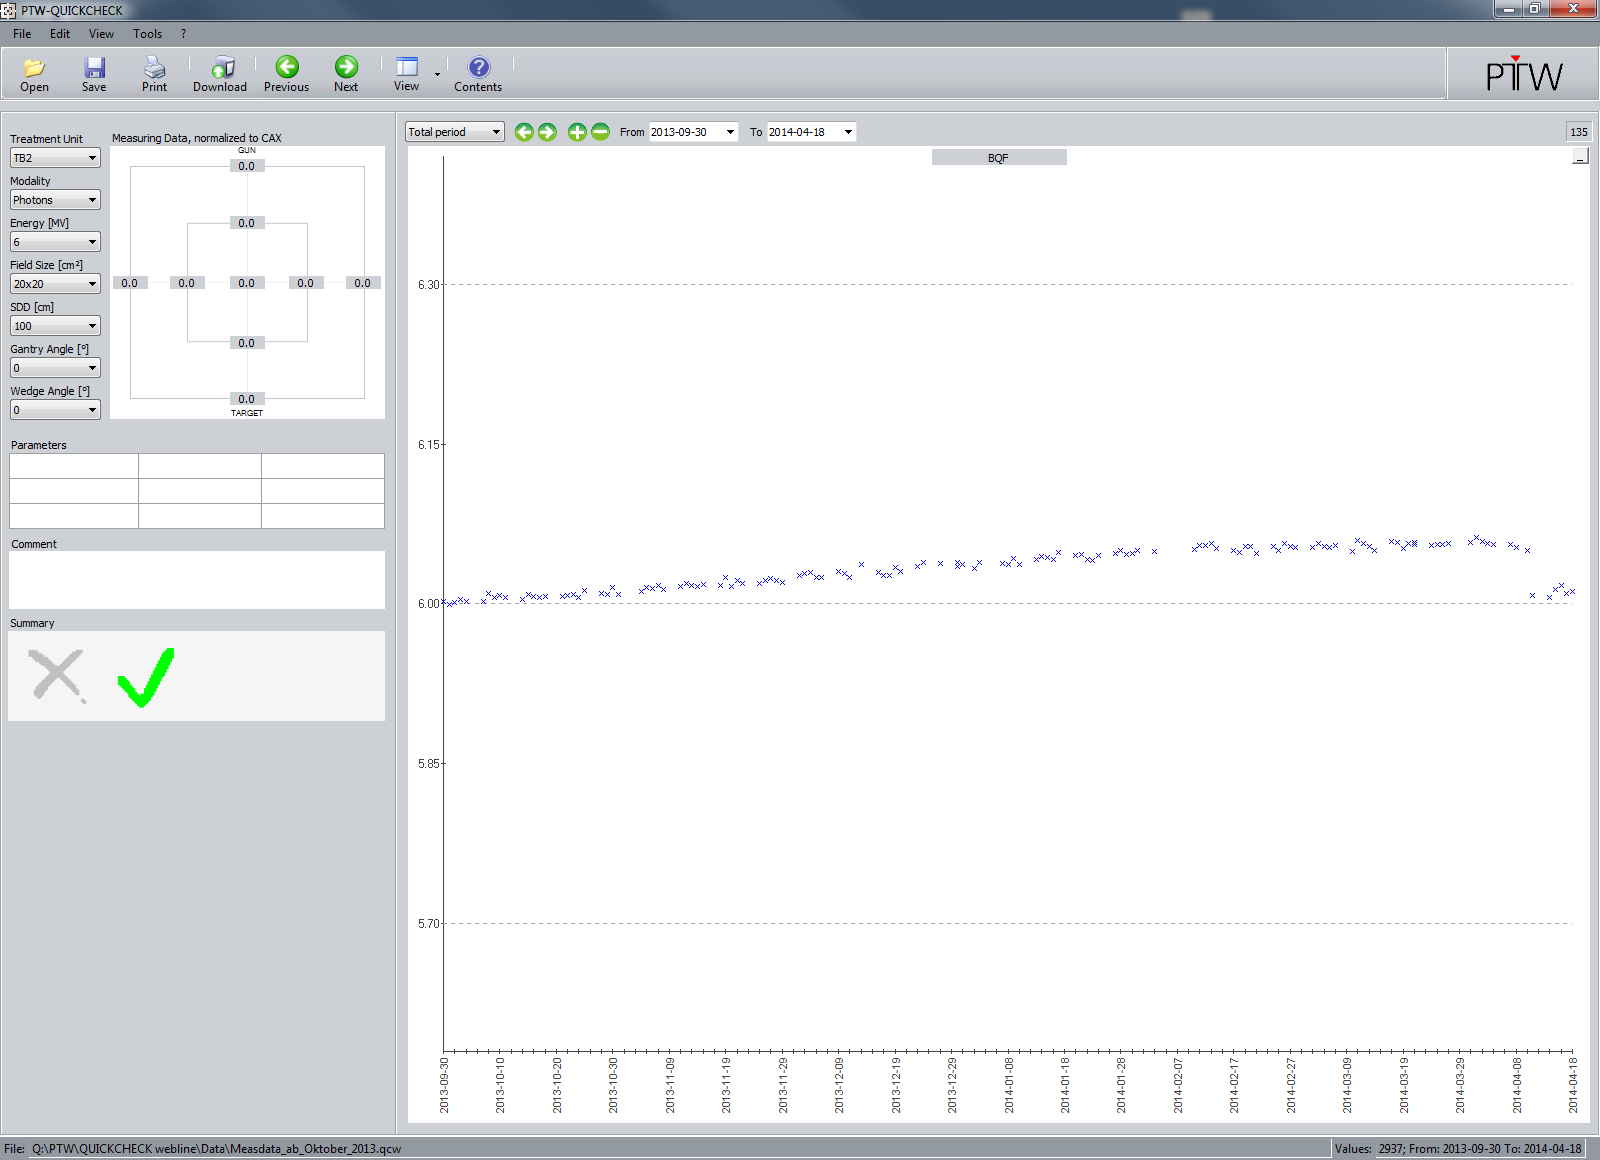
On Nov 8, 2013, we started to analyze the BQF, allowing 2% maximum deviation.
However, our BQF results are to be taken with caution. According to PTW the field size for BQF analysis should have been 10x10 cm, a rule which we violate by using 20x20 cm.
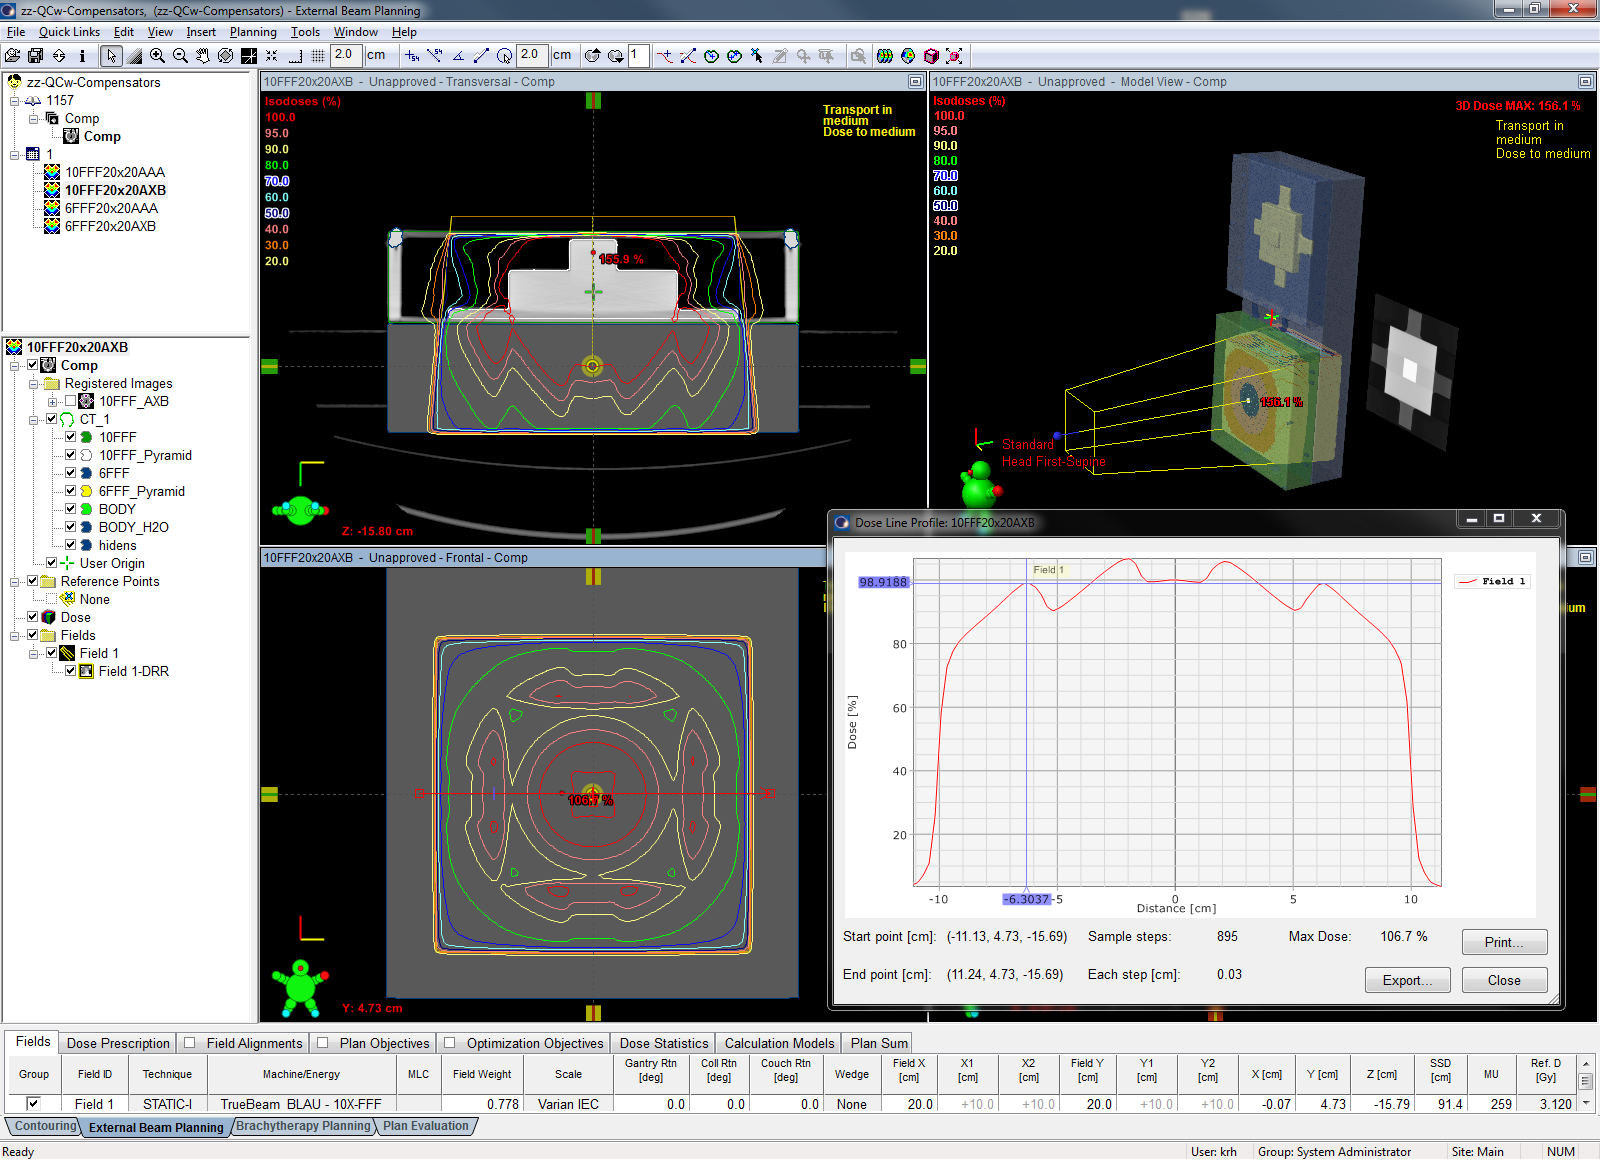
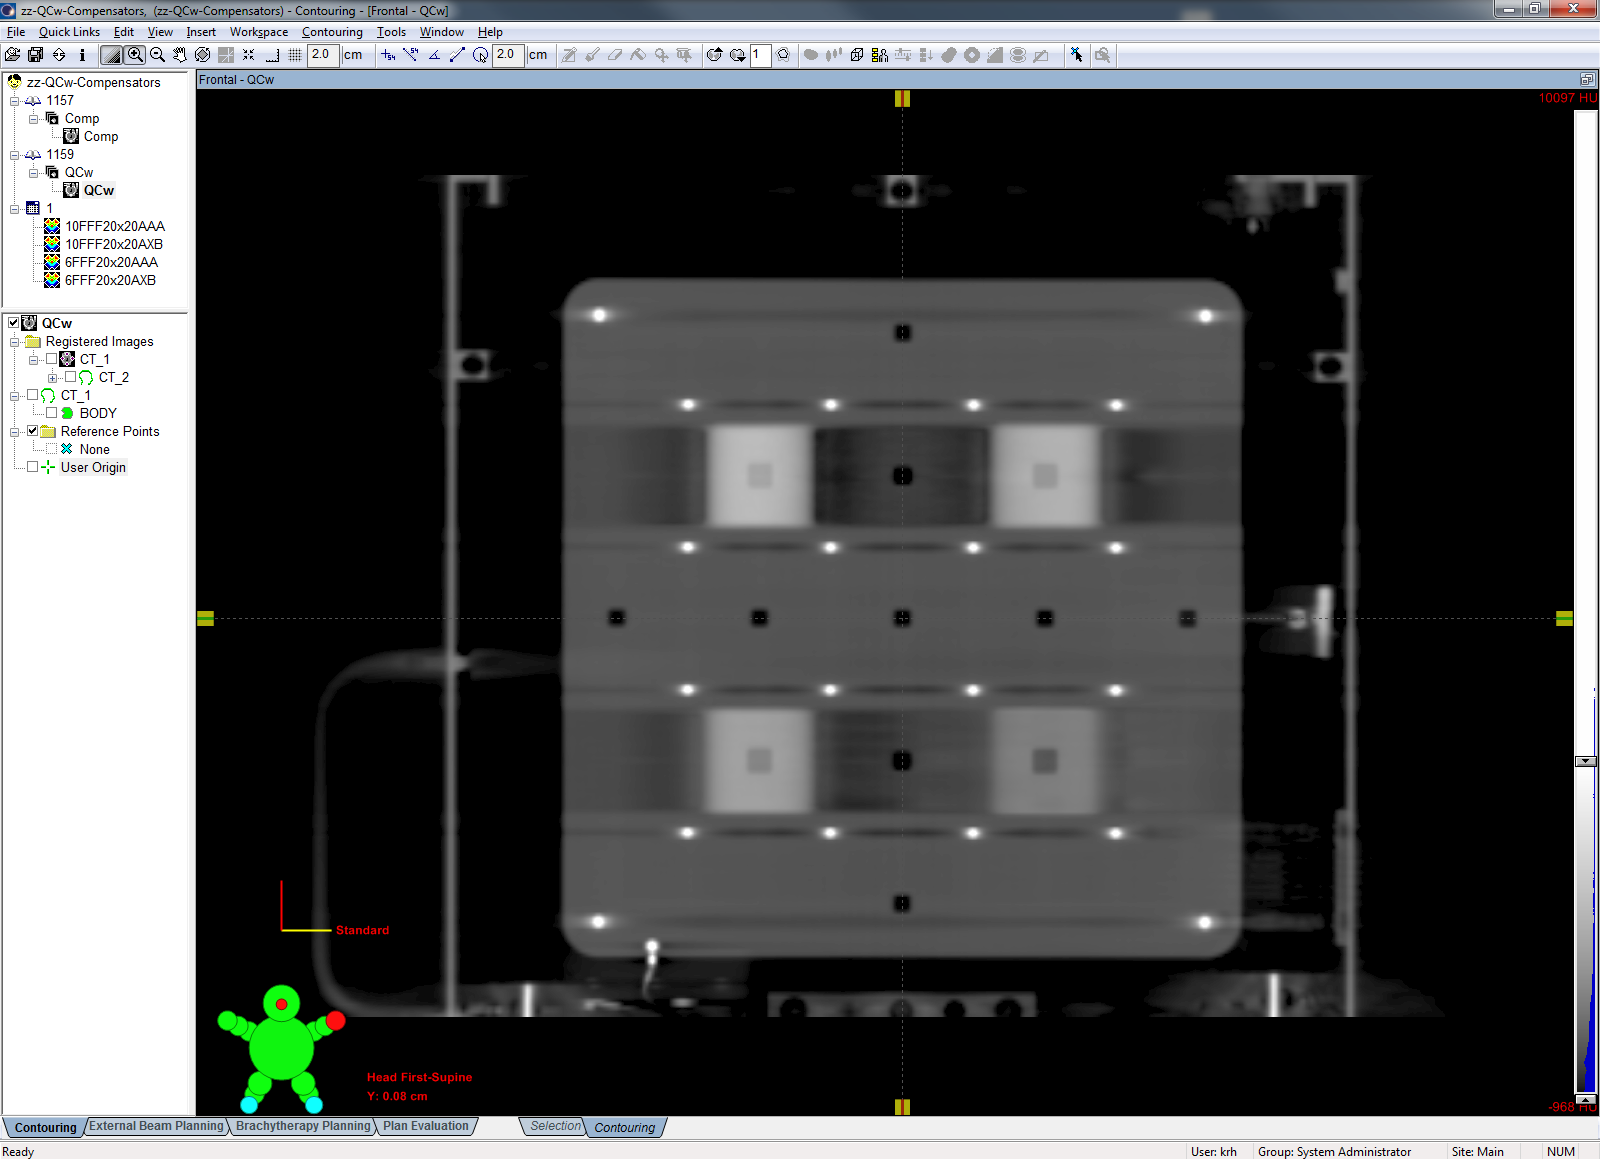
For photons, the QUICKCHECK software manual says that the index for radiation quality BQF can only be determined for a 10x10 field, and that the central chamber and one of the four ionization chambers for radiation quality are used for calculation of the index. These chambers are inside QCw, at the corners of a 10x10 field (see sidebar). To get numerical values for BQF, PTW then uses a polynomal which is not documented in detail. For a 10x10 field, 1% change in energy should give a 1% change in BQF.
However, our morning check fields are all 20x20 cm and BQF results are still calculated by the software. We normalized them to a target value of 100 at the baseline date.
Since the drop in measured BQF on Dec 19 coincides with inplane beam angle zeroing on Dec 18, and since the chambers for BQF measurement are not on top of each other, we assume that the Dec 18 intervention is responsible for the apparent change of the index by -0.65%. And the drop is not visible for FFF beams (where beam steering had not been touched). Again, a new BQF baseline should have been established after Dec 18.
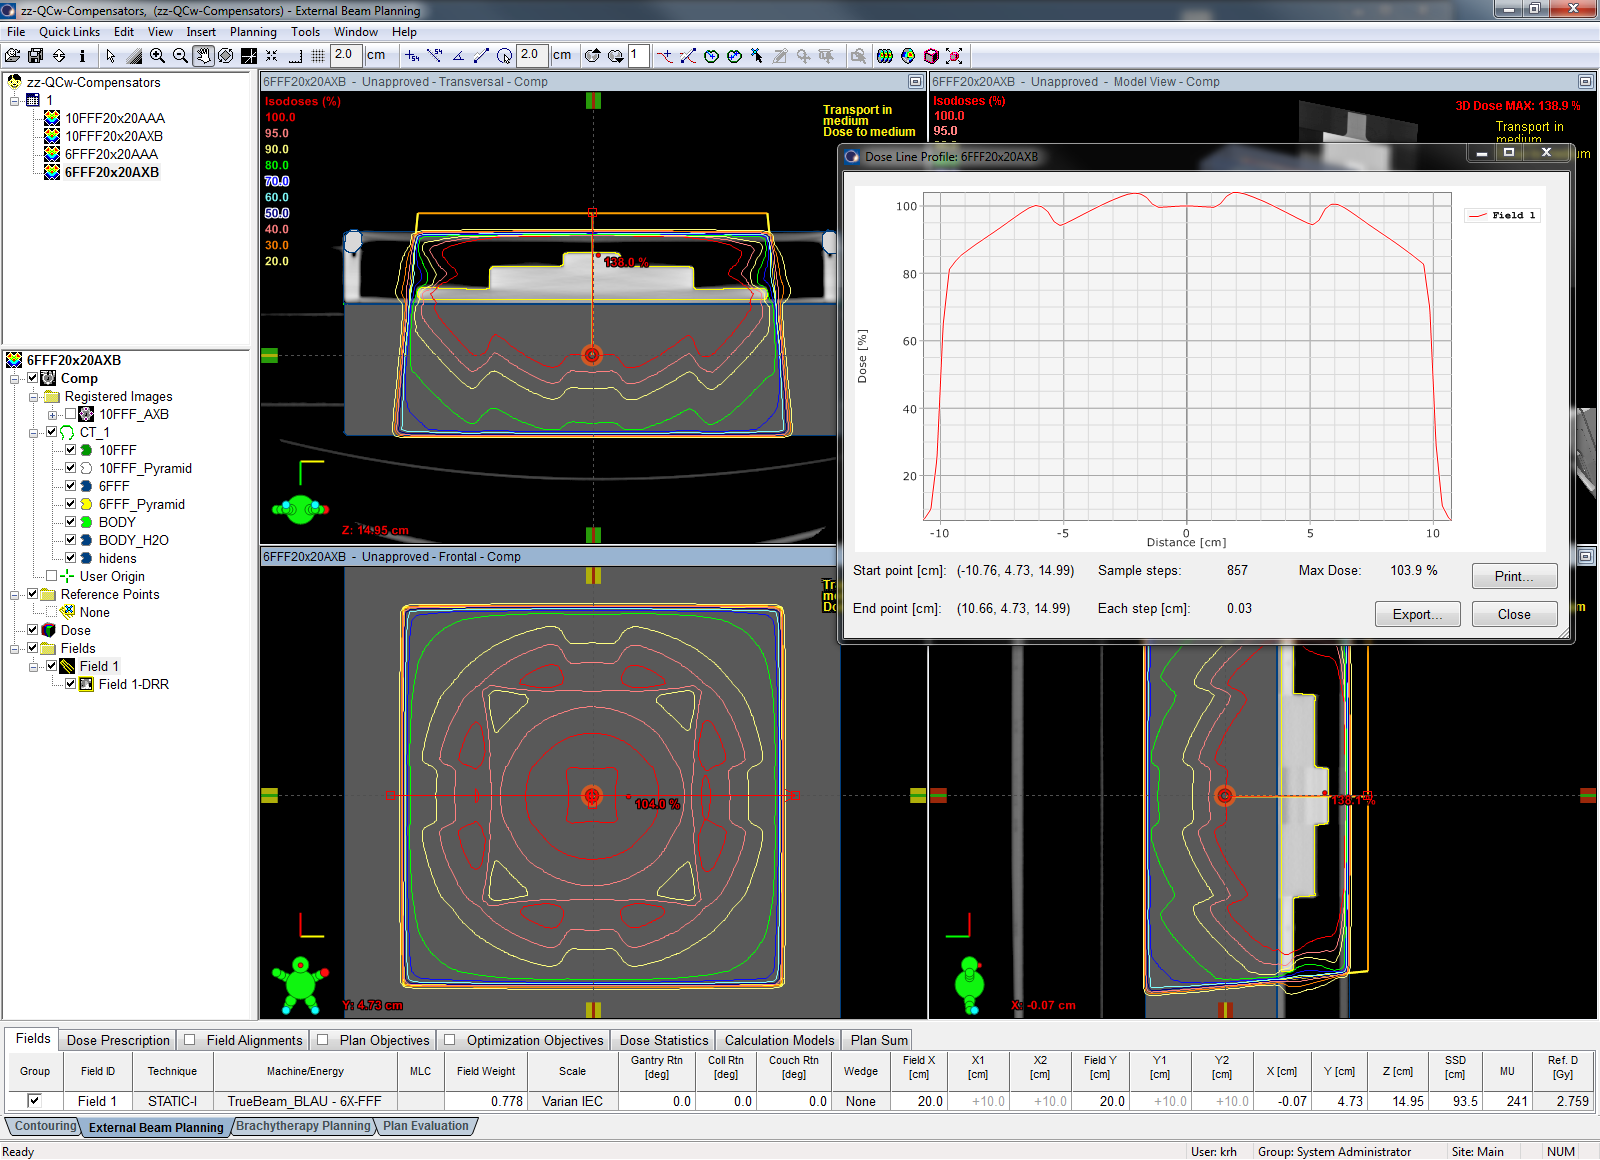
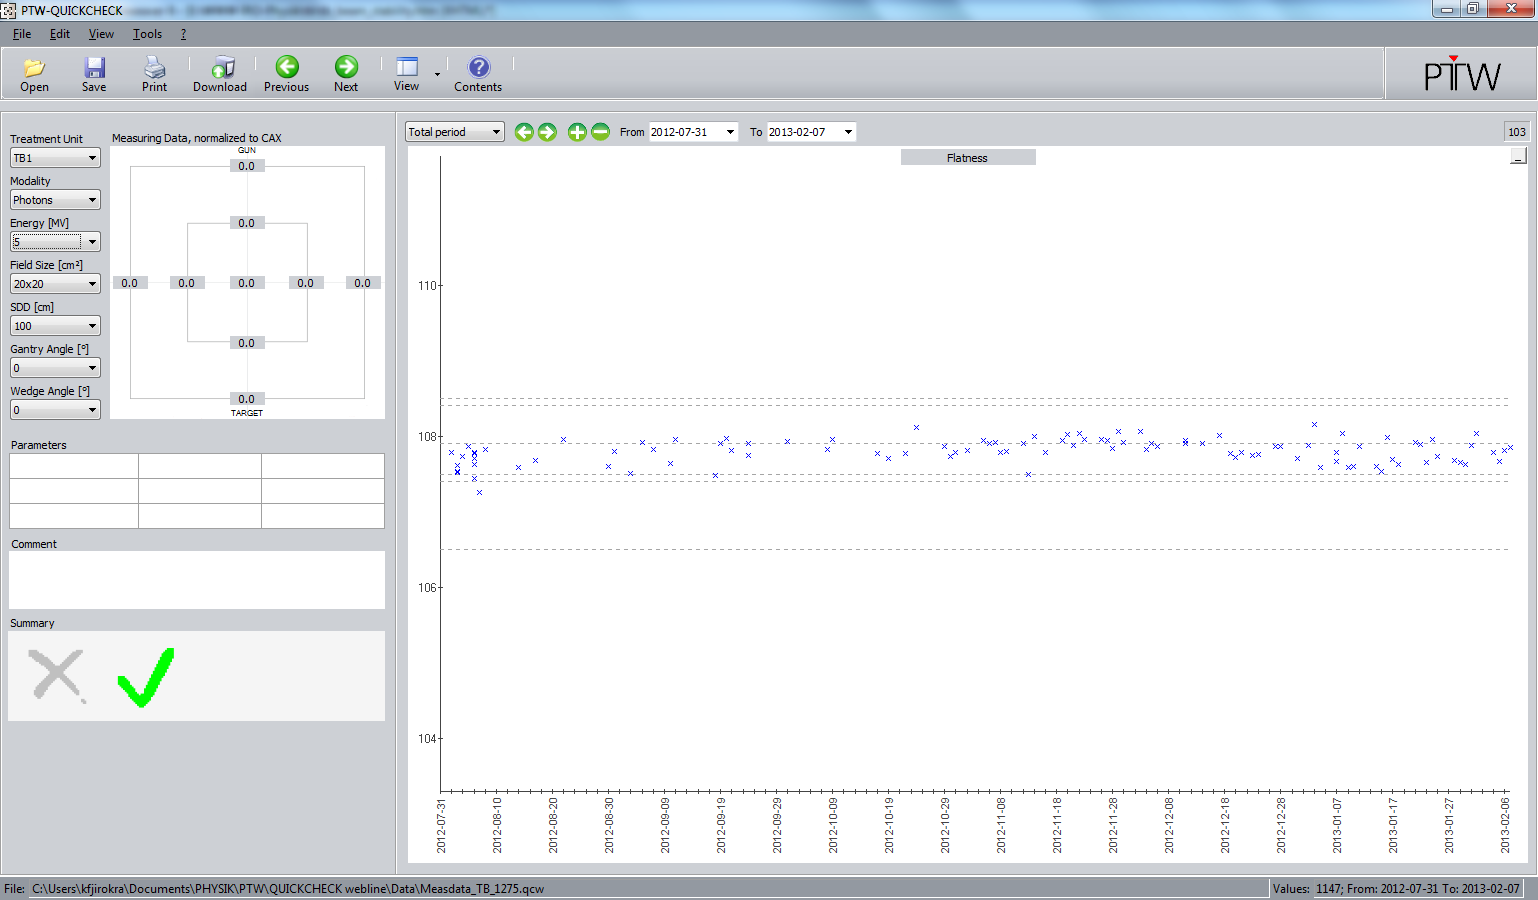
For electrons, 20x20 cm is the correct field size for BQF according to QCw documentation. The 2% limit seems to be very generous: in the 3 month period since November, the largest deviation in BQF occurred for 6 MeV electrons, and was slightly below 0.5%.
The higher the electron energy, the closer the deviations are to zero (see the results for 9, 12, 15, 18, 22 MeV).
Results for TrueBeam 1469 (Update, 11.4.2014)
For our second TrueBeam (TB2, S/N 1469), we observed the same dose output drift as for the first machine.
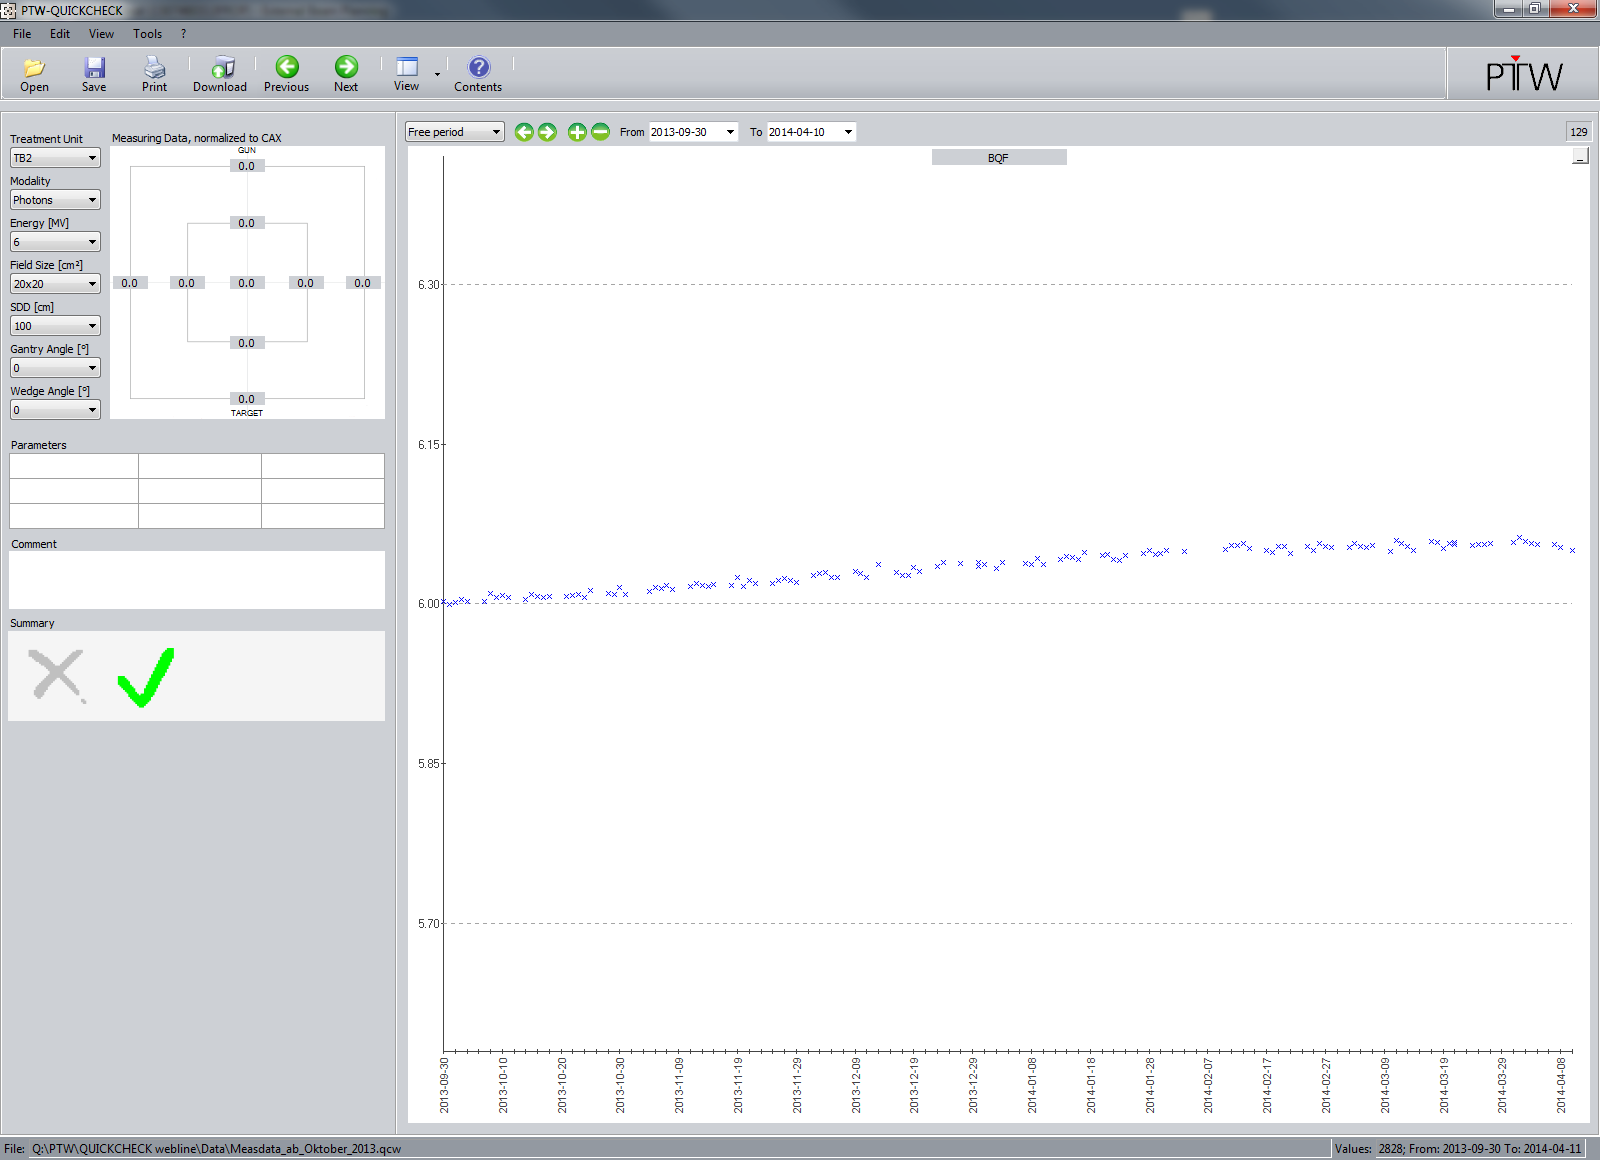
On Oct 1, 2013 TrueBeam 1469 went clinical, and a new measurement file for both linacs was created. The opportunity was taken to adapt tolerances, and change the way the BQF is normalized: instead of normalizing it to 100% of the baseline measurement, for flattened photons we now normalize it to the nominal MV setting (example: BQF baseline is 15 for X15). For FFF, we chose 5 and 9 as normalization values.
After going clinical with our second TrueBeam, we noticed a slow but steady increase in BQF for all photon energies, here shown for X6:
To rule out an actual change in linac beam energy, water phantom depth dose scans were performed. The current depth dose curves (April 2014) were compared to the reference beam data from Eclipse, which had been measured in August 2013:
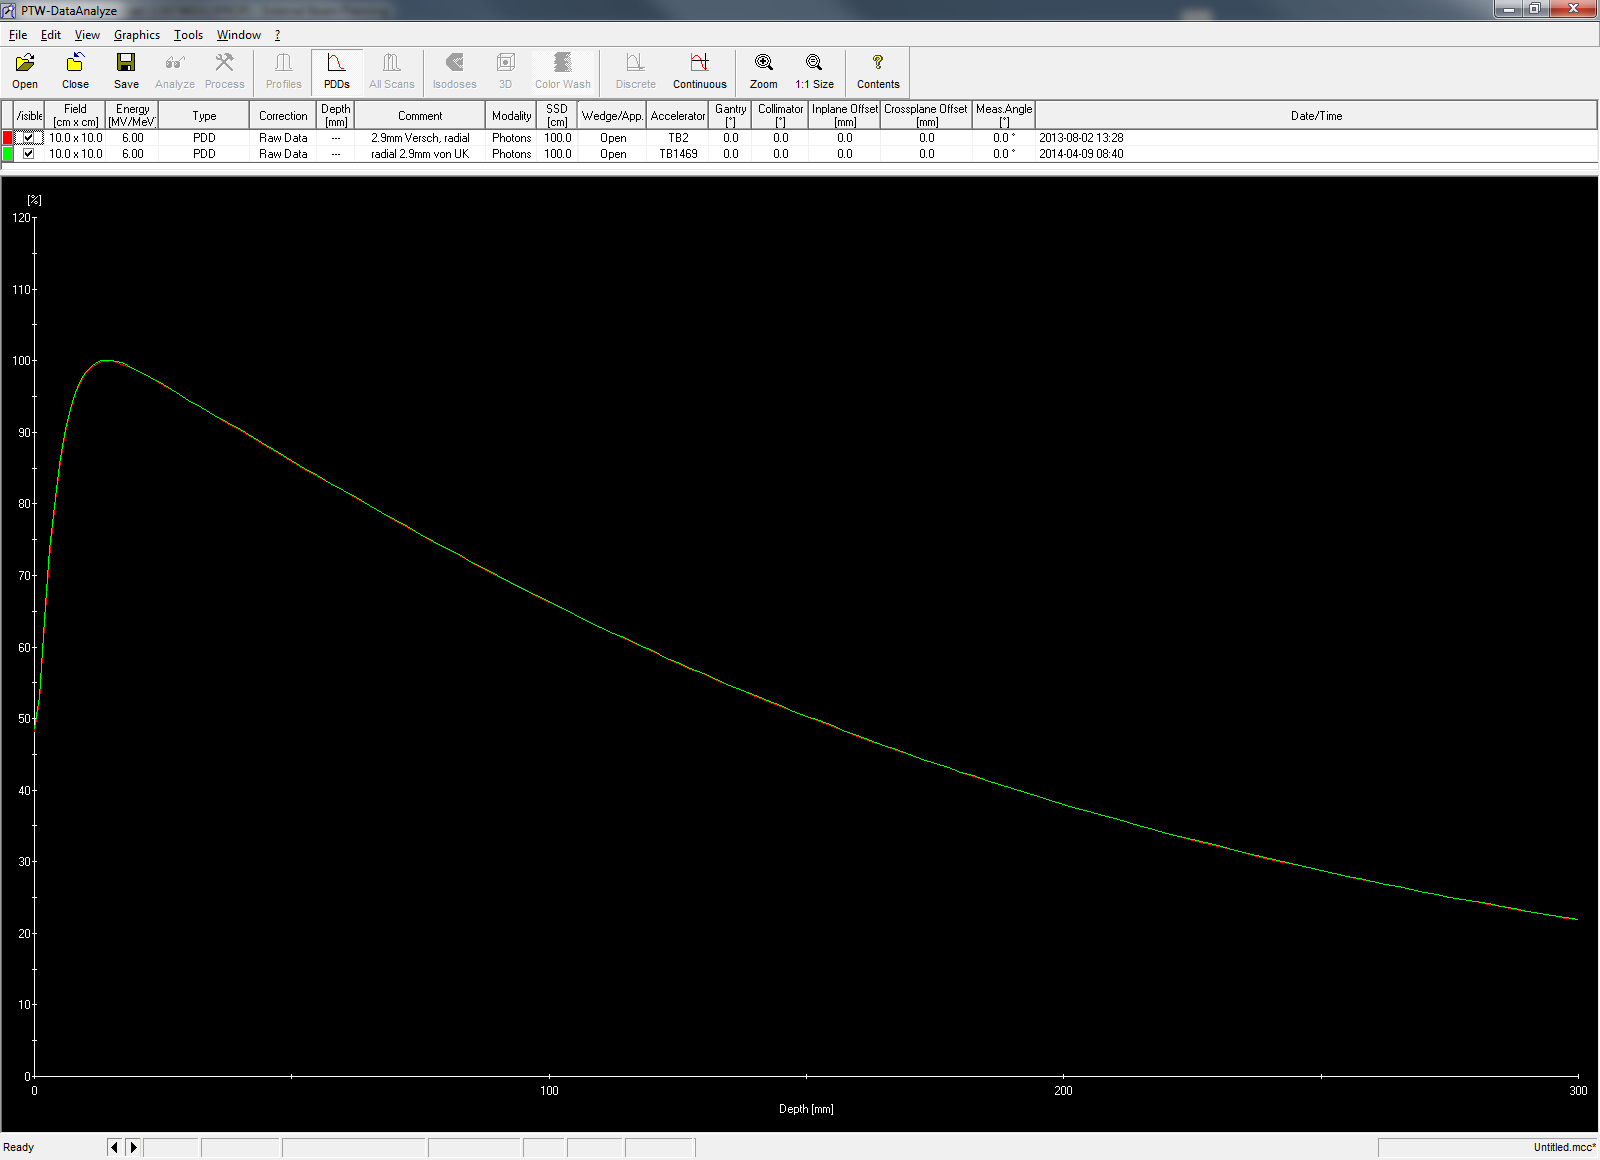
They were absolutely identical for all energies. A second observation was that the transverse symmetry also was drifting slowly over the months, here again for X6:
These two observations suggested that the one (= slow drift in symmetry) was causing the other (= apparent increase in BQF) and that the effect was actually coming from the QCw, not the linac. The suspected interdependence is possible due to the off-axis placement of the energy chambers inside the QCw (see sidebar).
On April 10, 2014 the symmetry problem was solved by recalibrating the Angle Transverse servos (symmetry with servo OFF was better than with servo ON - it is not yet fully understood by Varian why the servos are drifting).
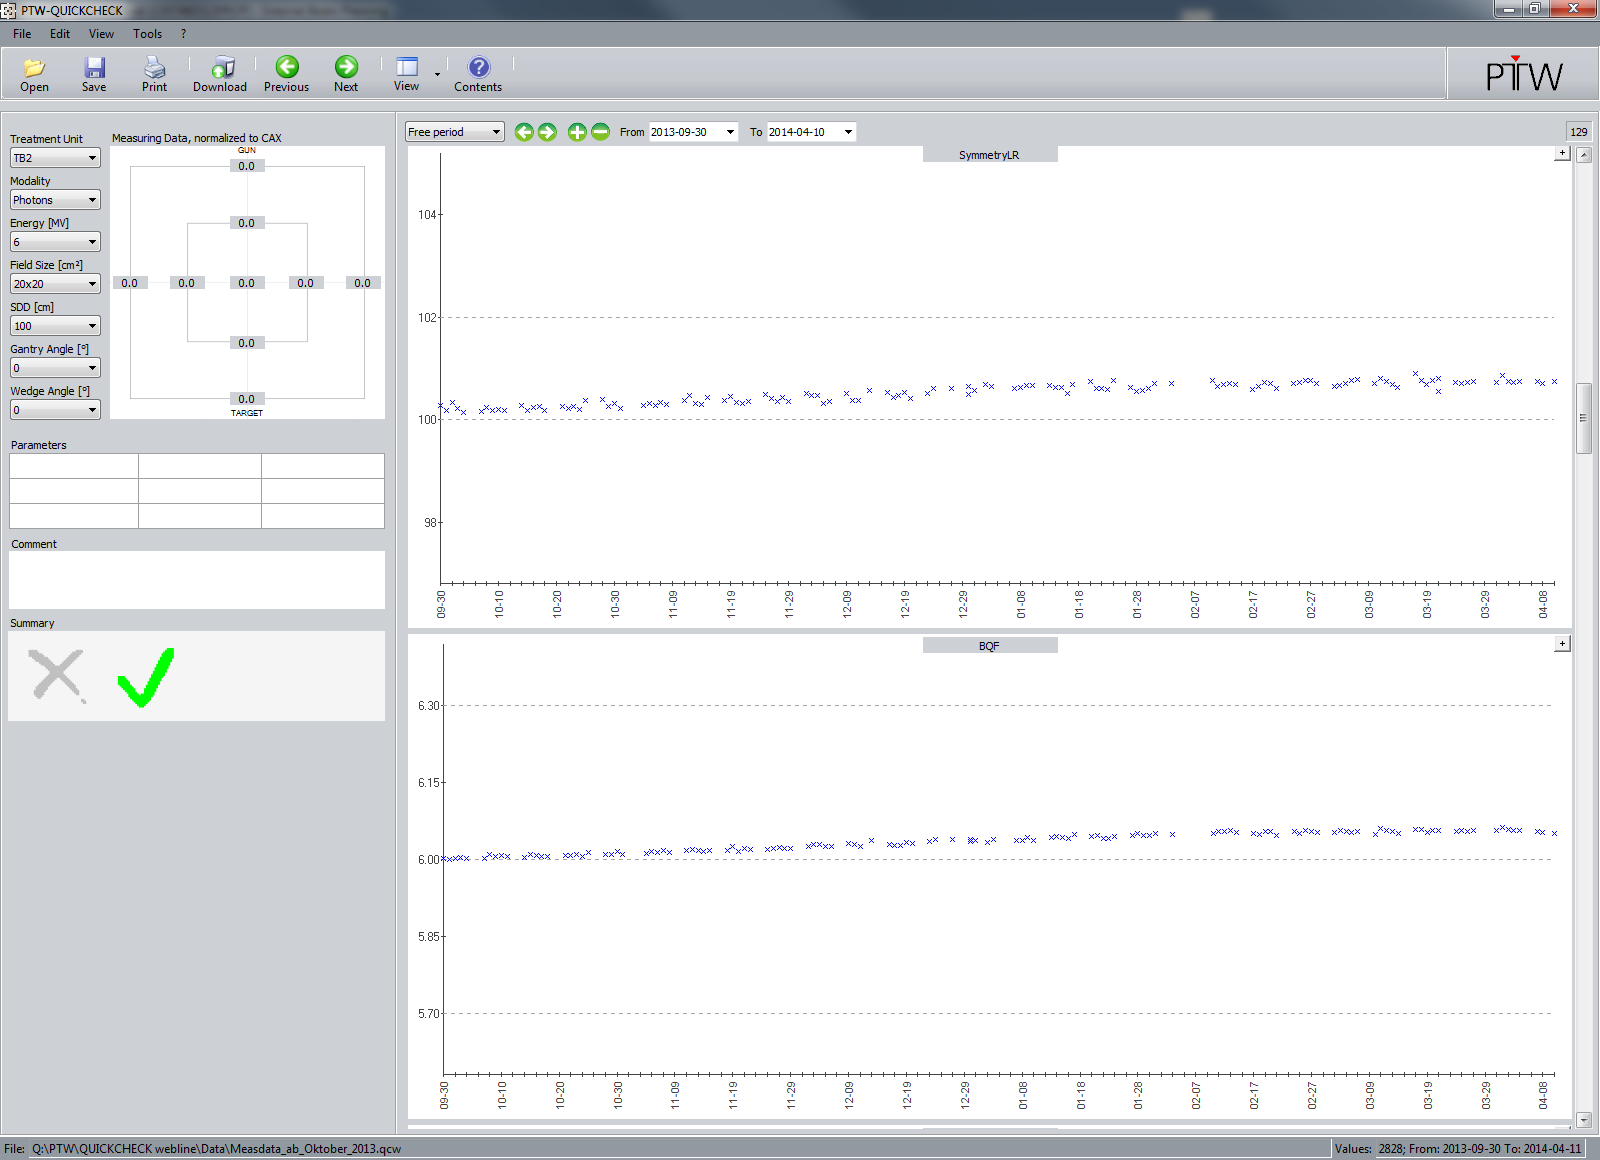
The morning checkout on April 11 not only showed better transverse symmetry, but also - surprise! - a BQF result which again was close to baseline:

One week later, BQF was still at the same level. However, although the calibration of the transverse beam angle on the TrueBeam had an obvious impact on measured BQF, the measured transverse symmetry after the calibration is not affected that much. Measured symmetry had always been better than 1% (101% in the graph), and results better than 100.5% are hard to achieve.
The interdependence of BQF and Symmetry, already noticed at TrueBeam 1275, has therefore been confirmed on TrueBeam 1469.
Discussion
An initial "seasoning" process seems to take place inside the TrueBeam monitor chambers. This requires an output recalibration at approximately 50 kGy after installation.
On our C-series linacs (2300 C/D) we had observed over the full lifetime of the linacs (16 years) a gradual decrease of monitor sensitivity (leading to an increased dose output). This probably simply happens at a faster pace if the monitor chambers are new.
Although the symmetry limit of 2% was never exceeded, the spread of measured symmetry values is larger for unflattened than for flattened beams, by a factor of two to three.
QCw, nomen est omen, makes the data aquisition process quick and easy. No extra PC has to be started, no thermometer or barometer has to be prepared. The device performed without any problems during the first 6 months, even at the highest FFF dose rates. However, the interdependence of measured symmetry and measured BQF has to be understood by the user.
Notes
1The process of output recalibration on the TrueBeam is easy: in service mode, entering 102.0 for instance in the correct field reduces machine output by 2% for the energy currently loaded. This approximate method (which does not even require a beam-on) is usually sufficient to get back to the center of the allowed tolerance band for dose output. However, for more accurate output calibrations, water phantom and calibrated chamber should be used of course.