Dose Reconstruction
VeriSoft applies user measured PDD curves to reconstruct the 3D dose. Whenever an XCC-file is loaded in VeriSoft, the following dialog asks for a corresponding PDD curve (X06FFF in this case):
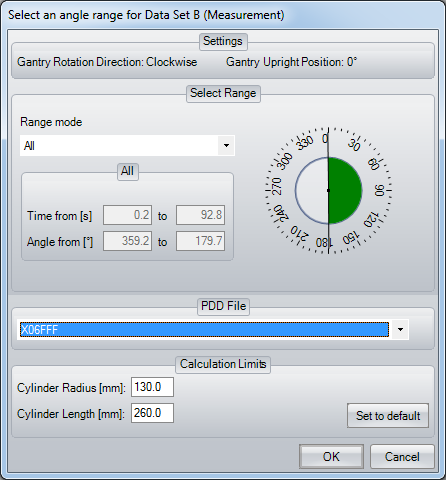
It is important to choose the correct file, otherwise the reconstruction will use the wrong energy. VeriSoft has no information about beam energy, and will simply display the file last used.
The grid size which VeriSoft uses for dose reconstruction is set under Tools > Options ... > 4D Dosimetry:
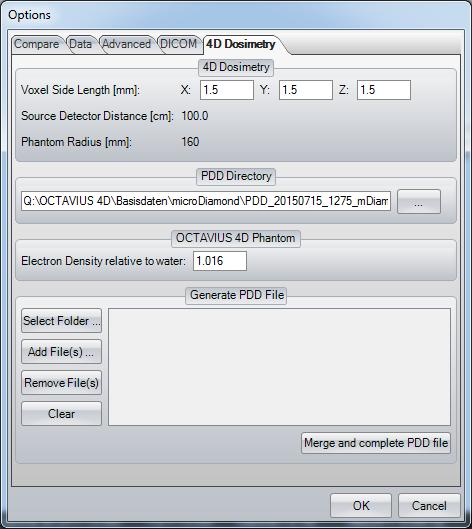
Our current default is 1.5 mm. However, it is advantageous to match the grid to the calculation grid size which is set in the TPS. See the remarks at the bottom of our clinical examples.
Real measured data values are always located in an ionisation chamber of the 2D Array. Dose values above and below along the fanline connecting the focus and the chamber are reconstructed using the PDDs.
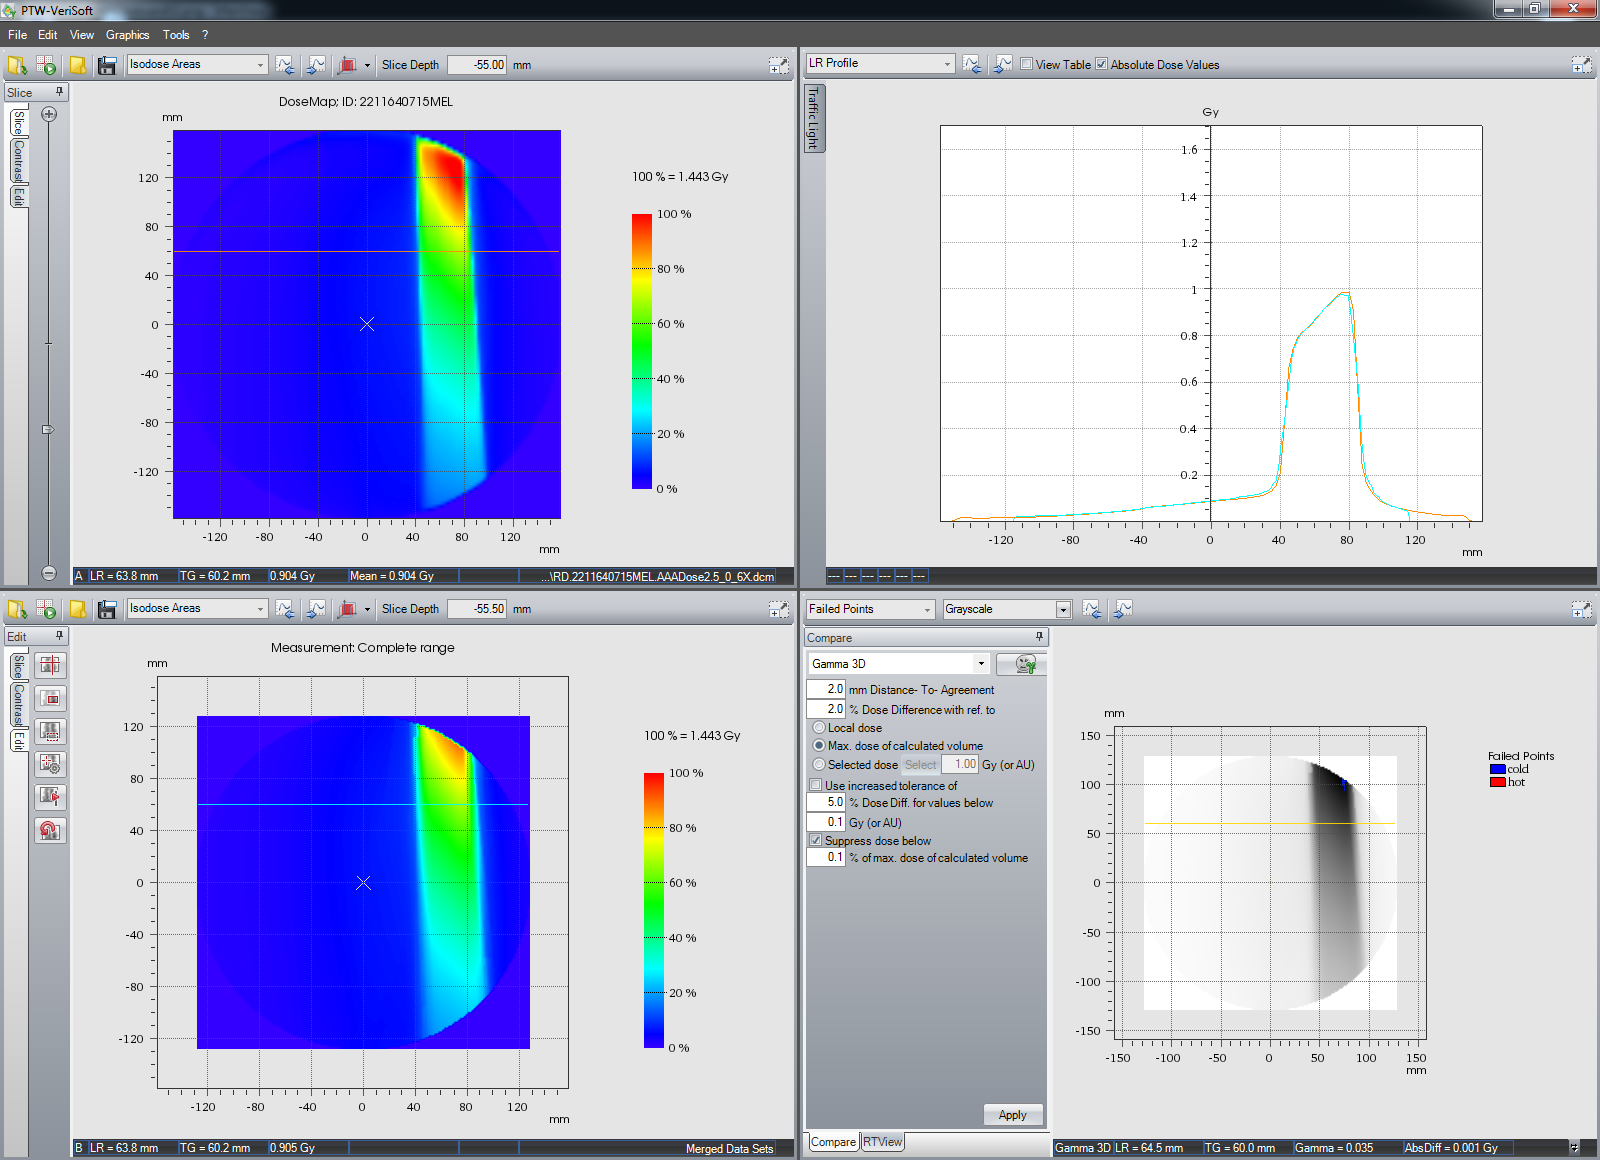
This can be directly visualized by looking at a single 6X IMRT field delivered at gantry 0° (no VMAT, no rotation). The coronal plane through isocenter directly shows the 2D dose measured in the array plane (lower left). TPS dose is in the upper left pane:
The transversal plane however is a pure reconstruction. A single point along the vertical profile is really measured: the value at phantom center (~ 0.6 Gy):
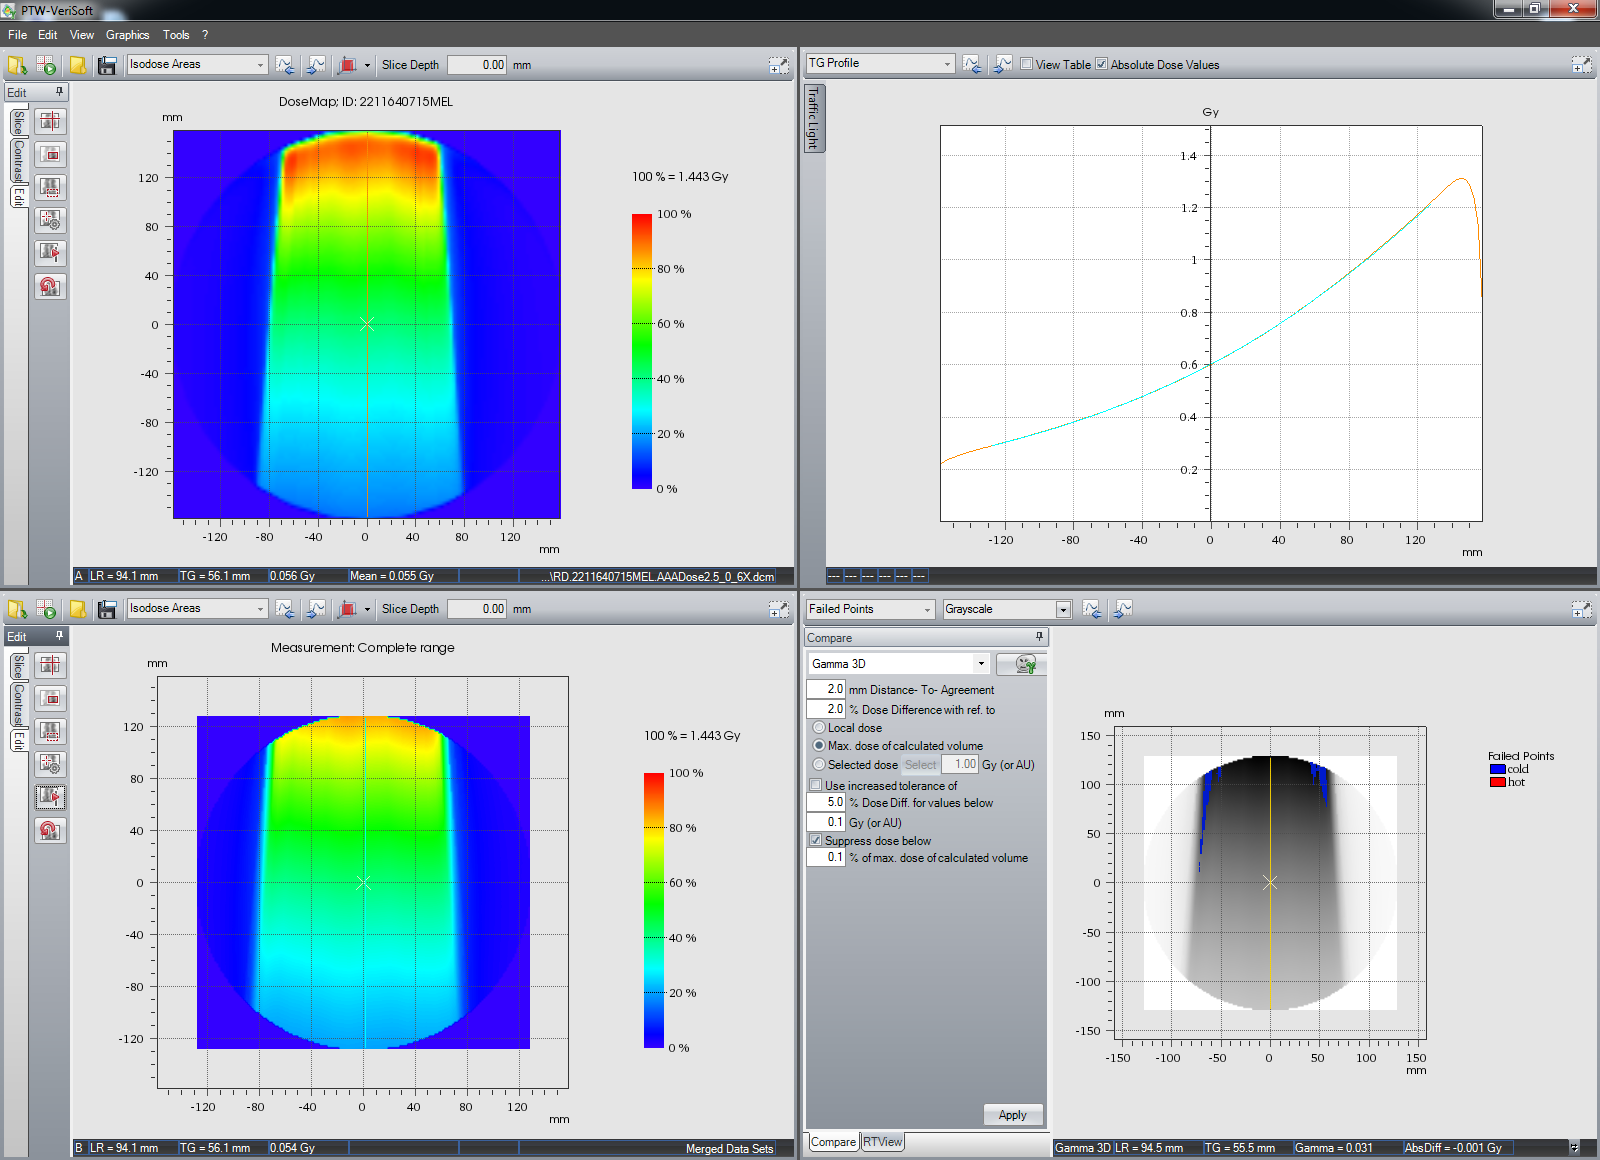
The reconstruction covers a diameter of 260 mm for the Standard top and 170 mm for the SRS top. This is why the depth dose curve in the upper right plot goes from -130 mm to +130 mm.
One can see in the upper right pane of the above screenshot, that the PDDs match quite well. Our PDDs were measured with a microDiamond detector for all field sizes. This seems to be a good choice.
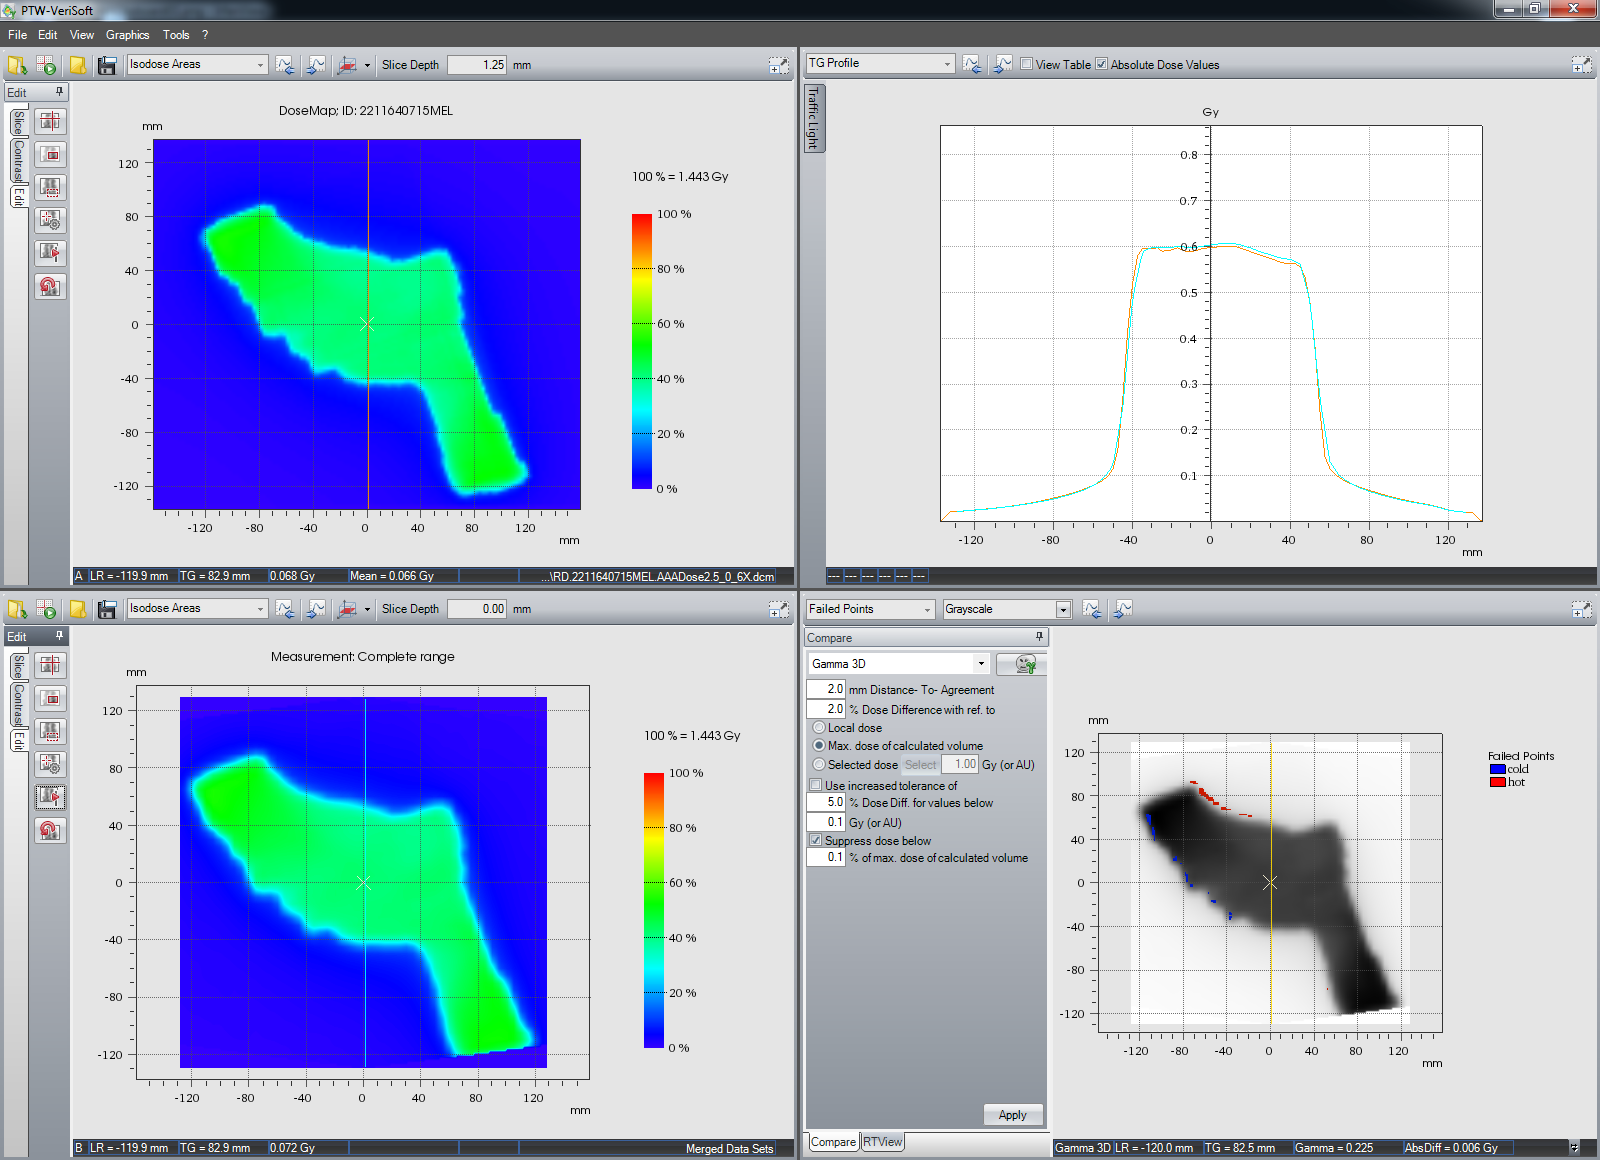
That the reconstruction also works off-axis can be seen in the following two images. We start in the coronal view and select a horizontal profile at (TG = -55.4 mm) off-axis in the caudal direction:
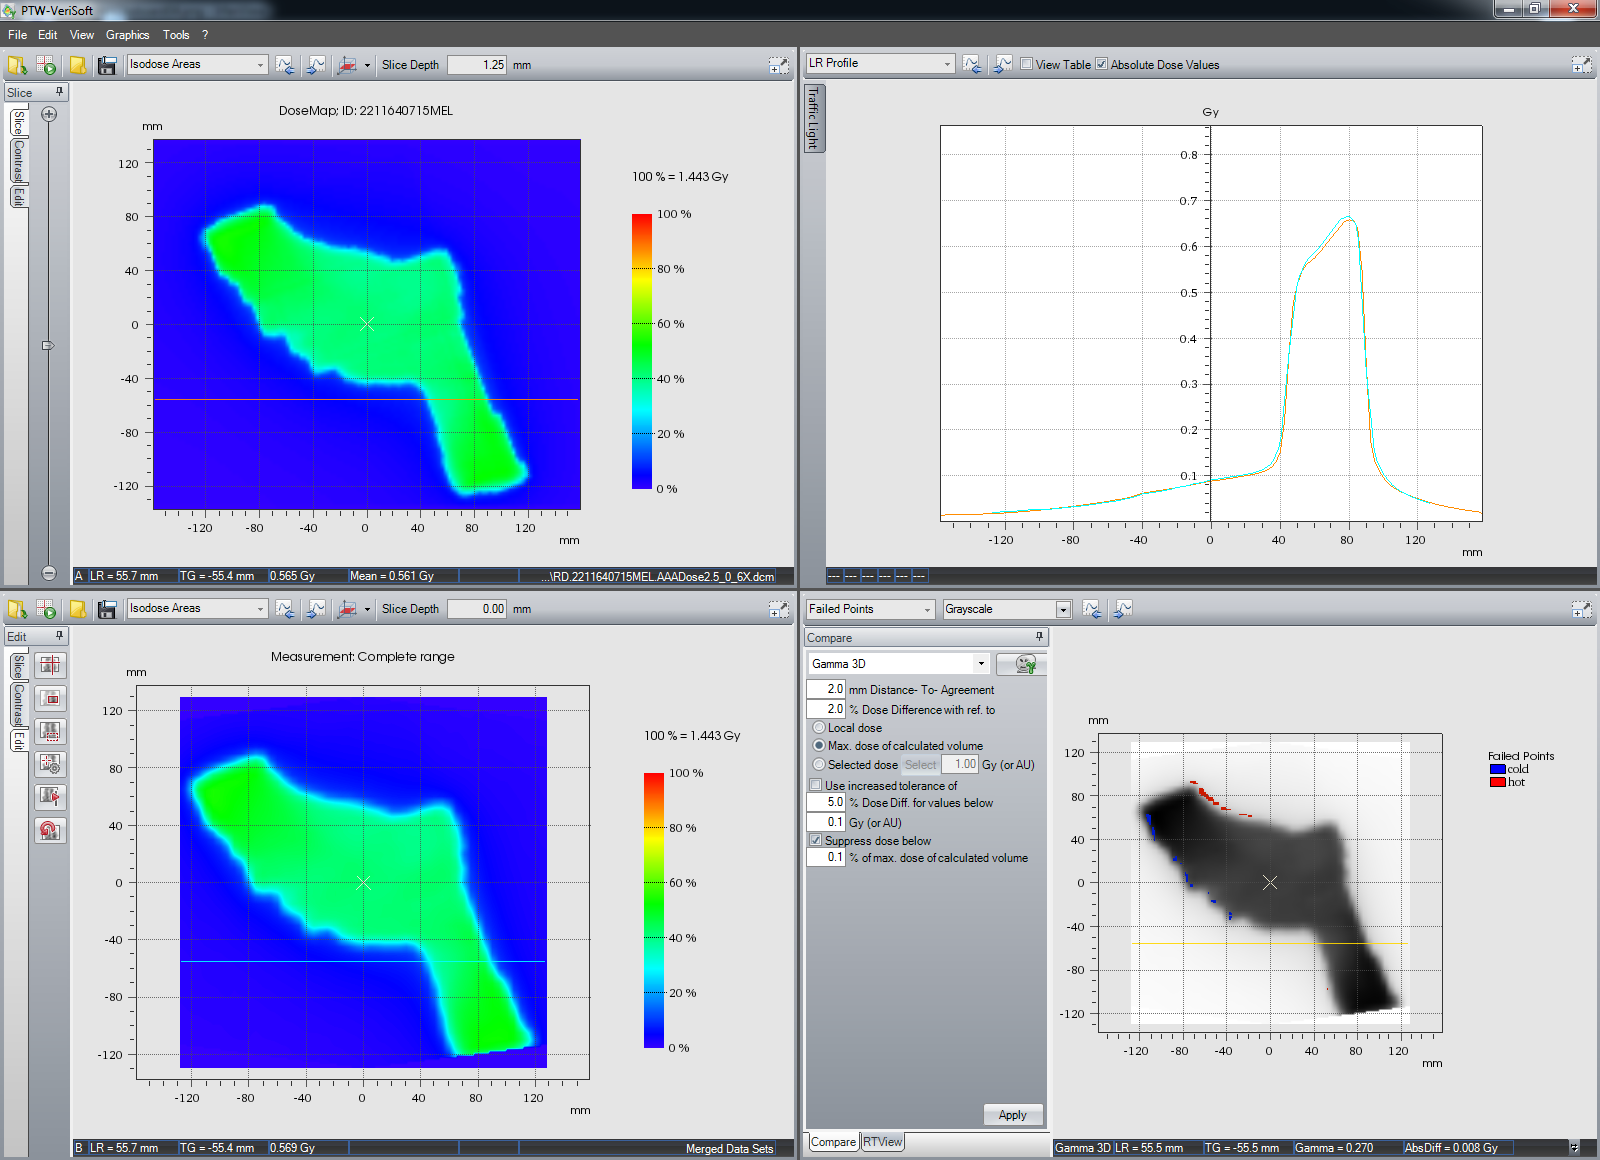
At this position, we cut vertically into the image plane. This results in a transversal slice, which is at -55 mm ("Slice Depth" above the upper left image in the next image). Moving towards focus with the horizontal profile still shows very good agreement (upper right):