Surface dose is usually defined as % depth dose in 0.5 mm depth, with normalization to dose maximum. For this simple analysis, we want to use a different definition:
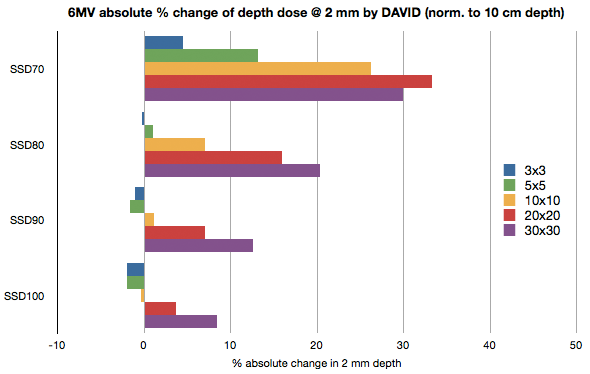
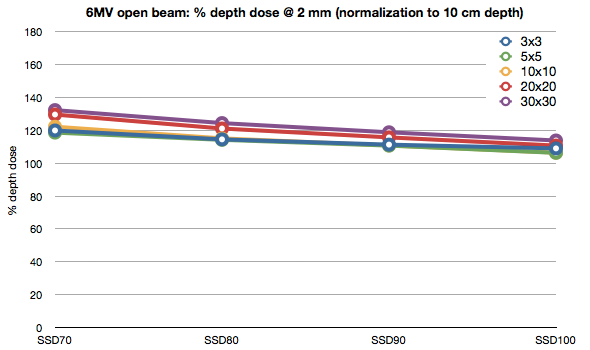
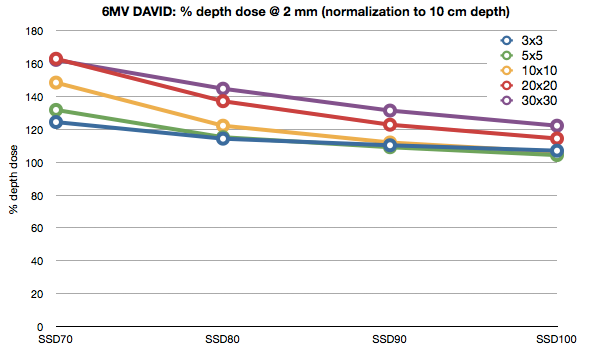
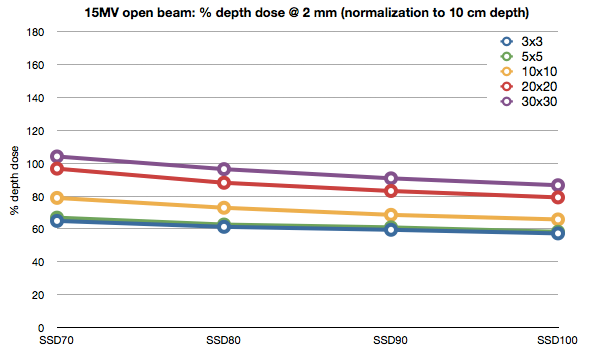
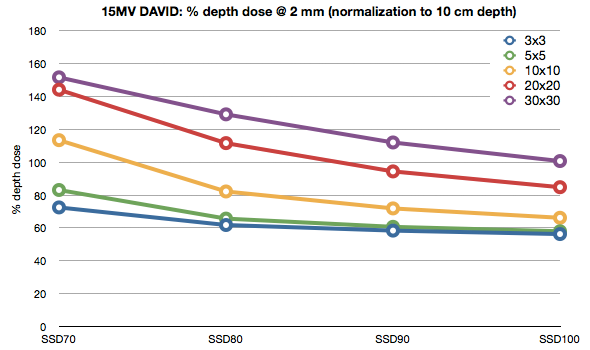
We define surface dose as % depth dose in 2 mm depth, with normalization to 100 mm.
This is done for two reasons:
- We wanted to use the same detector for all field sizes from 1x1 cm (for transmission measurements) to 30x30 cm. We chose the 60008 shielded photon dosimetry diode.
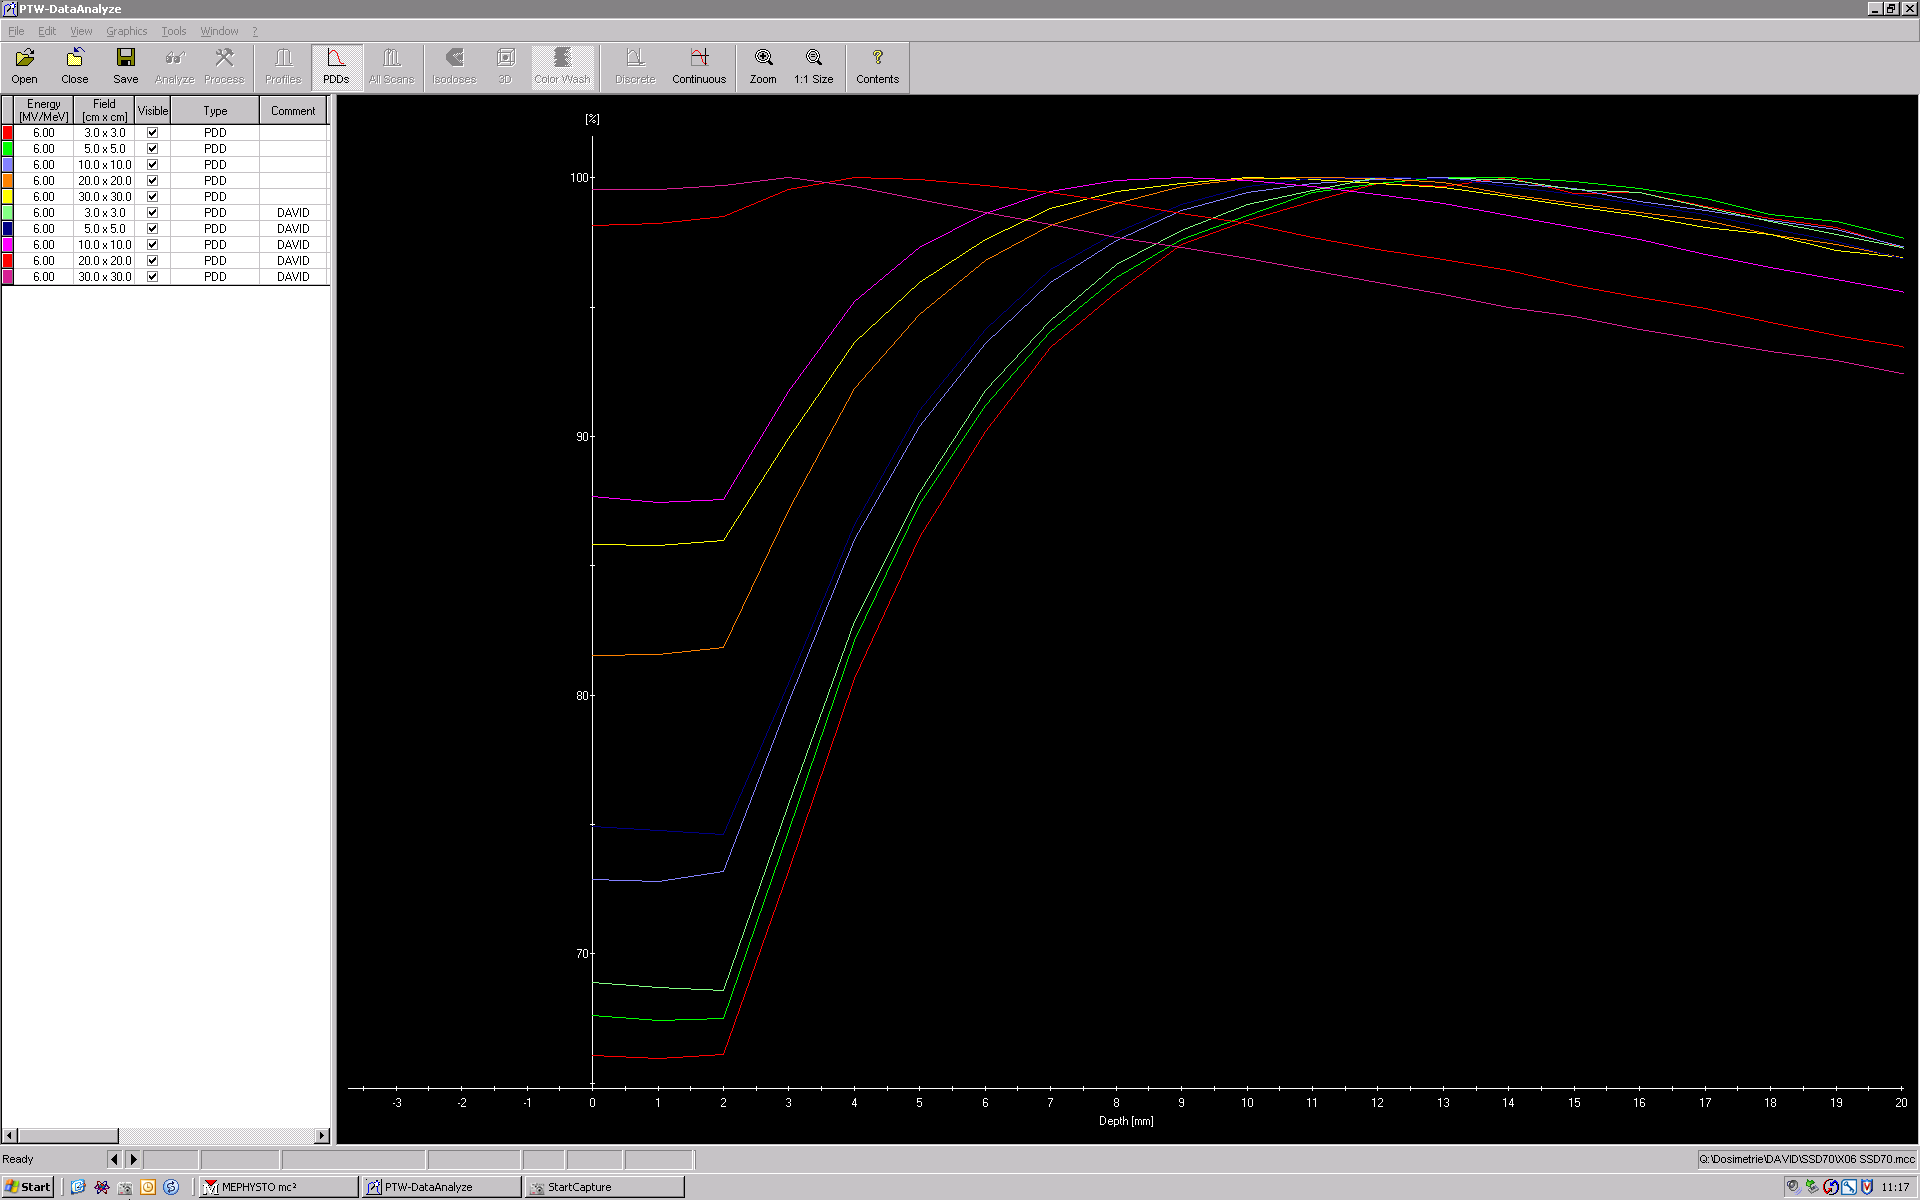
- The 60008 is mounted upright in the water phantom, with the detector axis parallel to the beam axis. The detector is basically a cylinder with its reference point 2 mm behind the front surface. At the reference point, a small semiconductor with an area of 1x1 mm2 and negligible thickness is located. When depth dose curves are measured with the 60008, the buildup the semiconductor "sees" in the first two millimetres of water depth is constant: it is simply the 2 mm thick front window (see zoom into the buildup region). Water depth scale is zero when the semiconductor inside the 60008 cylinder is aligned with the water surface.
We could extrapolate all raw depth dose curves to zero depth. But we find it more honest to analyse at 2 mm and not speculate about 0 mm. This should not be a thesis work!
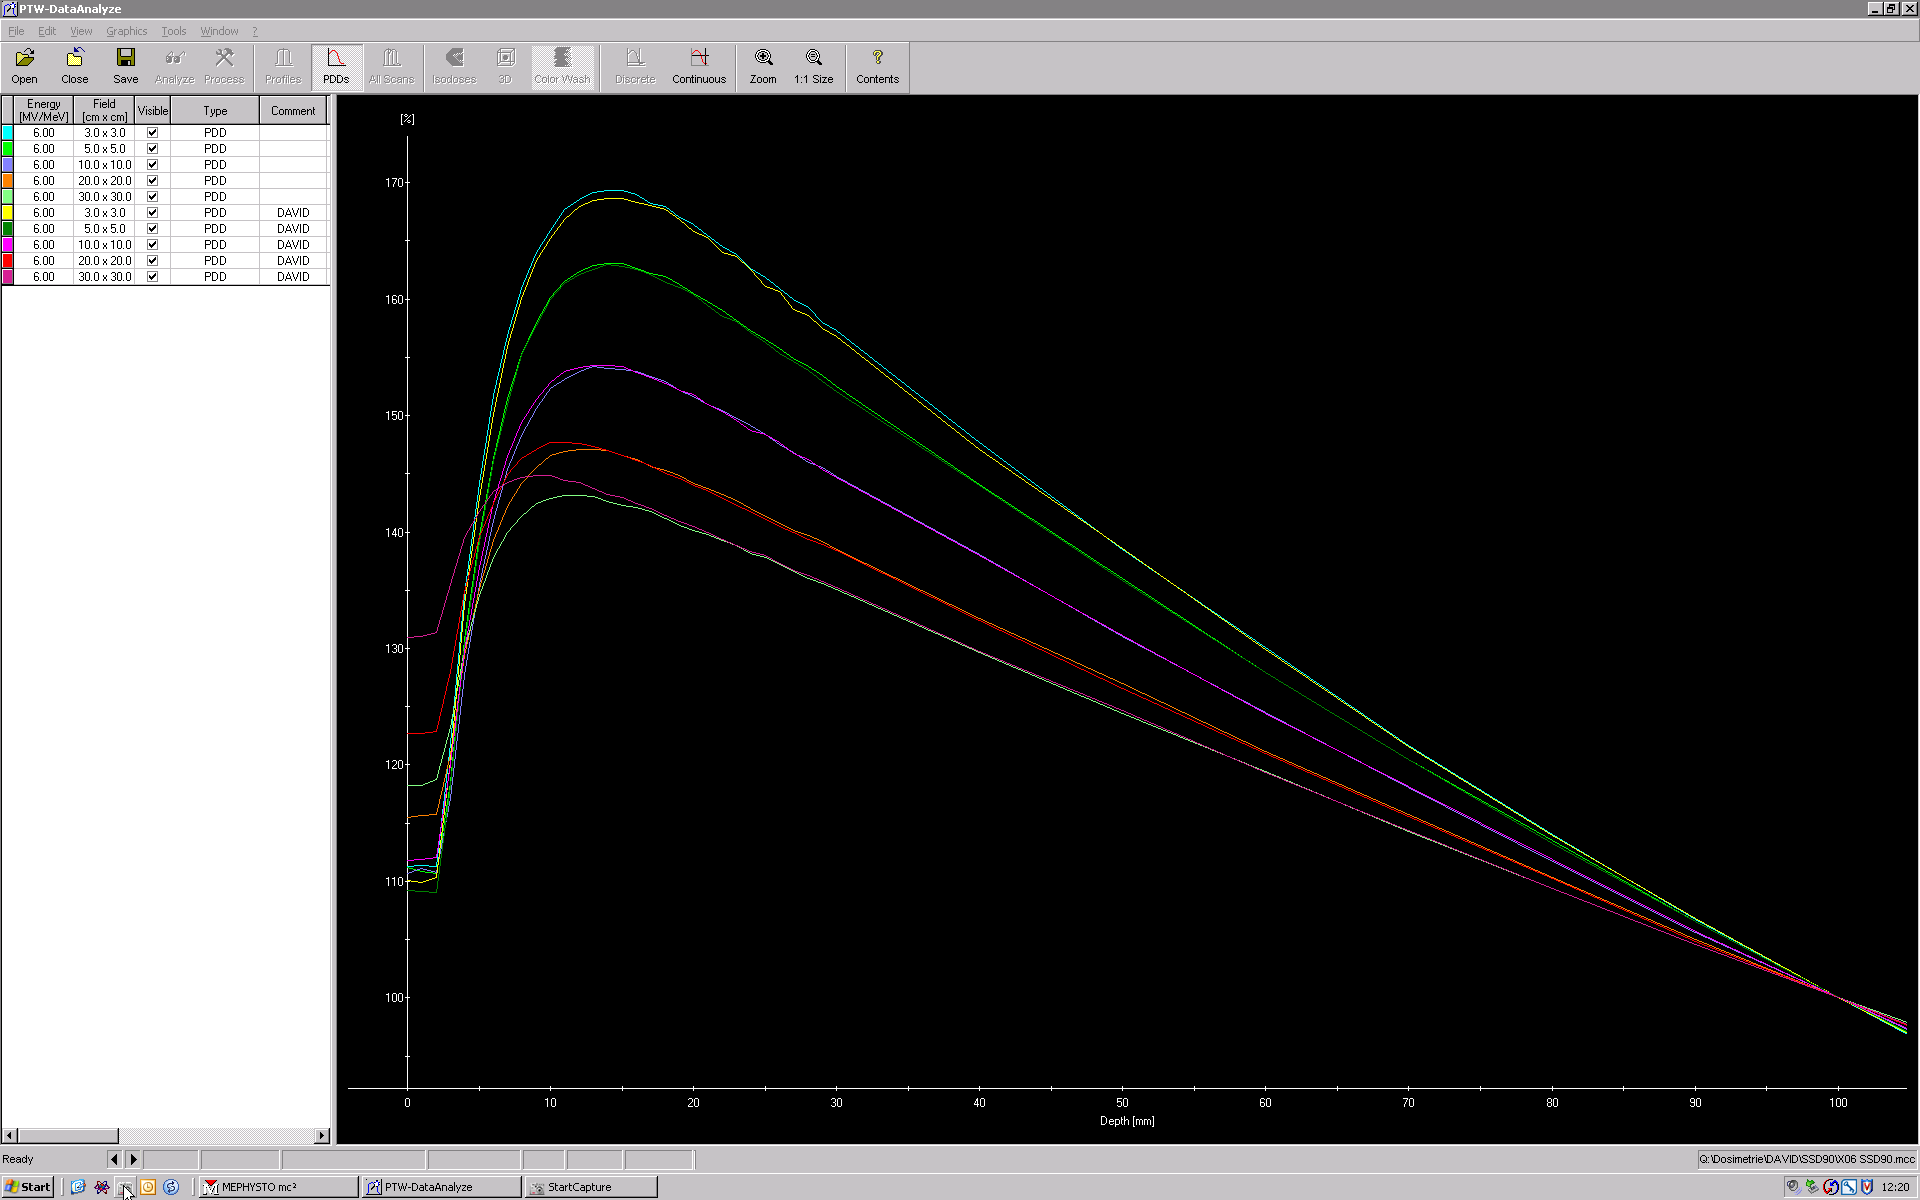
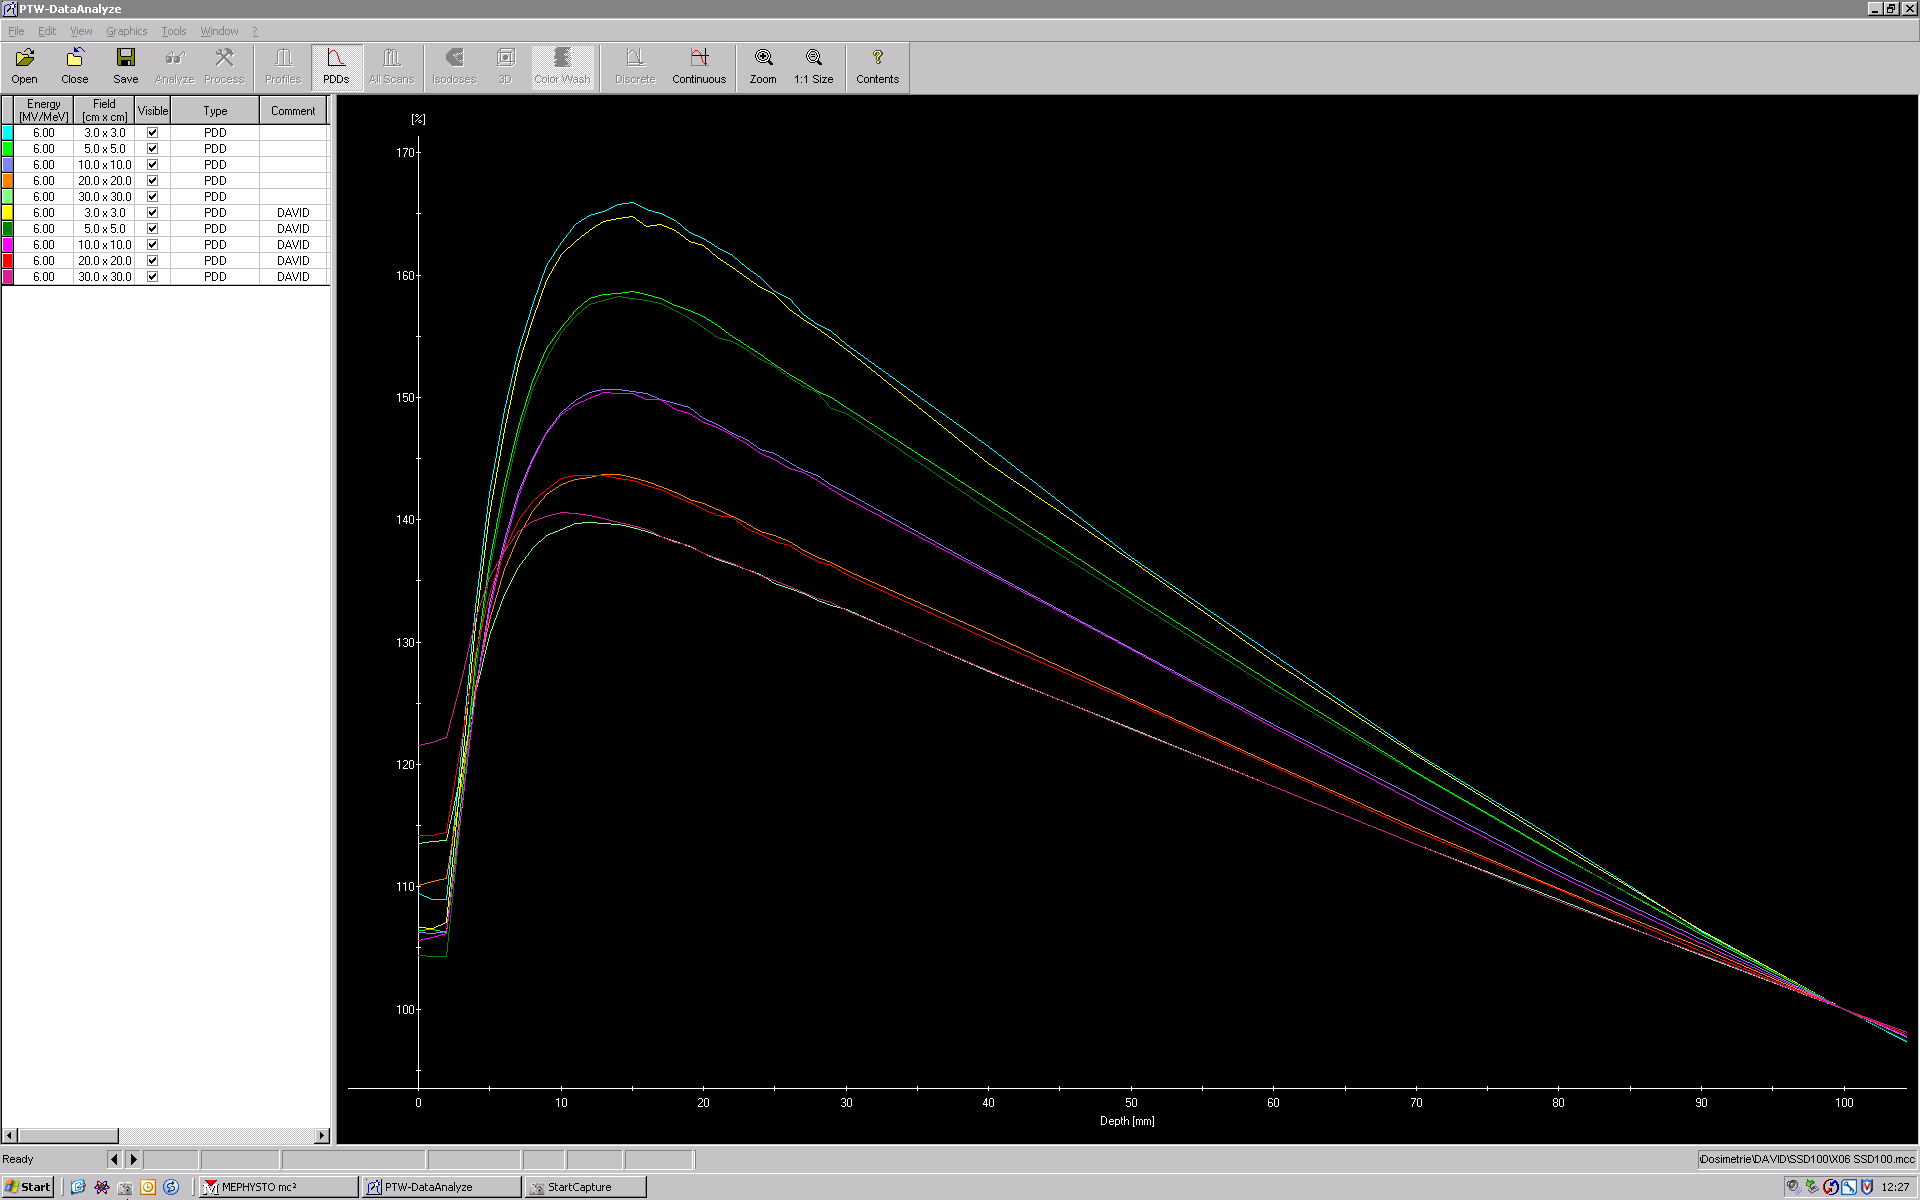
For several combinations of square field sizes and source surface distances (see table below), we measured depth dose curves in the large water phantom with and without DAVID. Except for the 3x3 field size, which was measured absolute, all other field sizes were measured with a 31002 chamber as reference detector.
One note regarding normalization: If both curves are independently normalized at their own dose maximum, the problem of attenuation is ignored. Curves will run more or less parallel beyond dmax, which means that at any given depth, dose values are different. By normalizing all curves at 100 mm depth, we want to make clear that the attenuation of DAVID has been taken into account by a tray factor.
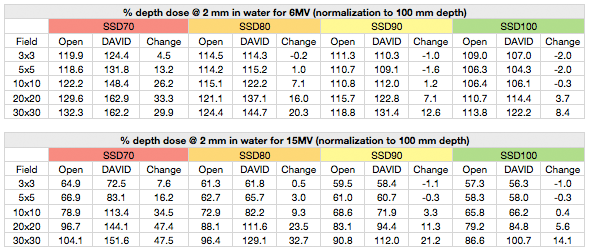
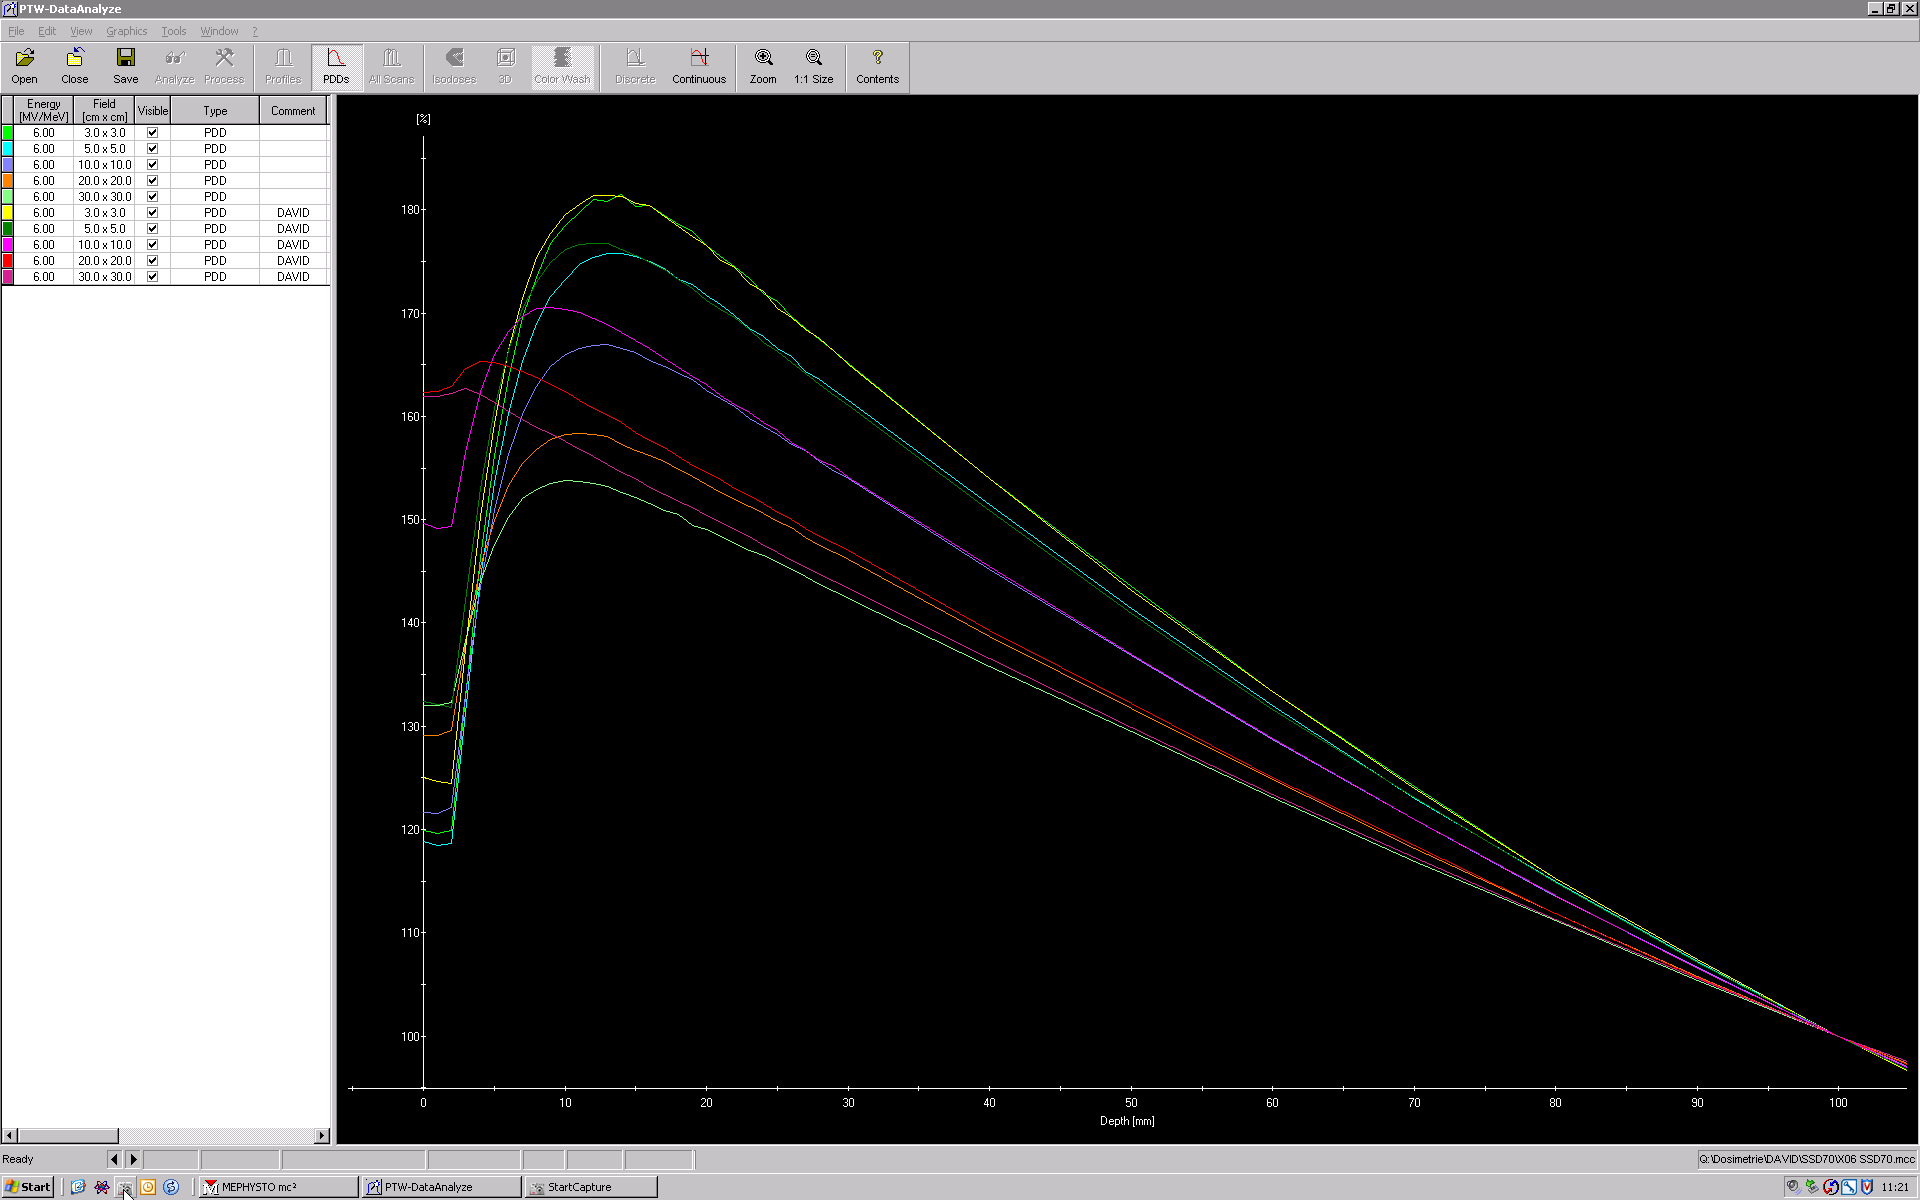
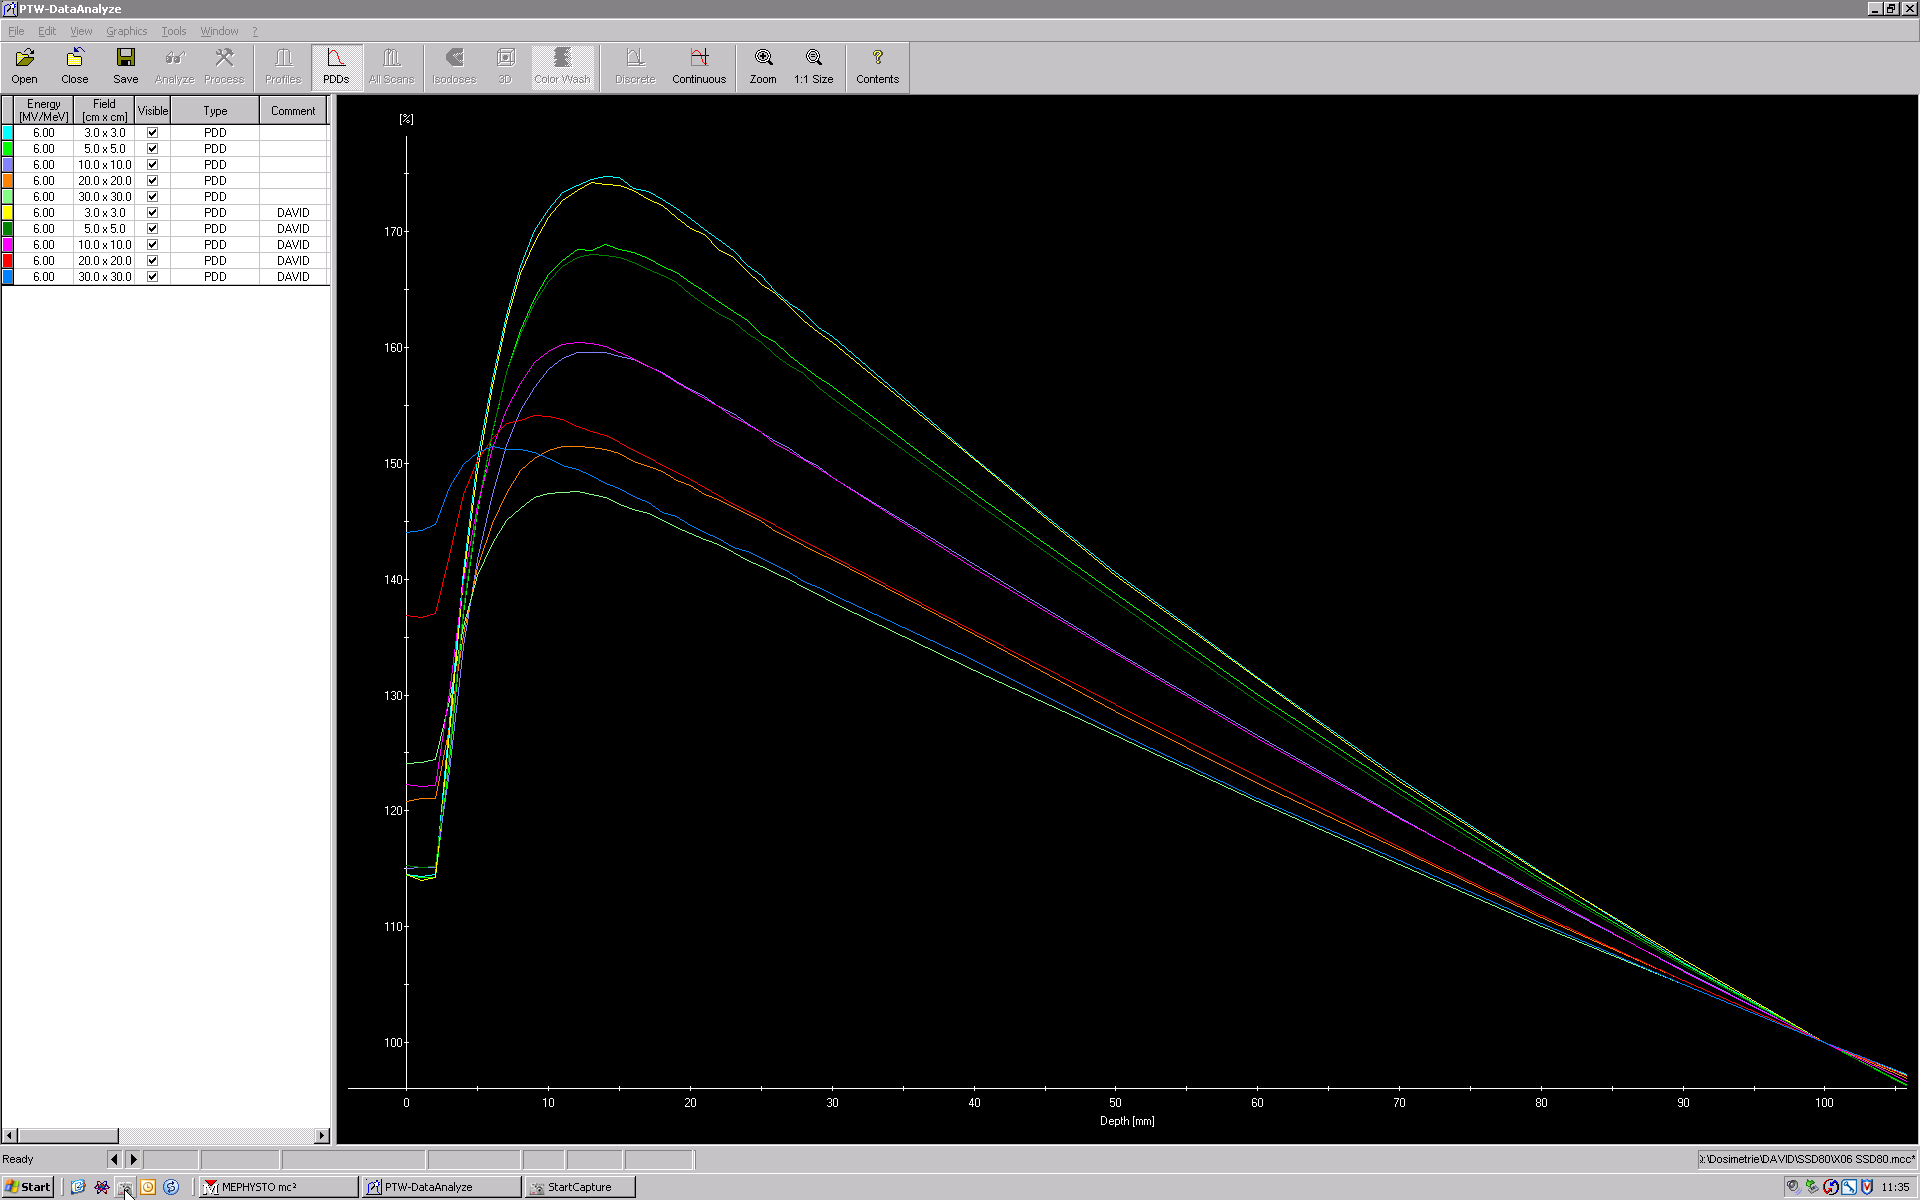
The same data is displayed graphically in the following plots.
Results for 6MV
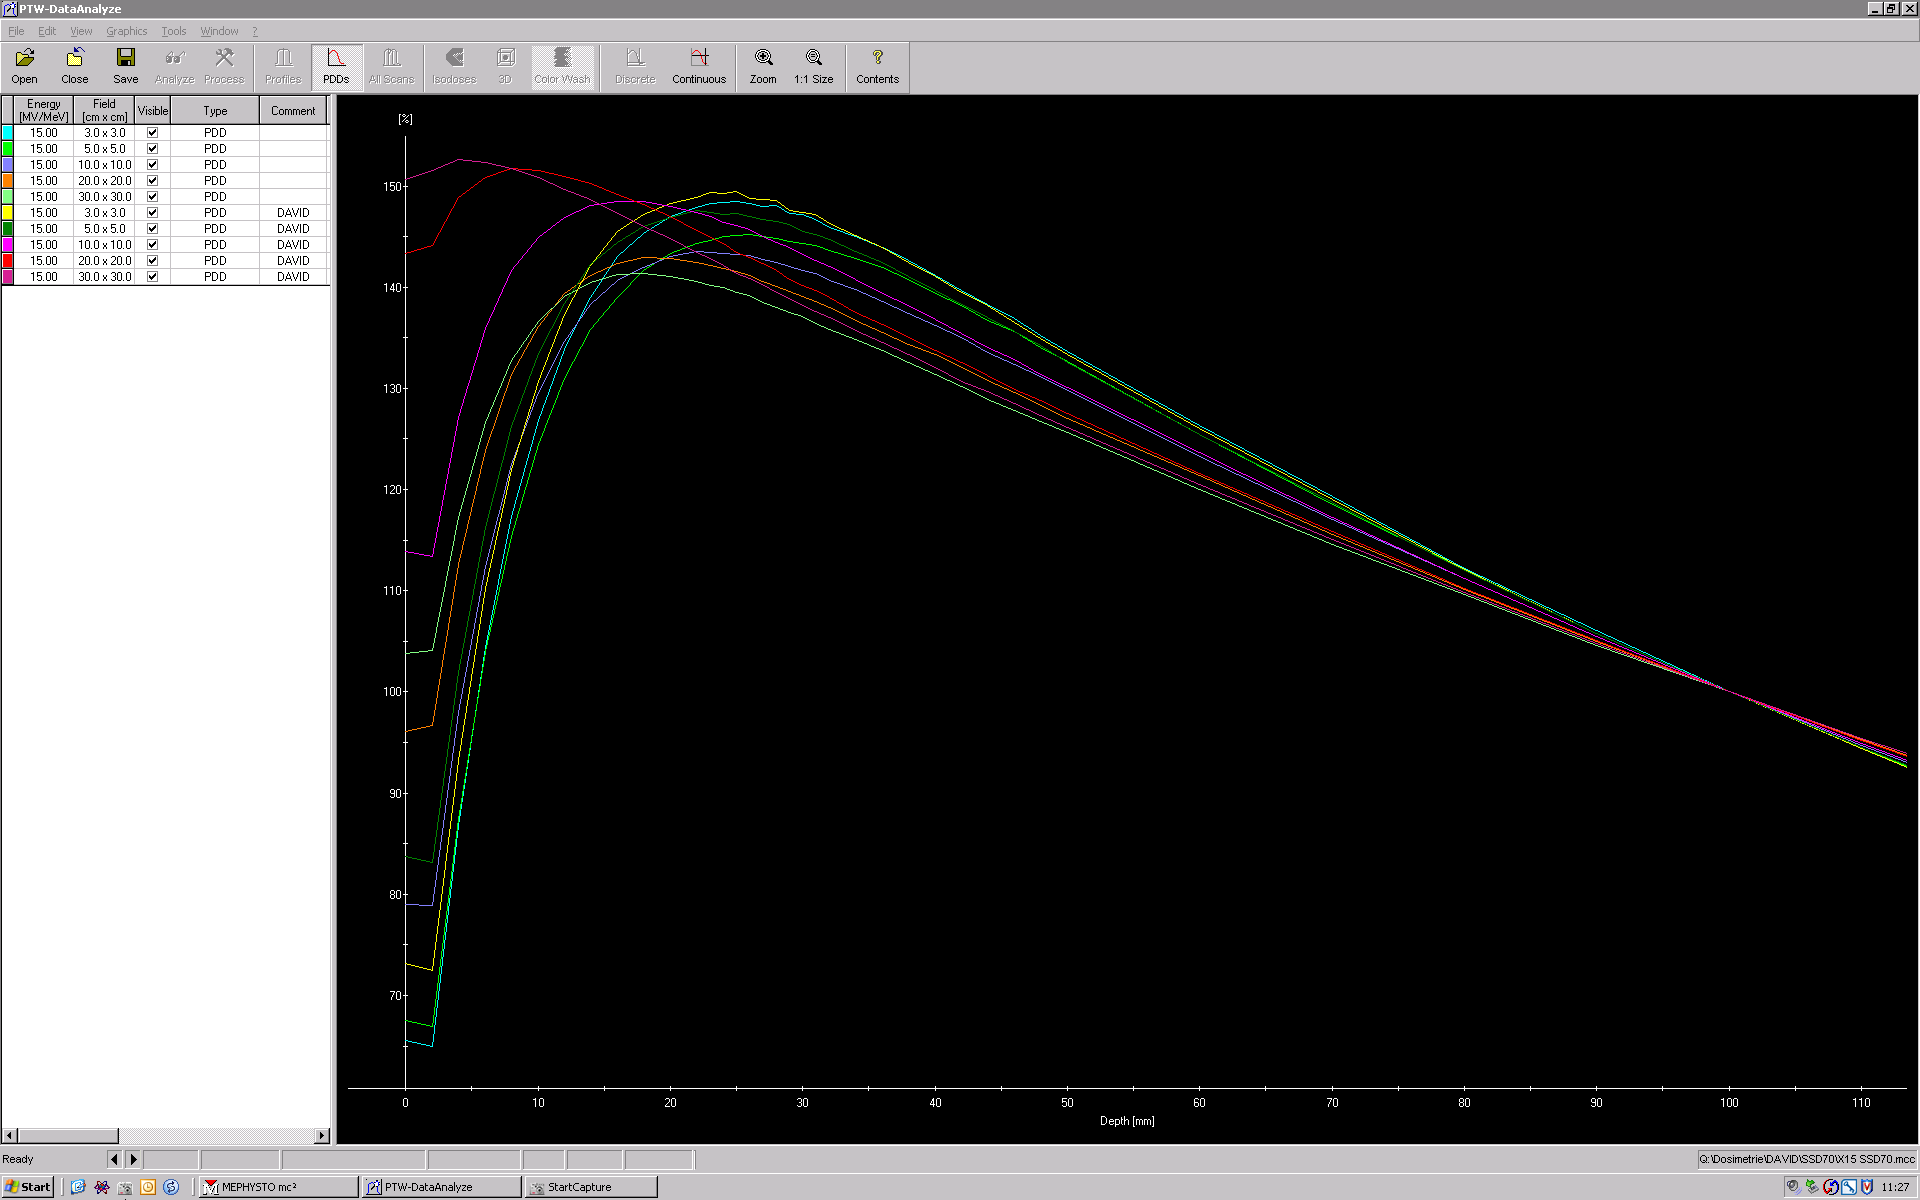
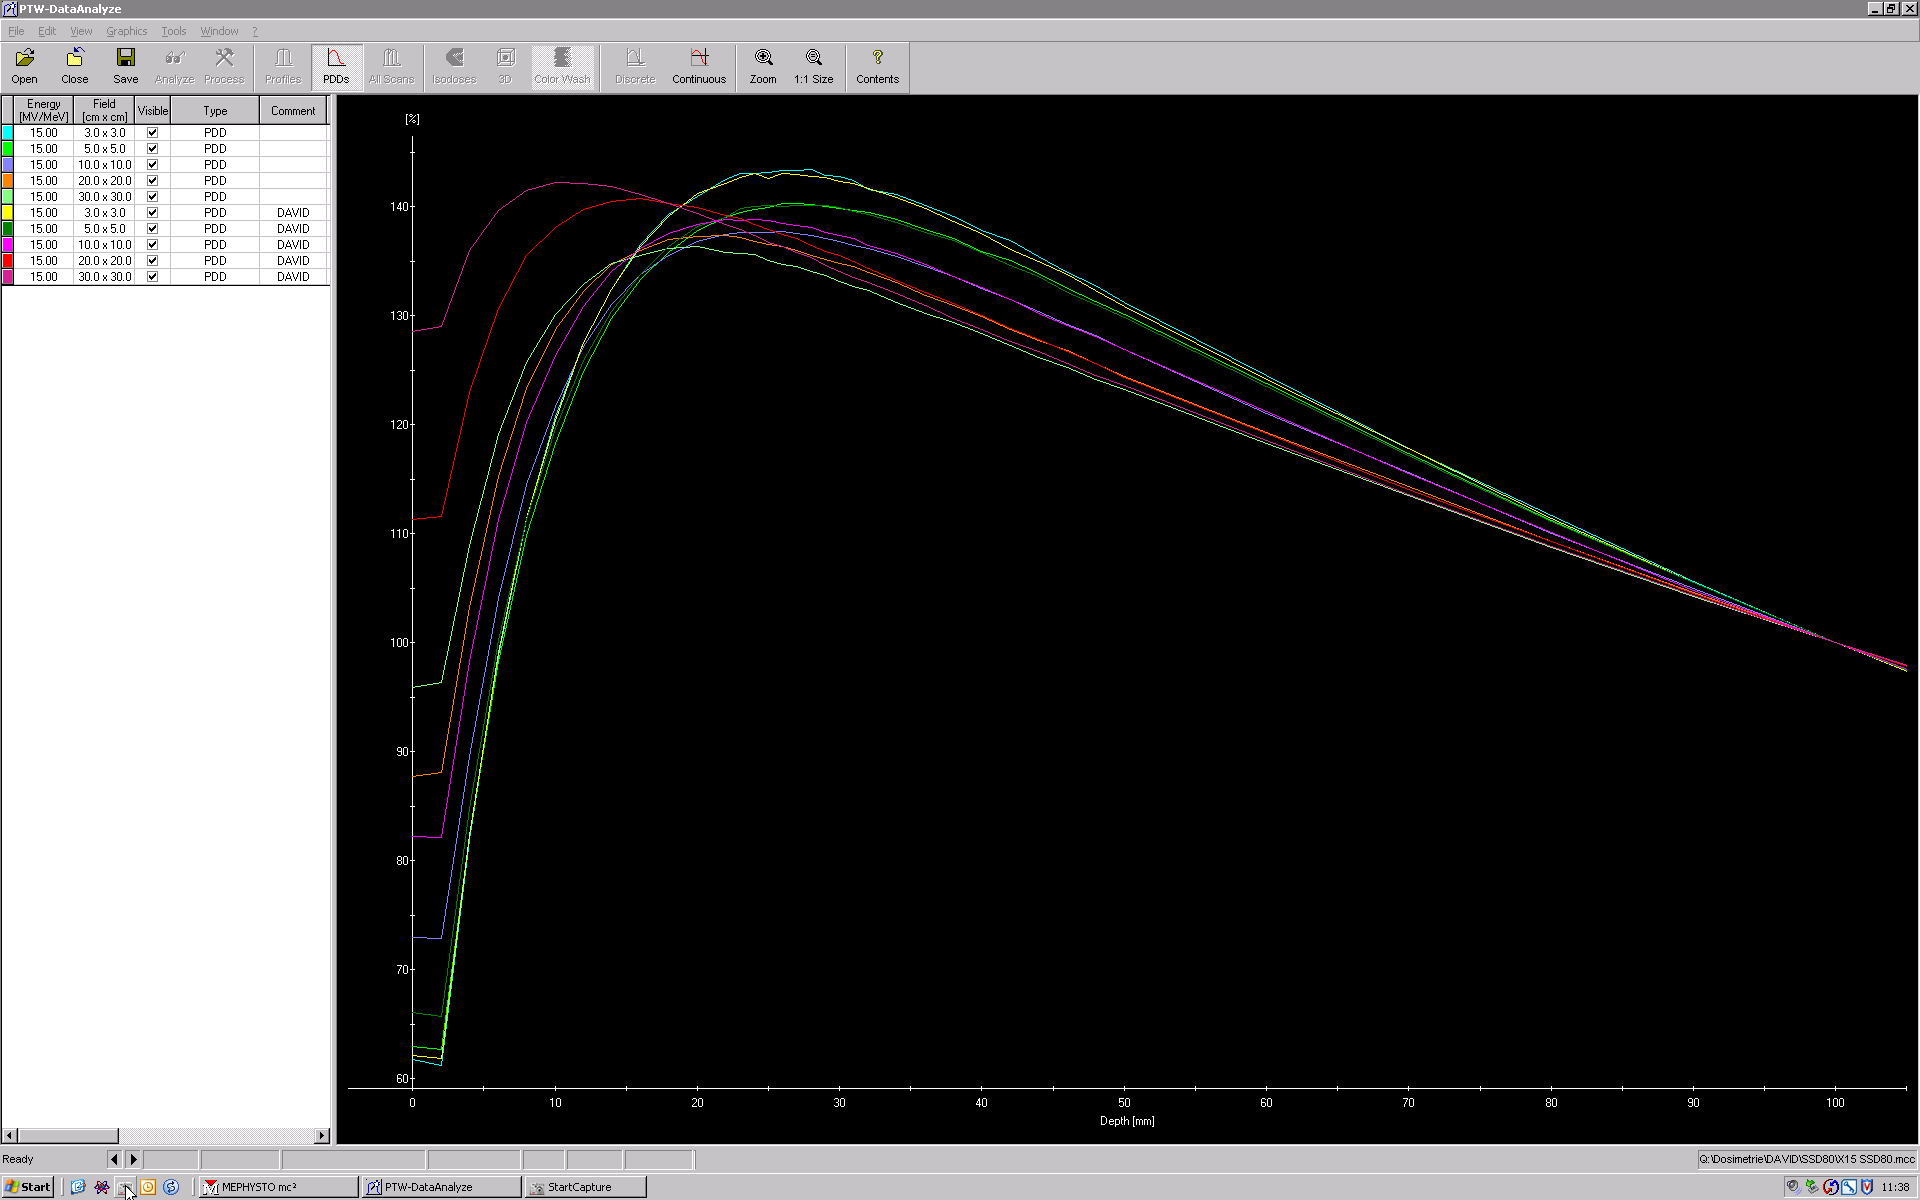
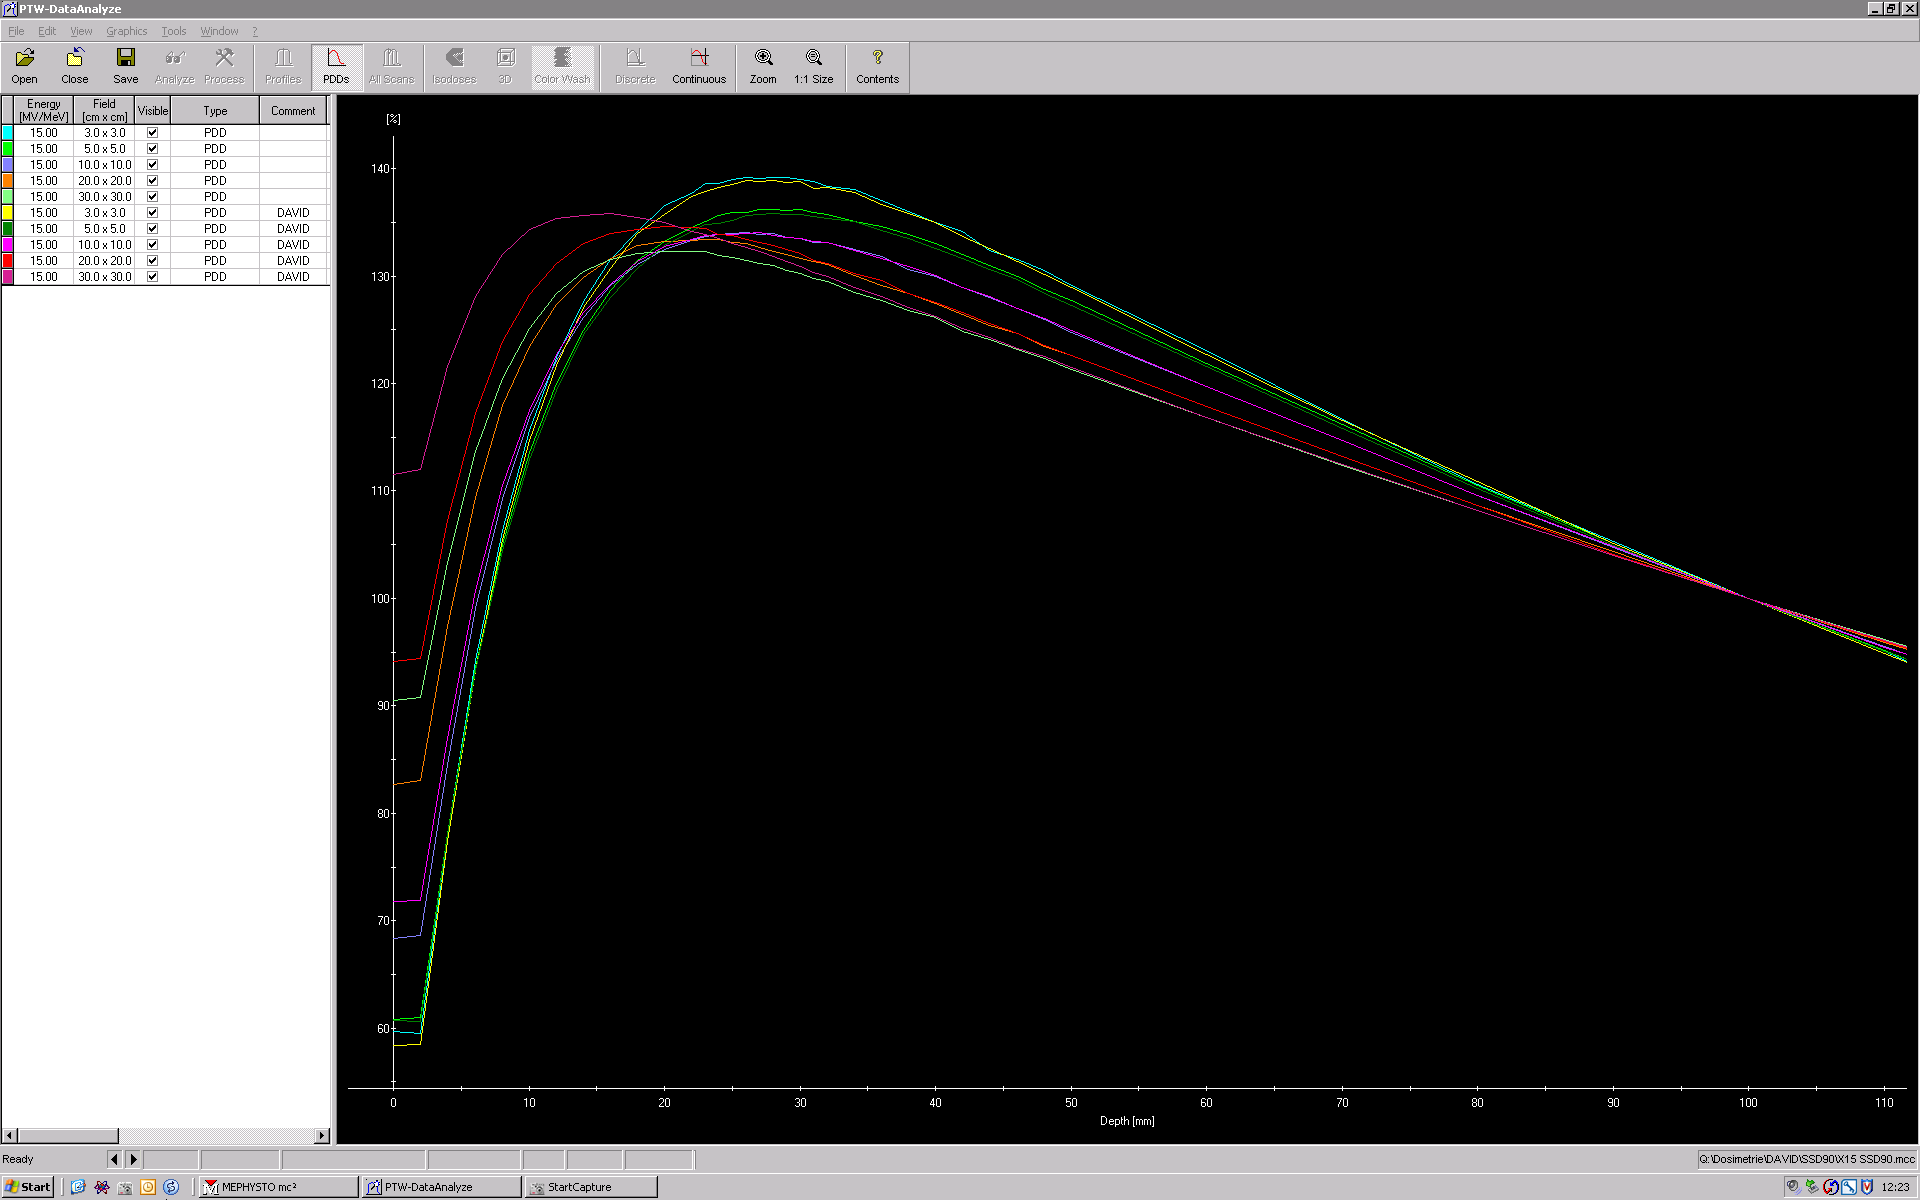
Here are the Mephysto plots of the measured depth dose curves down to about 100 mm for 6MVSSD70, 6MVSSD80, 6MVSSD90, 6MVSSD100. They were evaluated at 2 mm depth:
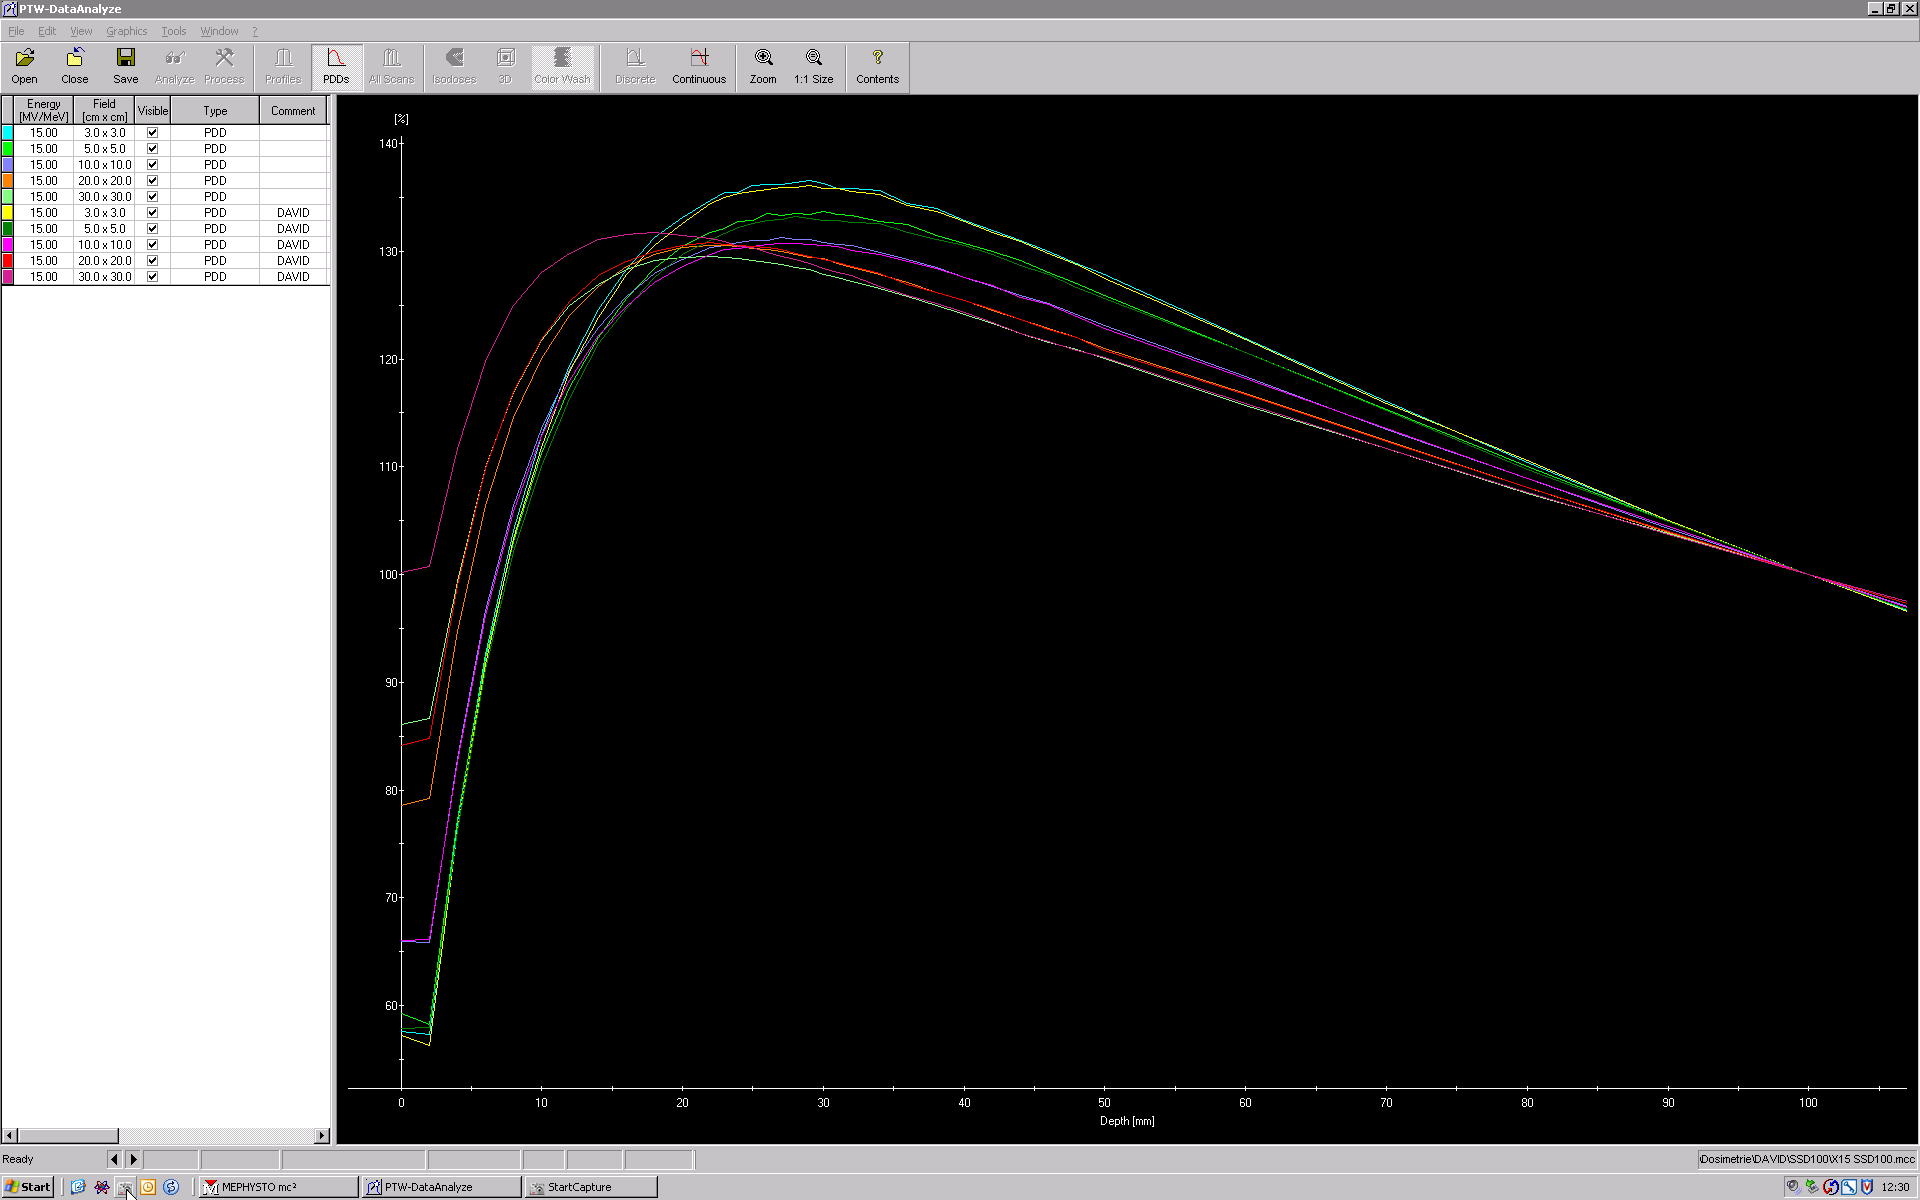
Results for 15MV
Here are the Mephysto plots of the measured depth dose curves down to about 100 mm for 15MVSSD70, 15MVSSD80, 15MVSSD90, 15MVSSD100. They were evaluated at 2 mm depth:
Discussion
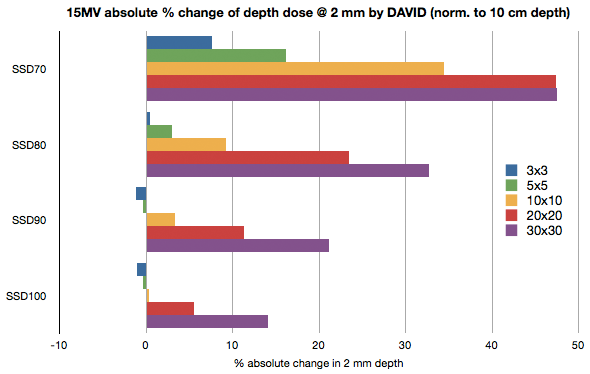
Just like a block tray, DAVID increases skin dose. The effect is stronger with increasing field size and decreasing SSD. For small fields and larger SSDs, there is a small "skin sparing" effect.
One has to take into account that typical IMRT field sizes are NOT 30x30 cm and typical SSDs are NOT 70 cm. By using more beam angles, local skin dose is further reduced in relation to target dose.