DAVID's intended use is the in-vivo verification of IMRT or conformal treatments. The software can handle multiple plans per patient with multiple fields, either step-and-shoot (multiple segments) or sliding window. For testing, we created a simple IMRT plan for each photon energy and treated it several times.
Plan Preparation
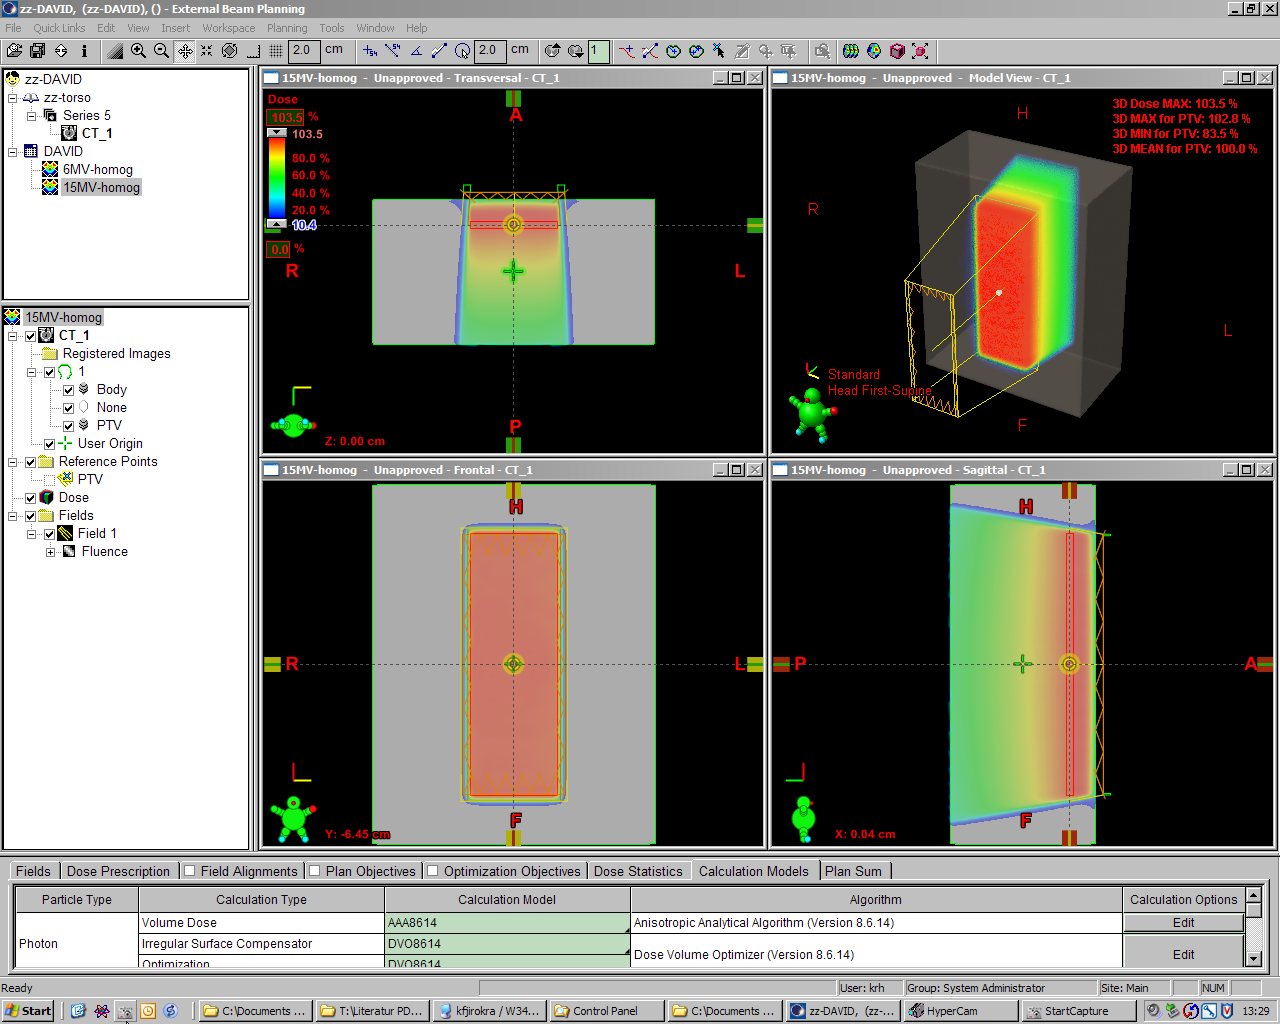
In the Eclipse TPS (version 8.6.14), a planning target volume, 12 cm wide, 36 cm long and 1 cm thick, was placed 3 cm below the surface of a synthetic water phantom. For both energies (6 and 15 MV), IMRT test plans with a single dynamic field were generated. Dose constraints were set to give homogeneous dose inside the PTV (see 15 MV plan).
Eclipse more or less manages to compensate the inherently non-flat beam profile of the linac. When optimization finishes, the resulting fluence in the field center is a little higher:
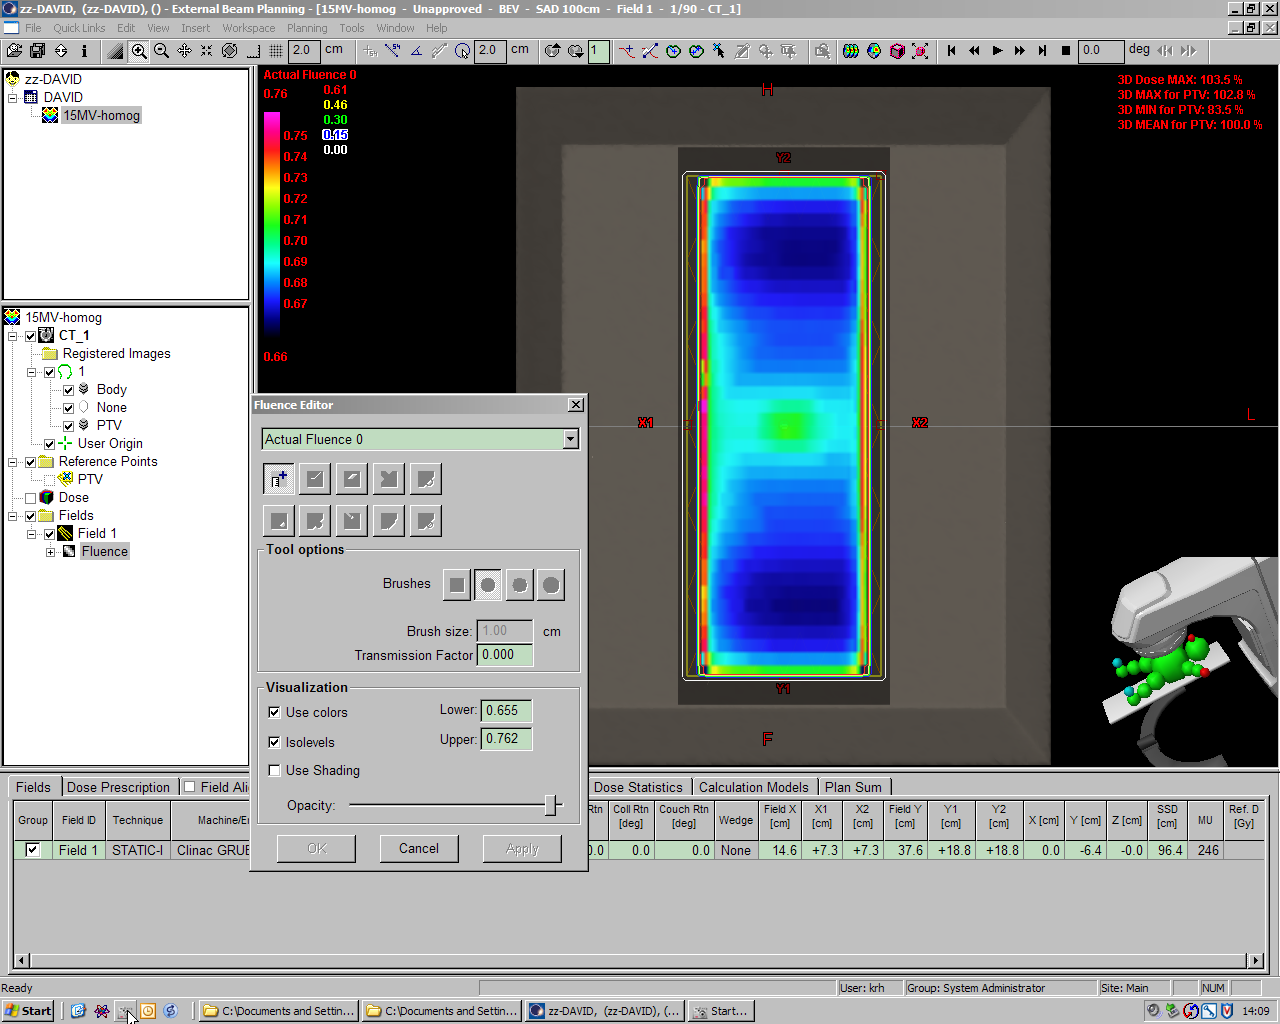
This is accomplished by a sliding window which opens a little more in the center and a little less in the periphery (accelerated animation):
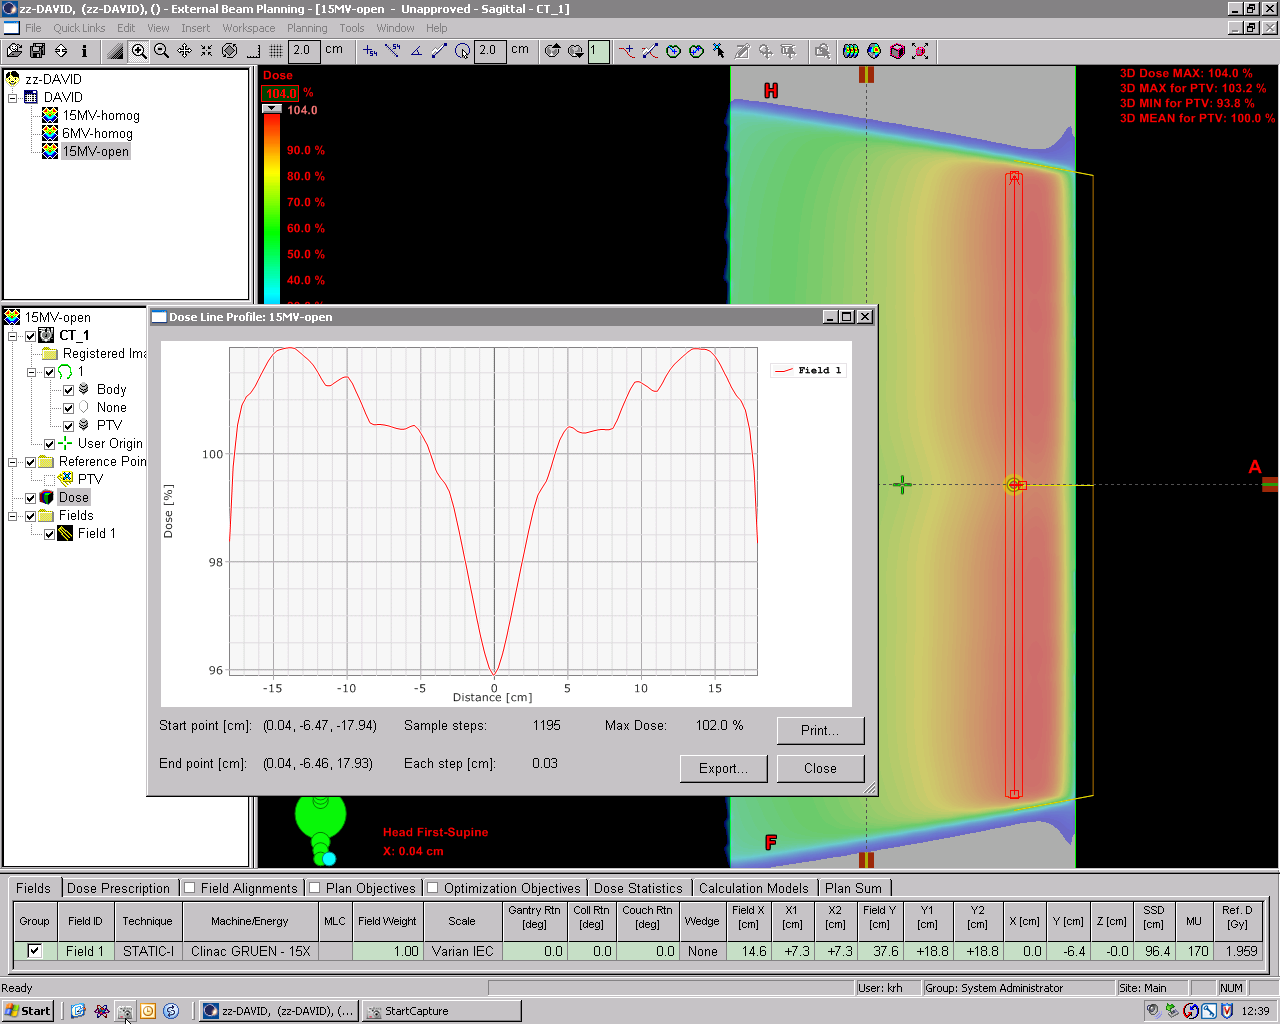
The resulting longitudinal dose profile along the PTV is relatively flat compared to an open beam profile.
This field shall be measured with DAVID!
Measurements
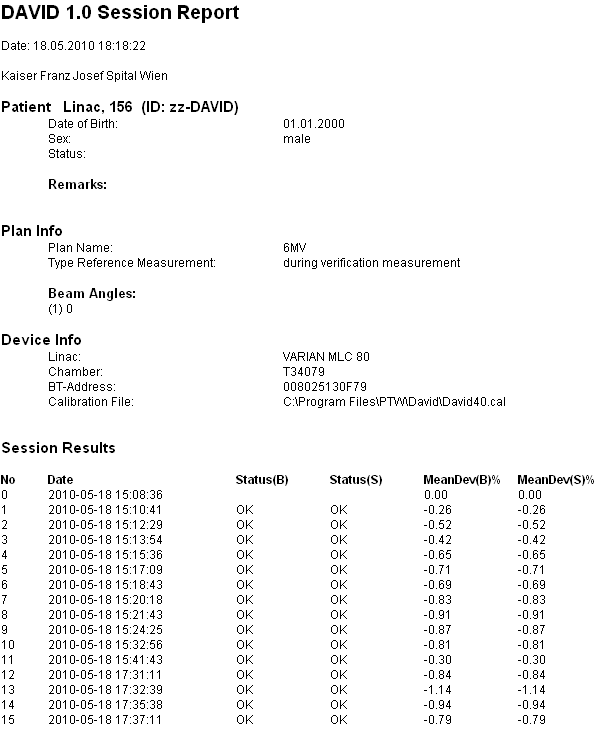
A sequence of 35 measurements (15 with 6 MV and 20 with 15 MV) was started:
- Zero measurement
- Calibration measurement 40x40 cm, 6 MV, 200 MU (2 Gy)
- Reference measurement 6 MV plan, Gantry 0°
- 10 successive measurements of 6 MV plan, Gantry 0°
- Calibration measurement 40x40 cm, 6 MV, 200 MU (2 Gy)
- 1 measurement of 6 MV plan, Gantry 0°
- 2 hours break
- 4 more measurements of 6 MV plan, Gantry 0°
- Zero measurement
- Reference measurement 15 MV plan, Gantry 0°
- 5 successive measurements of 15 MV plan, Gantry 0°
- 5 successive measurements of 15 MV plan, Gantry 270°
- 5 successive measurements of 15 MV plan, Gantry 90°
- MLC Initialisation
- 5 successive measurements of 15 MV plan, Gantry 0°
Notes:
- Since DAVID is used as constancy check device, the exact dose the user states during calibration is rather irrelevant. But it should be the same dose every day (calibrations are necessary on a daily basis). If linac output variations are known, this information can of course be incorporated.
- Dose rate setting of the linac (e.g., 300 or 600 MU/min) should be the same for calibration, reference and plan measurements.
- Short beam hold-offs on the Varian linac may cause a preamature measurement stop. DAVID will think the field is finished. The length of the interruption is crucial (in the DAVID ini file, a certain tolerance can be set). Therefore it is best if all leaf motors are in good condition.
A typical DAVID screen during the measurement:
After a patient plan has been treated several times and measured with DAVID, the user may print out a final report. The mean deviations from reference, as taken from the session reports for the 6 MV and 15 MV test plans described above, are displayed in the following graph. The graph shows from top to bottom the sequence of the 35 measurements (calibration and reference measurements are omitted). Changes in setup are documented on the left.
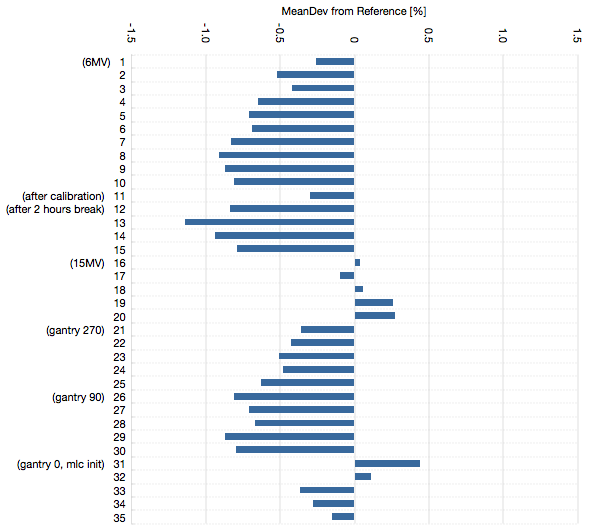
The values are the mean deviations for all leaf pairs. The following animations show the individual channels in a loop over the measurements. The reference measurement comes always first, it has white bars:
6 MV (measurement 1 to 15):
15 MV (measurement 16 to 35):

Discussion
The drift in the first 8 measurements was confirmed in a separate measurement sequence (without any involvment of MLC or Gantry). The results indicate that it takes longer for DAVID to stablilize than the 5 minutes specified in the operating manual. The result can be a dose deviation in the central region of up to 2% which comes from DAVID, and not from the linac.
As long as DAVID itself is not fully stable over time (on the <1% level), nothing can be said about potential DMLC- or gravity effects which have their origin in the linac and which (on Varian linacs) are expected to be very small anyway. In order to detect them, a very sensitive, accurate and stable measuring system must be available.
This does not mean that DAVID is not a good DMLC-QA device (it's intended use). If it is properly warmed up and has stabilized, it should work satisfactorily.