How to remove hotspots outside the PTV
When VMAT plans are optimized and the final 3D dose distribution is calculated, it is sometimes observed that the Global Dose Maximum of the calculated plan is located outside the target structure or PTV. In the following example, we first observe that the "3D Dose MAX" (yellow arrow) is higher than the "3D MAX for PTV PRO" (green arrow). In Eclipse1, these numbers are printed in red in the upper right corner of Model View:
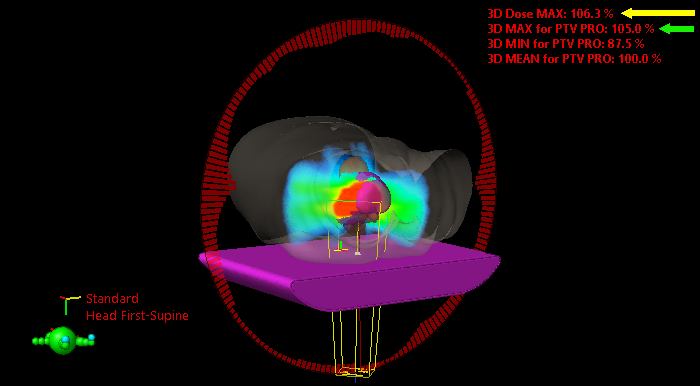
For now, let's assume that this is unacceptable and we want to change it. We want to make sure that the numbers are equal, in other words, that the global dose maximum is located inside the PTV.
We are not interested in increasing the homogeneity of the dose distribution, or to reduce the maximum, e.g. from 108% to 106%2. There are various ways of doing this, like switching from one to two arcs or choosing different objectives during optimization. Here, we are only interested in shifting the 3D dose max into the target.
Avoidance and Removal Strategies
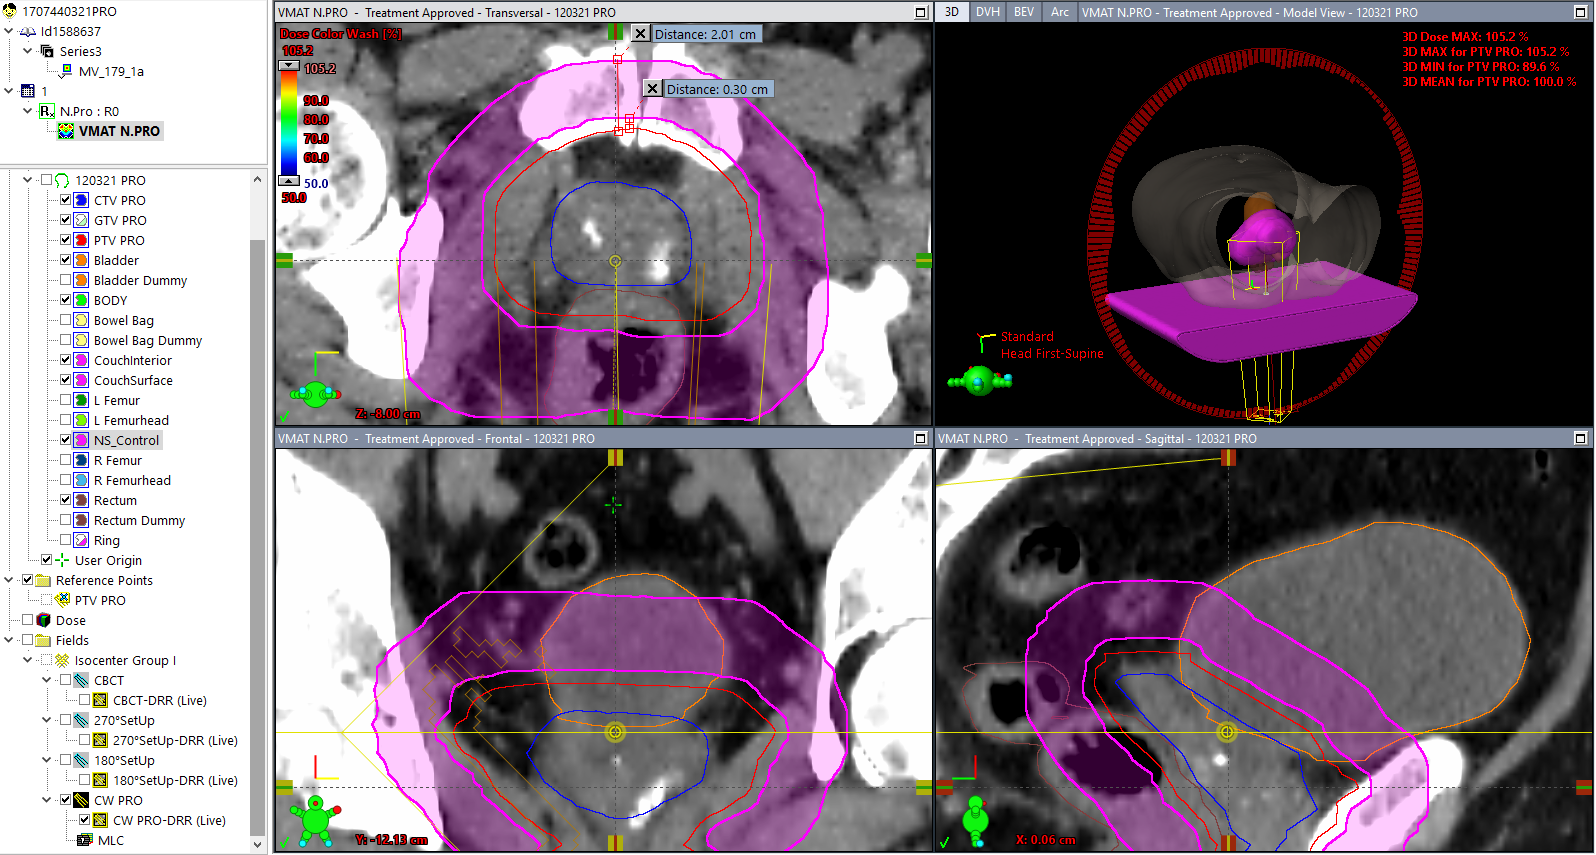
A popular avoidance strategy is to create a ring-like helper structure ("NS_Control", "Ring") which surrounds the target:
These rings are chosen with an initial wall thickness of e.g. 2 cm, and are then cropped with an additional margin of 3 mm outside the target. The ring has to be created in Contouring workspace before VMAT optimization is started, so it is not known a priori whether it will be "needed" later on.
It is a matter of experience and personal taste how to make use of the ring structure during optimization. Some of us observe the ring's DVH during the Photon Optimizer's first optimization level (MR Level 1) only, and if the ring's dose maximum exceeds the target planned dose by more than 2 Gy, they intervene by adding upper objectives to the ring.
Rings can suppress hotspots right from the beginning, during the first optimization run. We may therefore call this an avoidance strategy.
Removal strategies on the other hand wait until hotspots occur, and then try to remove them.
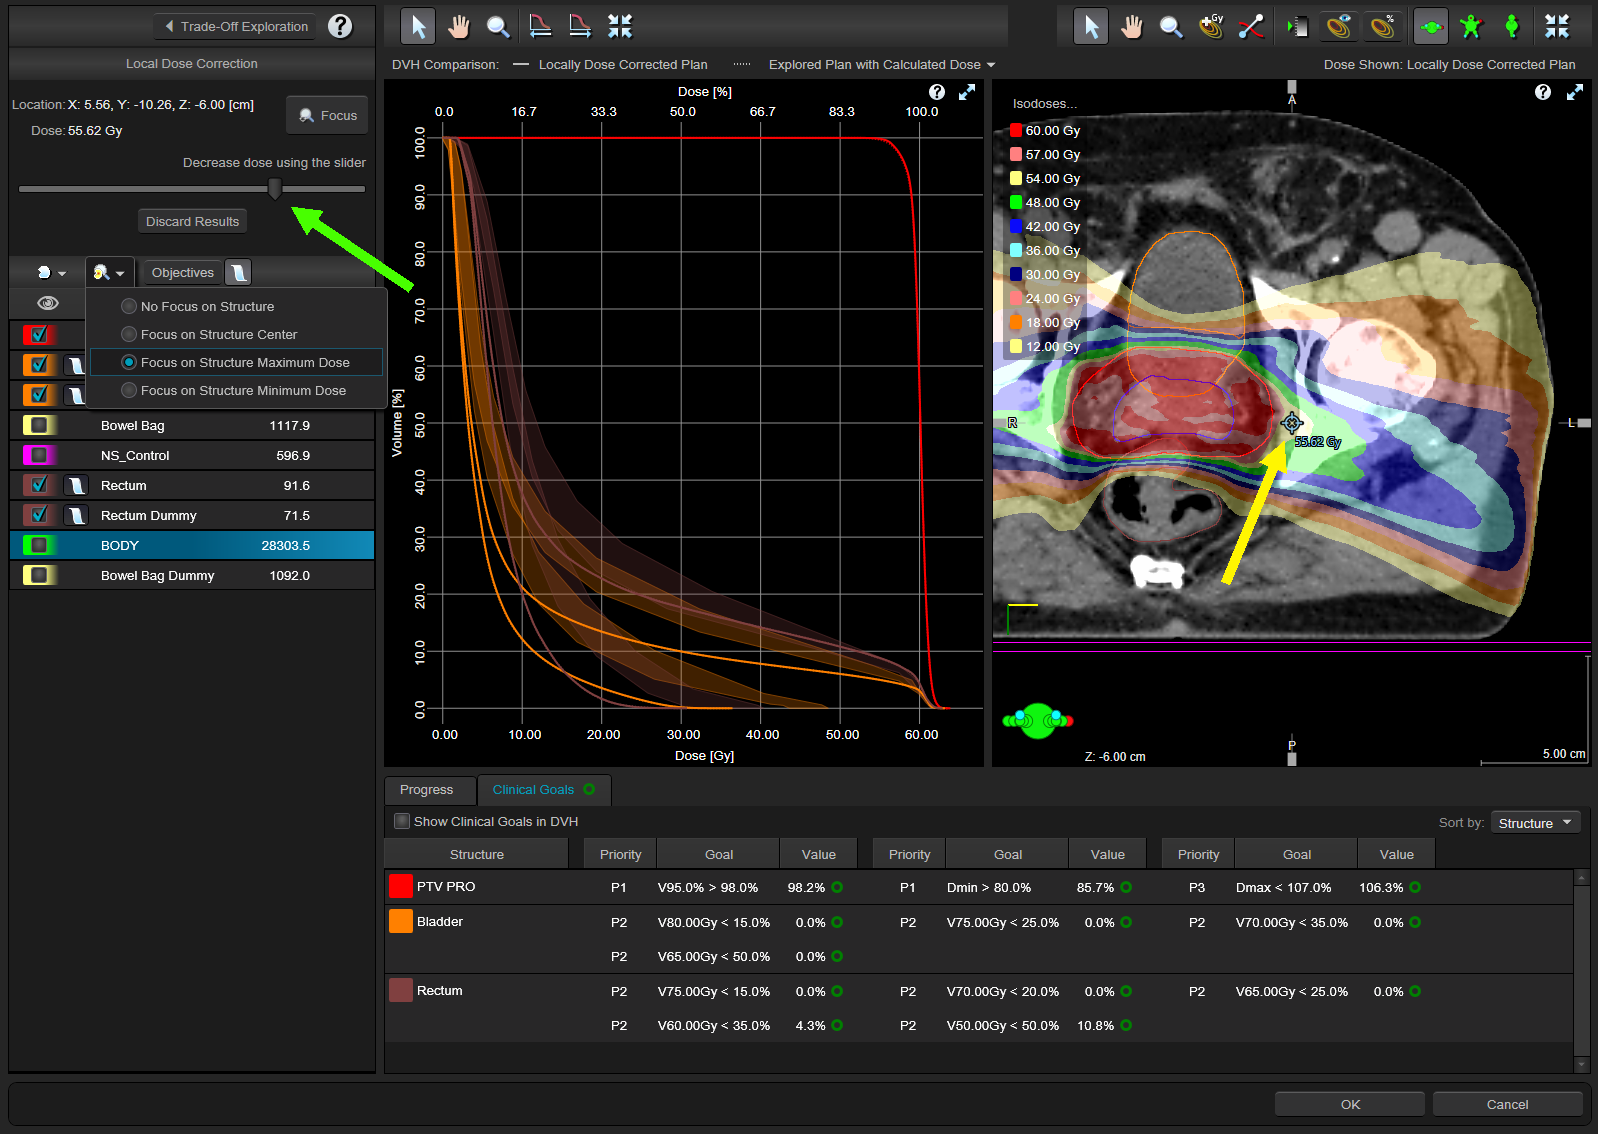
An elegant new method will be mentioned first, and only briefly. In Trade-off exploration, an internal "VMAT plan collection" is created first. The user can then navigate inside this "plan continuum" by moving sliders interactively and exploring the trade-off between target goals and organ at risk goals. DVH curves and clinical goal numbers change continuously. If the user is satisfied with the outcome, he hits the OK button, which creates a deliverable (VMAT) plan:

In previous versions of Trade-off exploration, it was not possible to correct hotspots in the deliverable plan without losing the Trade-Off Plan Collection. This has been improved in version 16.1, where an elegant way of correcting local dose was added. After the hotspot has been located by selecting BODY > "Focus on Structure Maximum Dose" (the yellow arrow points to the location where the hotspot once was), a slider (green arrow) is used to reduce local dose 4:
Here we want to present another method of removing hotspots. It has demonstrated its effectiveness in hundreds of plans.
The Method
The first step is to locate the 3D Dose MAX, by right-clicking on the Dose icon, and choosing Move Viewing Planes to > Global Dose Maximum:
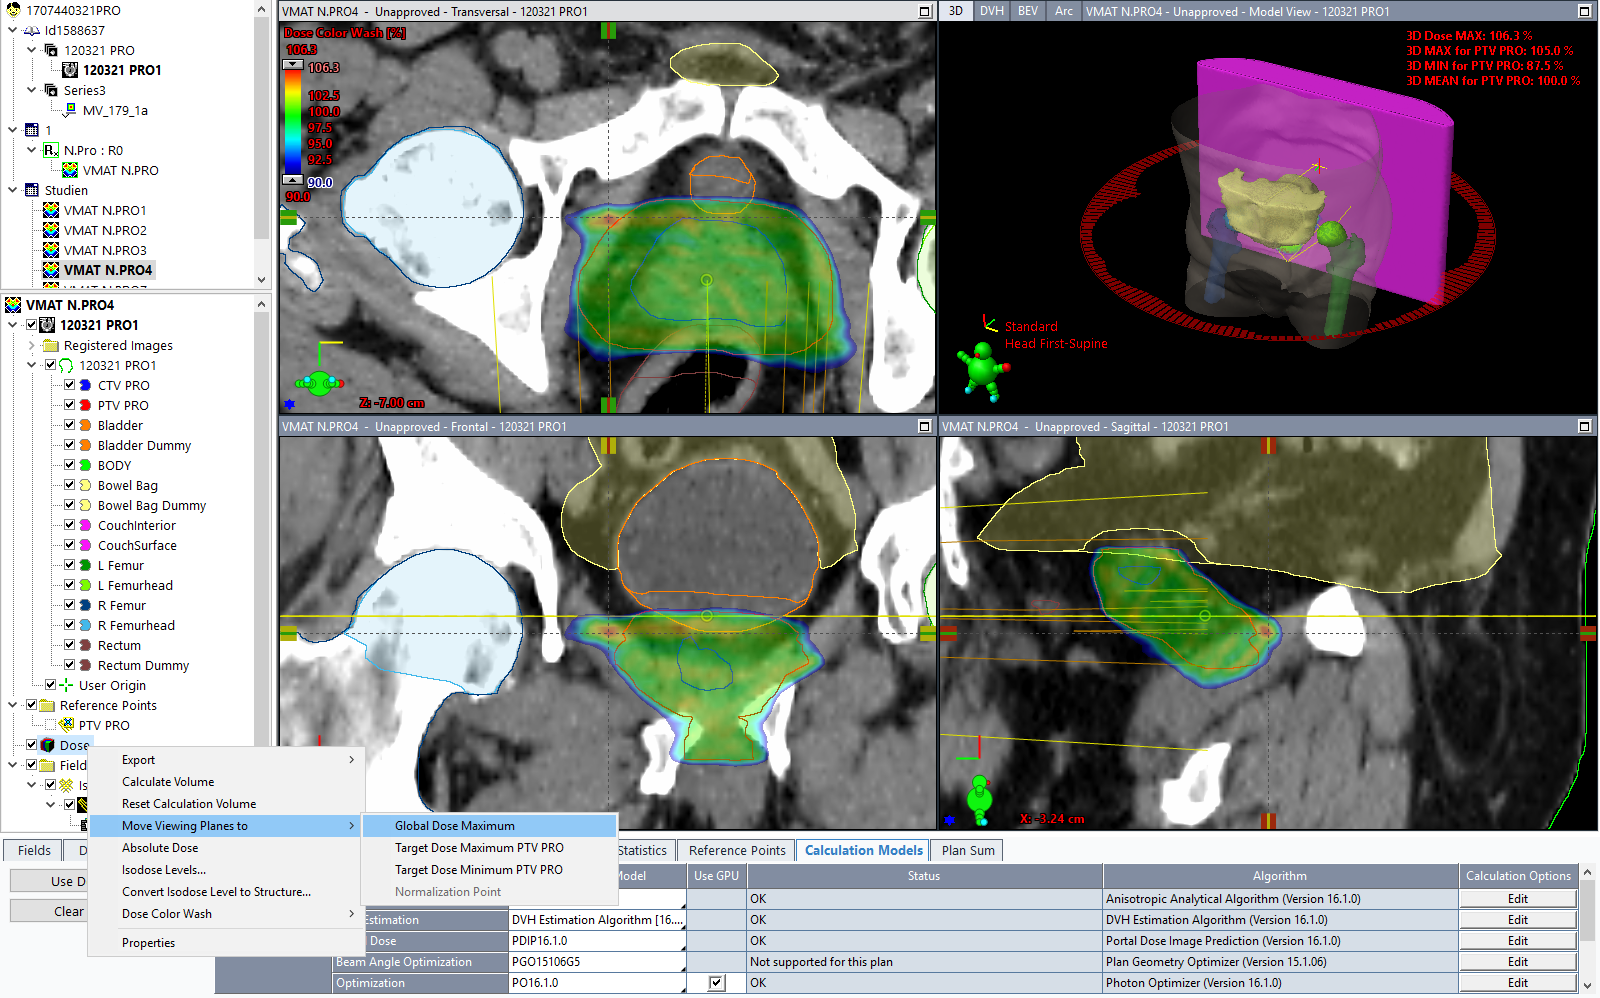
The viewing planes intersect at Z = -7 cm, at a point about 3 mm outside the target border3. There is no need to measure the exact distance. It is sufficient to see that the hotspot is rather close to the target surface.
One potential way to proceed would be to record the three coordinates of the hotspot, switch to contouring (dose distribution is not visible there!), and fill a new empty helper structure with a small blob by using the brush at the location of the hotspot. This is rather cumbersome, so we won't do this.
Instead, we right-click on the Dose icon and select "Convert Isodose Level to Structure".
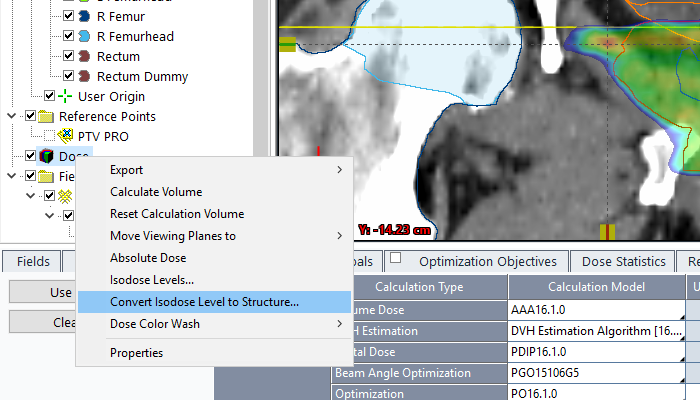
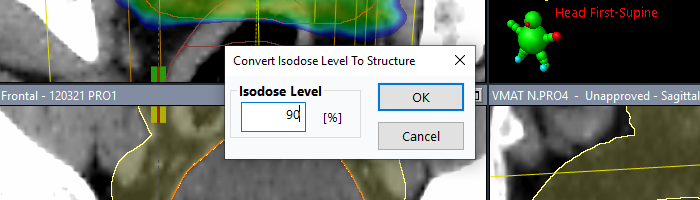
The next step depends on whether we currently display dose in [%] or in [Gy]. If we display relative dose, the system will ask for the Isodose Level in [%]. We choose 90%:
The newly created structure will get the ID "Dose 90[%]", the Volume Type "Control" and Color Magenta5. We do not need to change anything, so we click OK:
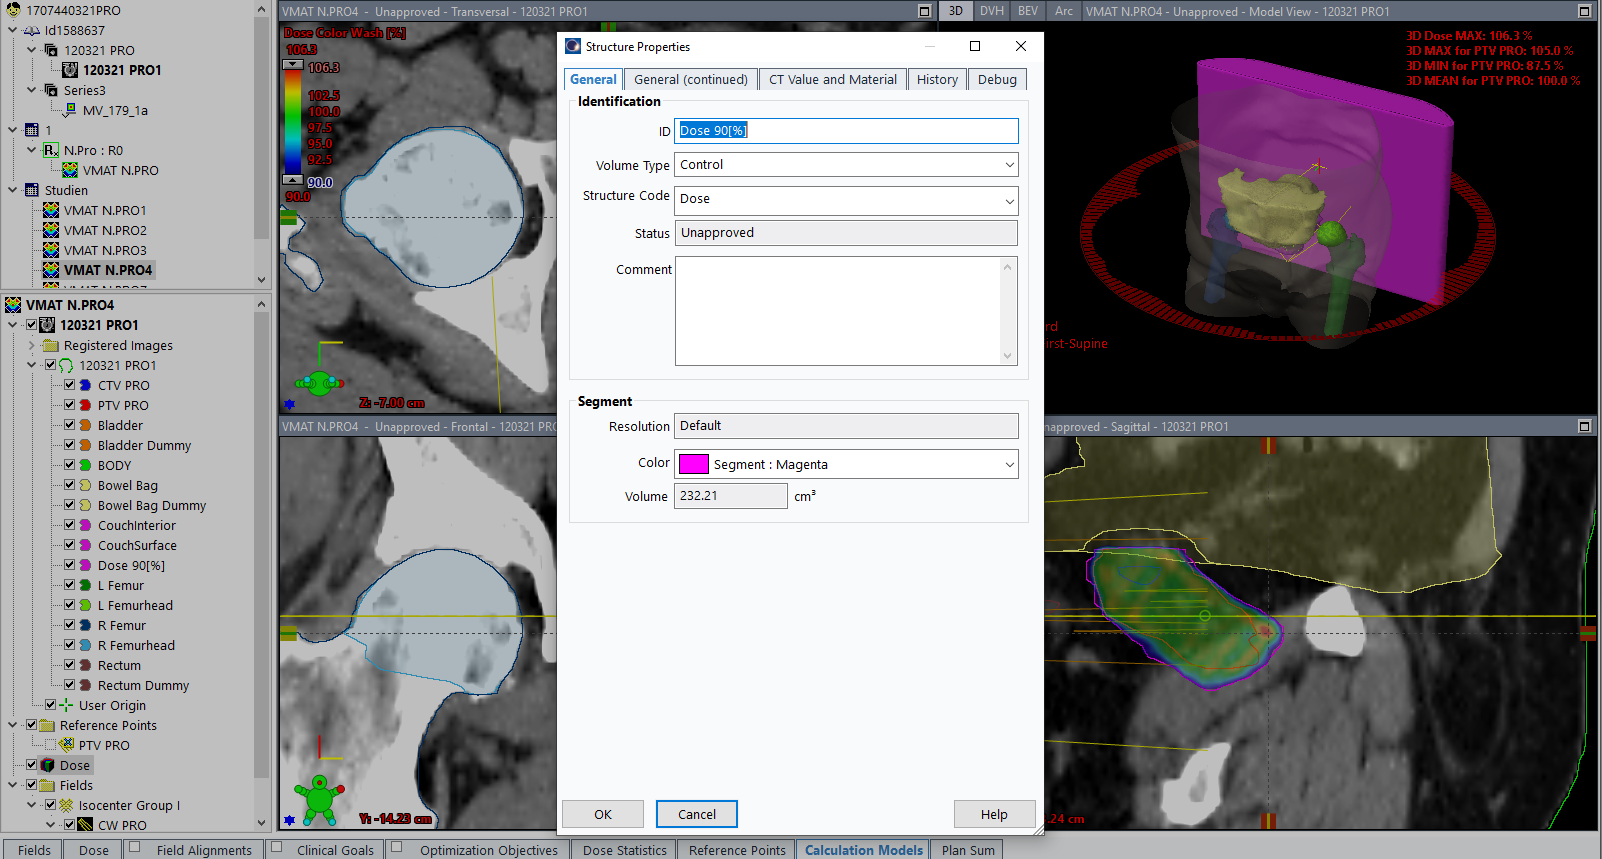
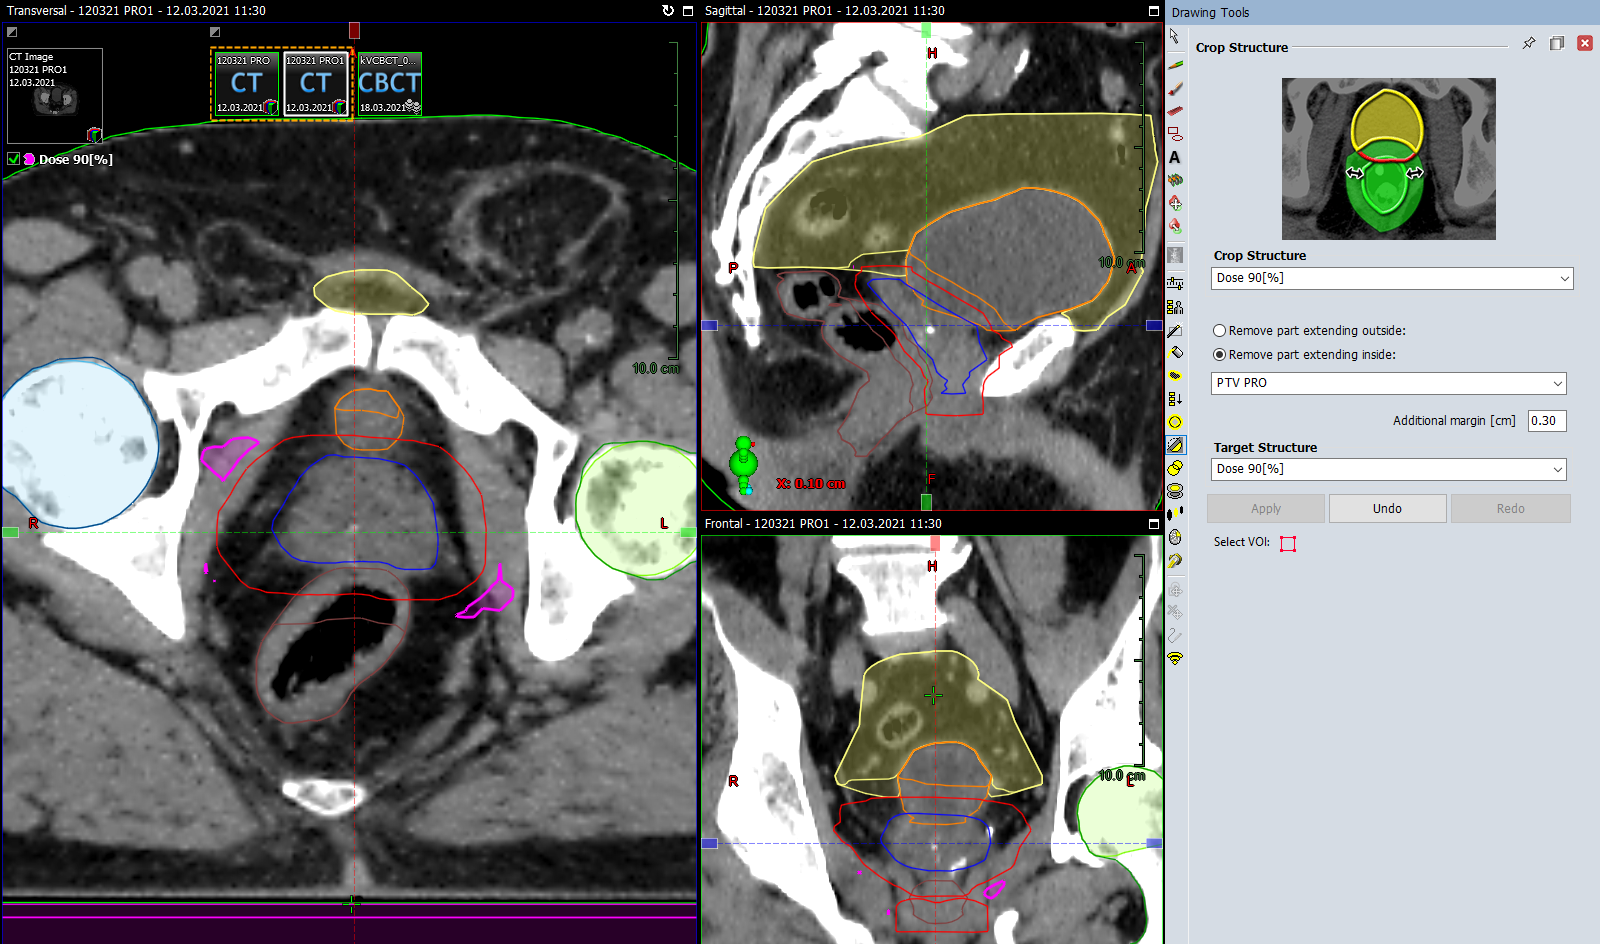
We now switch to Contouring workspace and display the Dose 90[%] structure. The yellow arrow points to the approximate hotspot location:

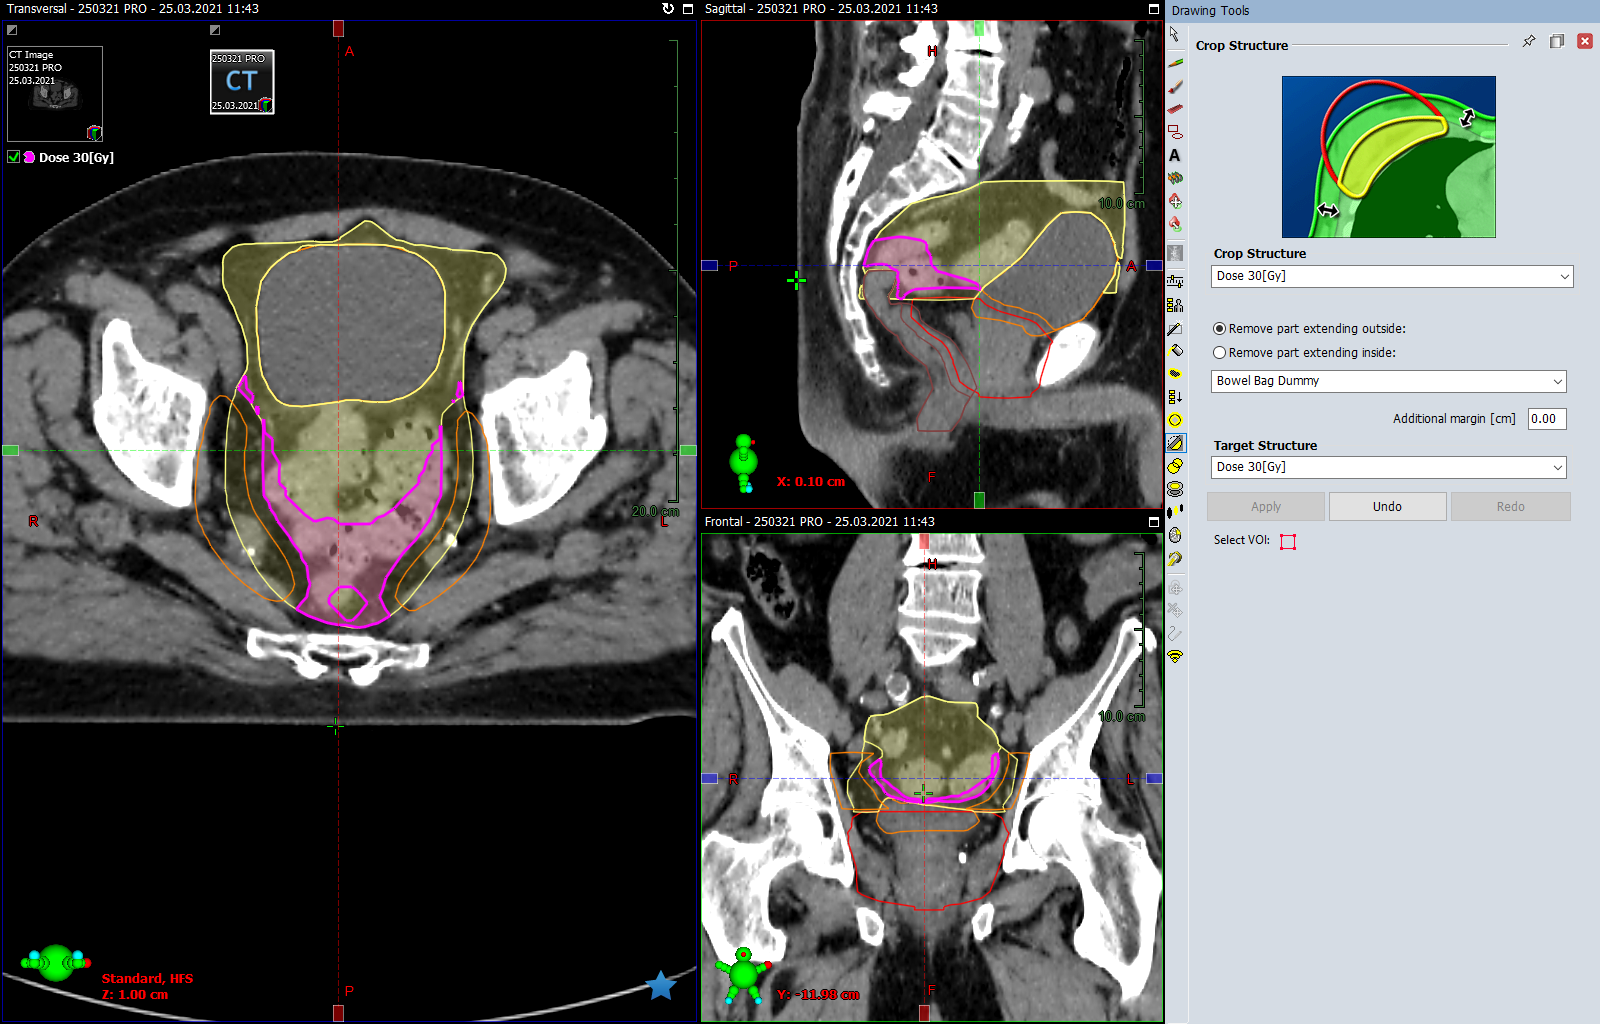
We now use the Crop Structure tool and select Dose 90[%] for both the Crop Structure and the Target Structure. We choose to "Remove part extending inside: PTV PRO" with an additional margin of 3 mm6:
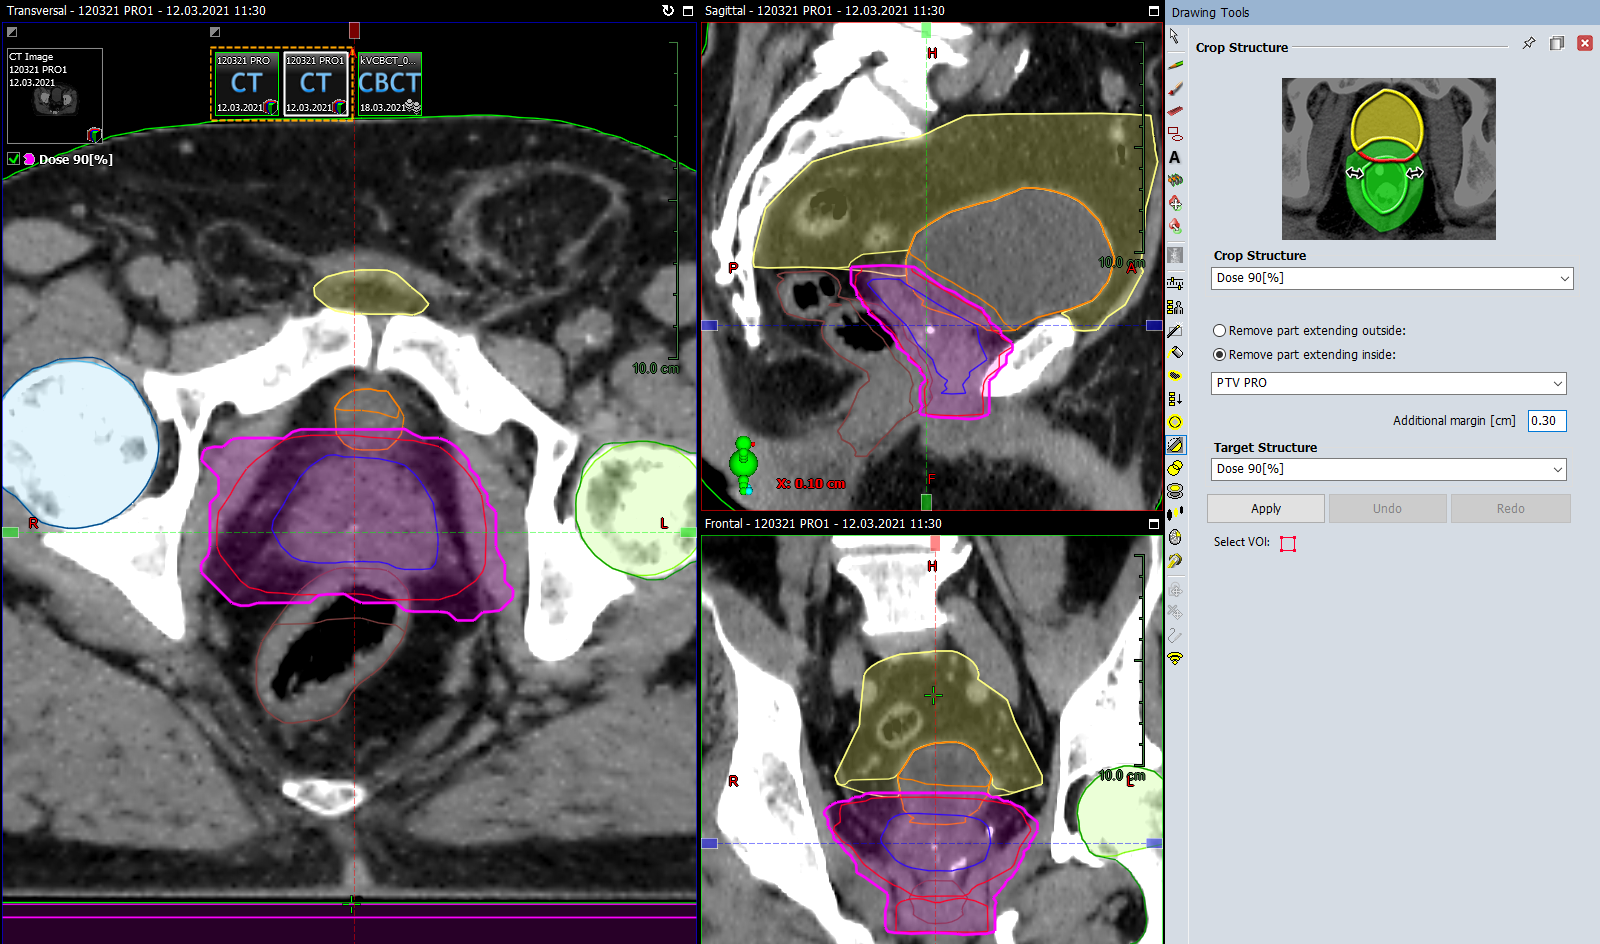
This way, the PTV is cropped from the "Dose" structure with an additional margin, so that any upper dose objective added to the "Dose" structure in Optimization will not interfere too much with the PTV objectives. The result is an irregular structure where the outer border is still originating from the 90% isodose. The dose level which corresponds to the inner border is not known, because this depends on dose homogeneity inside the PTV. However, the structure is thicker where dose spills out of the PTV, which is exactly what we want. We save the changes:
We now switch back to External Beam Planning. In order for the method to work, it is essential to continue optimization of the same plan, and not start something completely different!
We make a copy of the plan and select F7 to open the Optimization window. The "Dose 90[%]" structure is now displayed together with it's DVH in Magenta. We add an upper dose objective at 0% volume (yellow arrow) and 90% dose, just where the structure's DVH kinks down (green arrow). We set the Priority of this objective to 100% (the PTV PRO has 130%):
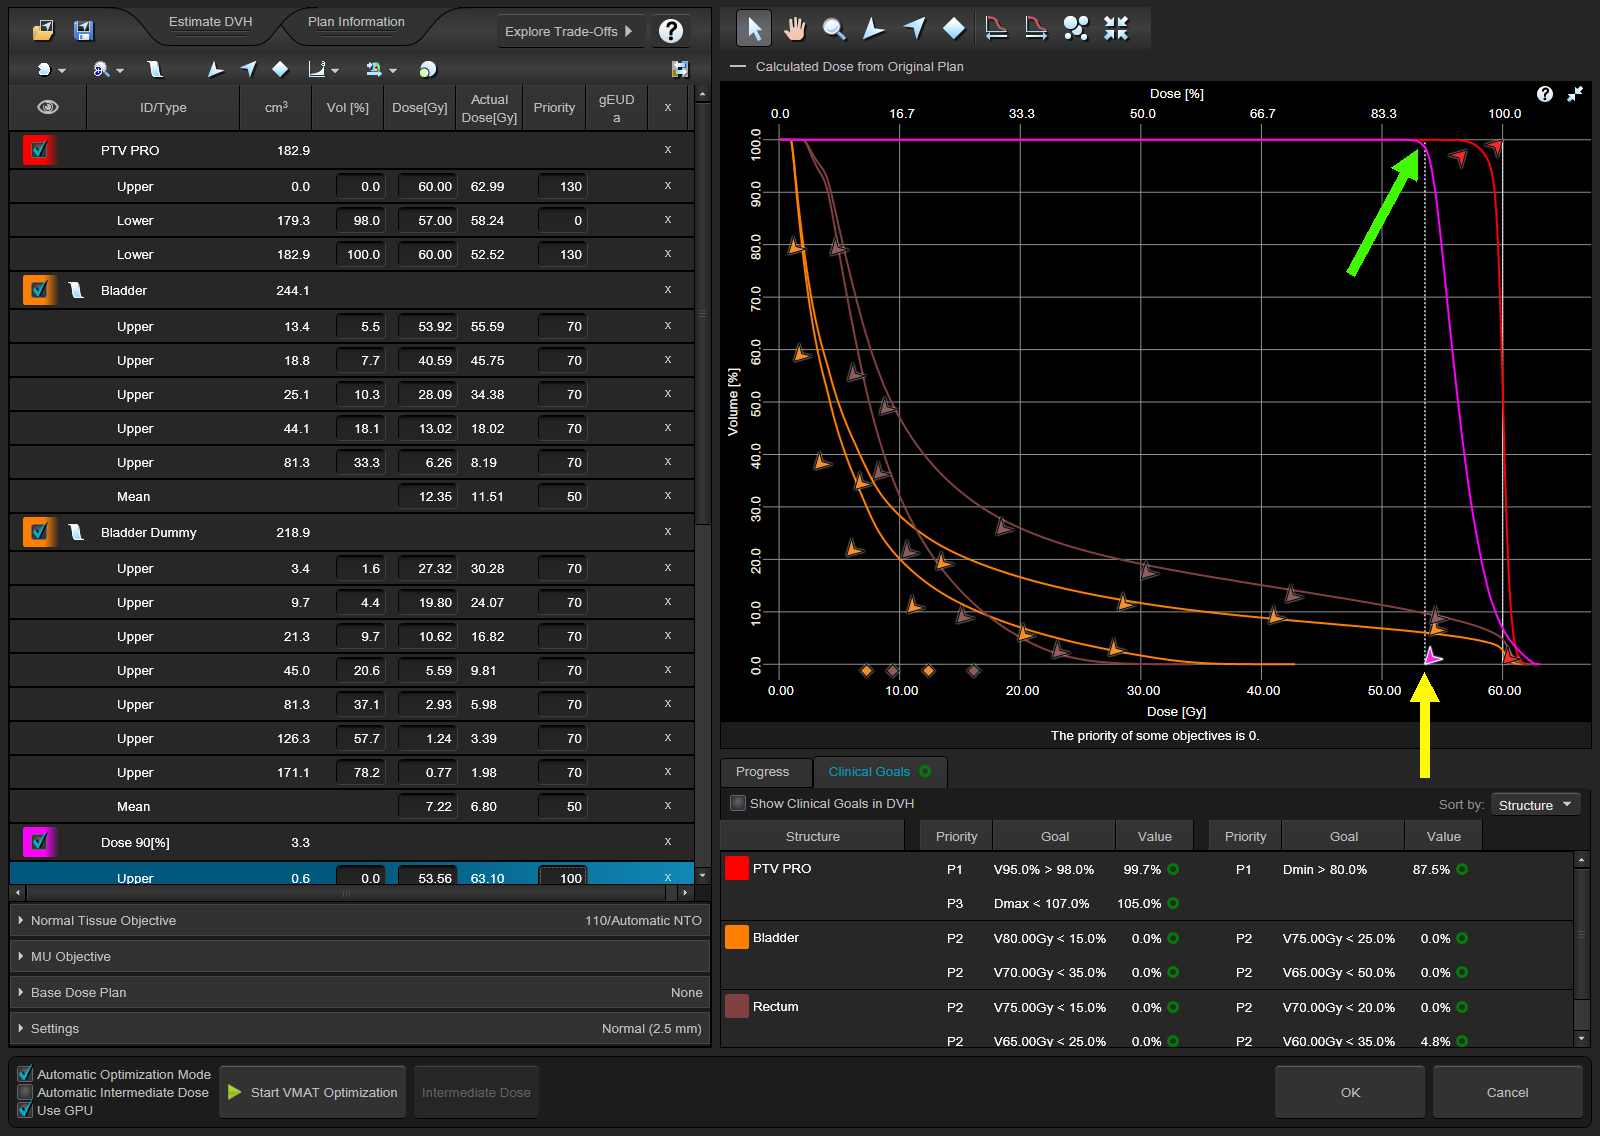
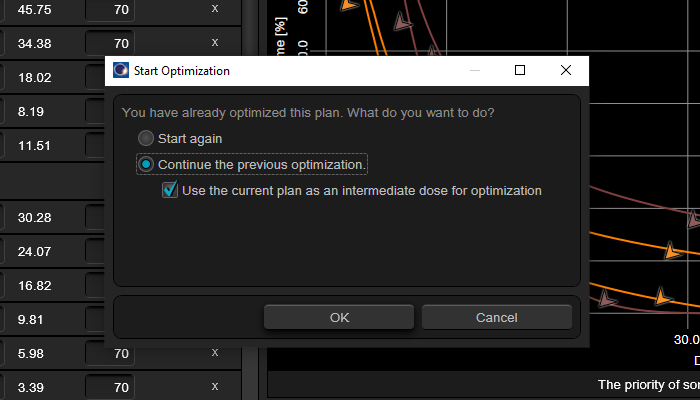
It is up to the user to adjust the objectives of other structures. We hit the big "Start VMAT Optimization" button (and don't forget to "Continue the previous optimization"):
We usually restart at MR Level 3. The DVH of the "Dose" structure drops immediately (yellow arrow):

Generally, when continuing a previous optimization is good practice to go on HOLD immediatly, look through the "Cost" values of all objectives, make small adjustments if necessary, and then release the brake. One has to be very fast, especially when a GPU is present!
The result of the final dose calculation is impressing: not only is the 3D Dose MAX now inside the PTV, but the maximum has also dropped in absolute terms, from 106.3% to 104.1%:
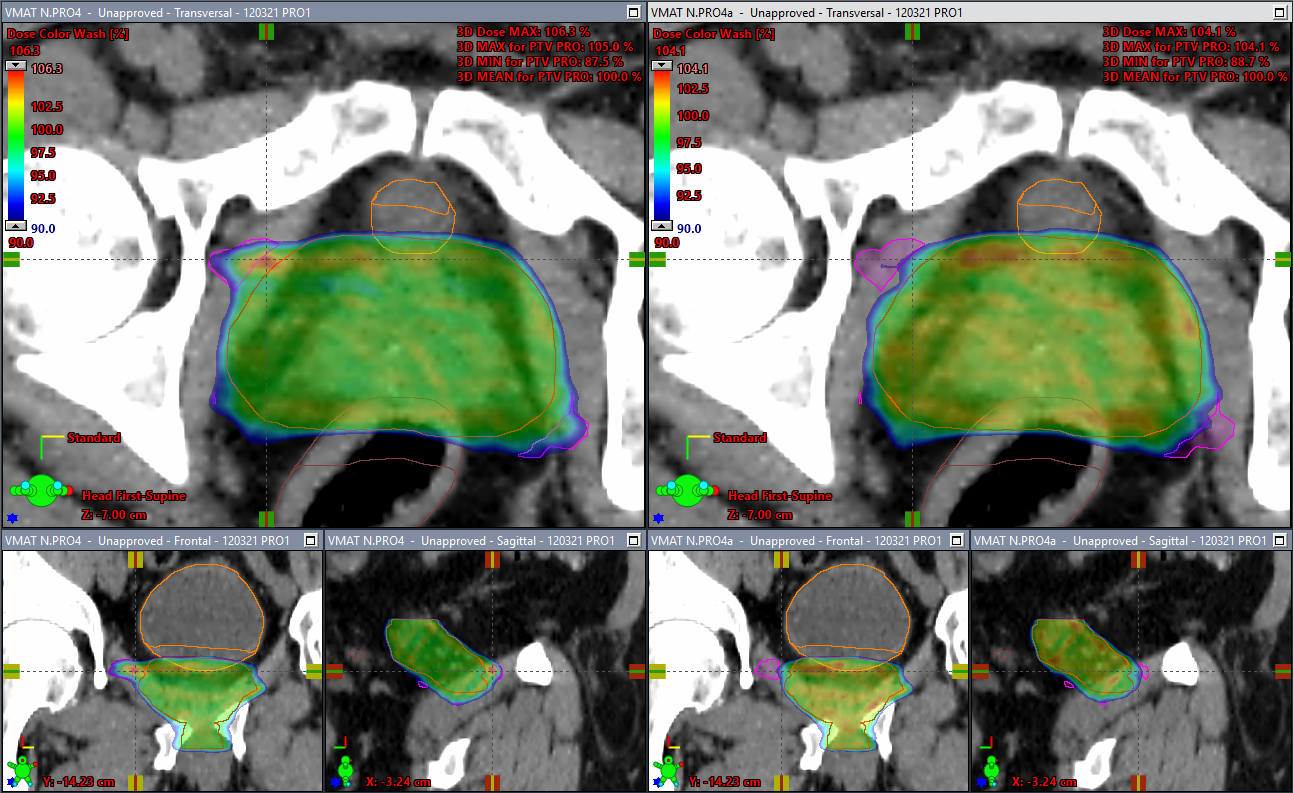
Plan comparison: Starting plan (left), continued plan (right)
At this point, we would normally delete the "Dose 90[%]" structure, because it is neither needed, nor "valid" anymore: The 90% isodose of the actual (continued) plan will be different from that of the starting plan. In the above image, it is still present for demonstration purposes. The volume where the hotspot originally was is now nearly empty.
Other Regions
Of course the method is not limited to prostate. Another region where it is very effective is head and neck. If both the Oral Cavity and the Parotid(s) have to be spared, one sometimes observes hotspots right between the two:
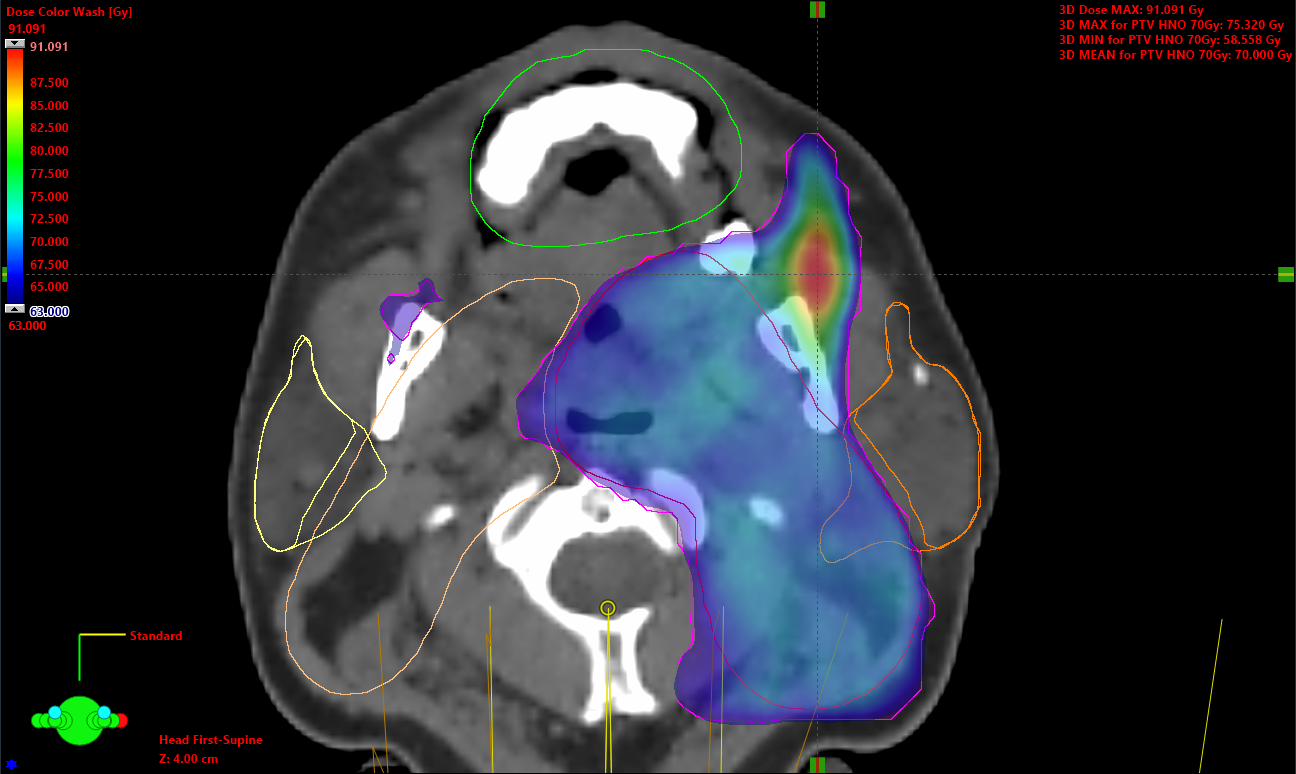
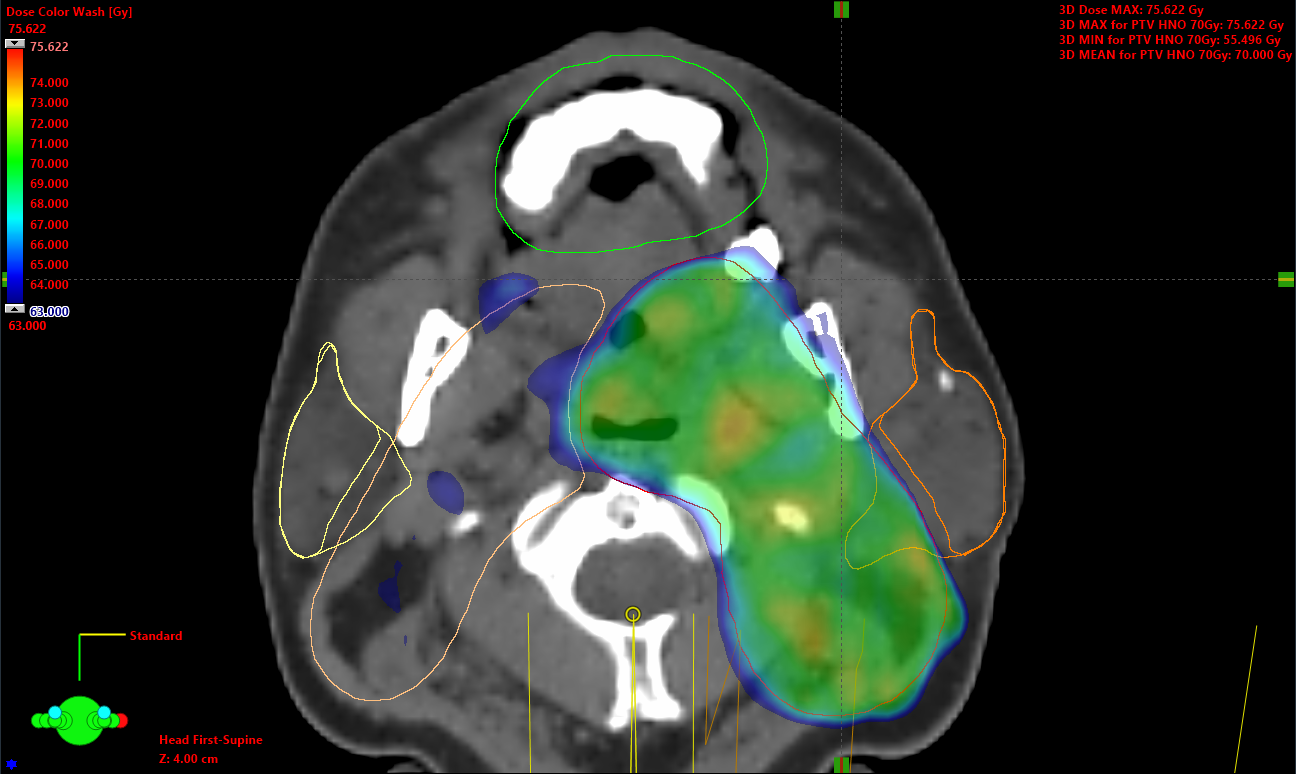
If the PTVs are surrounded by many OARs, it is hard for the optimizer to deposit the desired target dose, because many beamlets are "blocked" in the sense that they would have to go through an organ at risk to reach the target. However, even in these cases (the hotspot in the example has 130% of target dose), the method works very well:
The described method of removing hotspots outside the PTV(s) is very flexible. One can work with "Dose [Gy]" structures instead of "Dose [%]", different percentage levels and use different cropping margins. "Dose [Gy]" structures and "Dose [%]" structures can exist at the same time and be used in the same optimization.
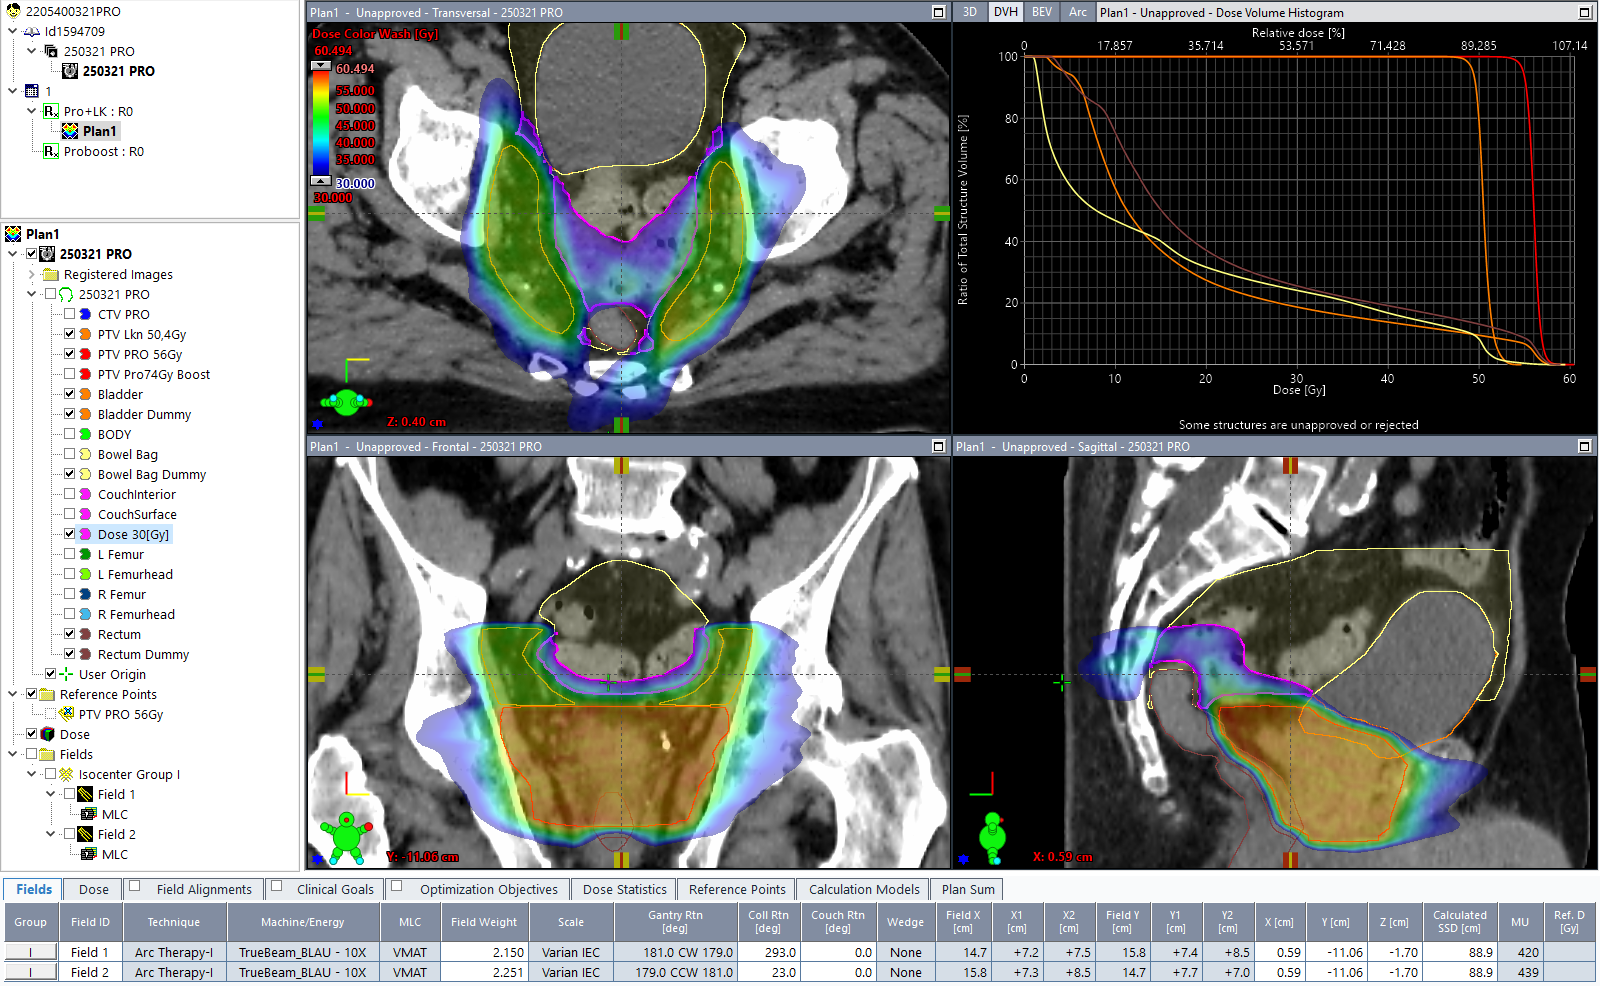
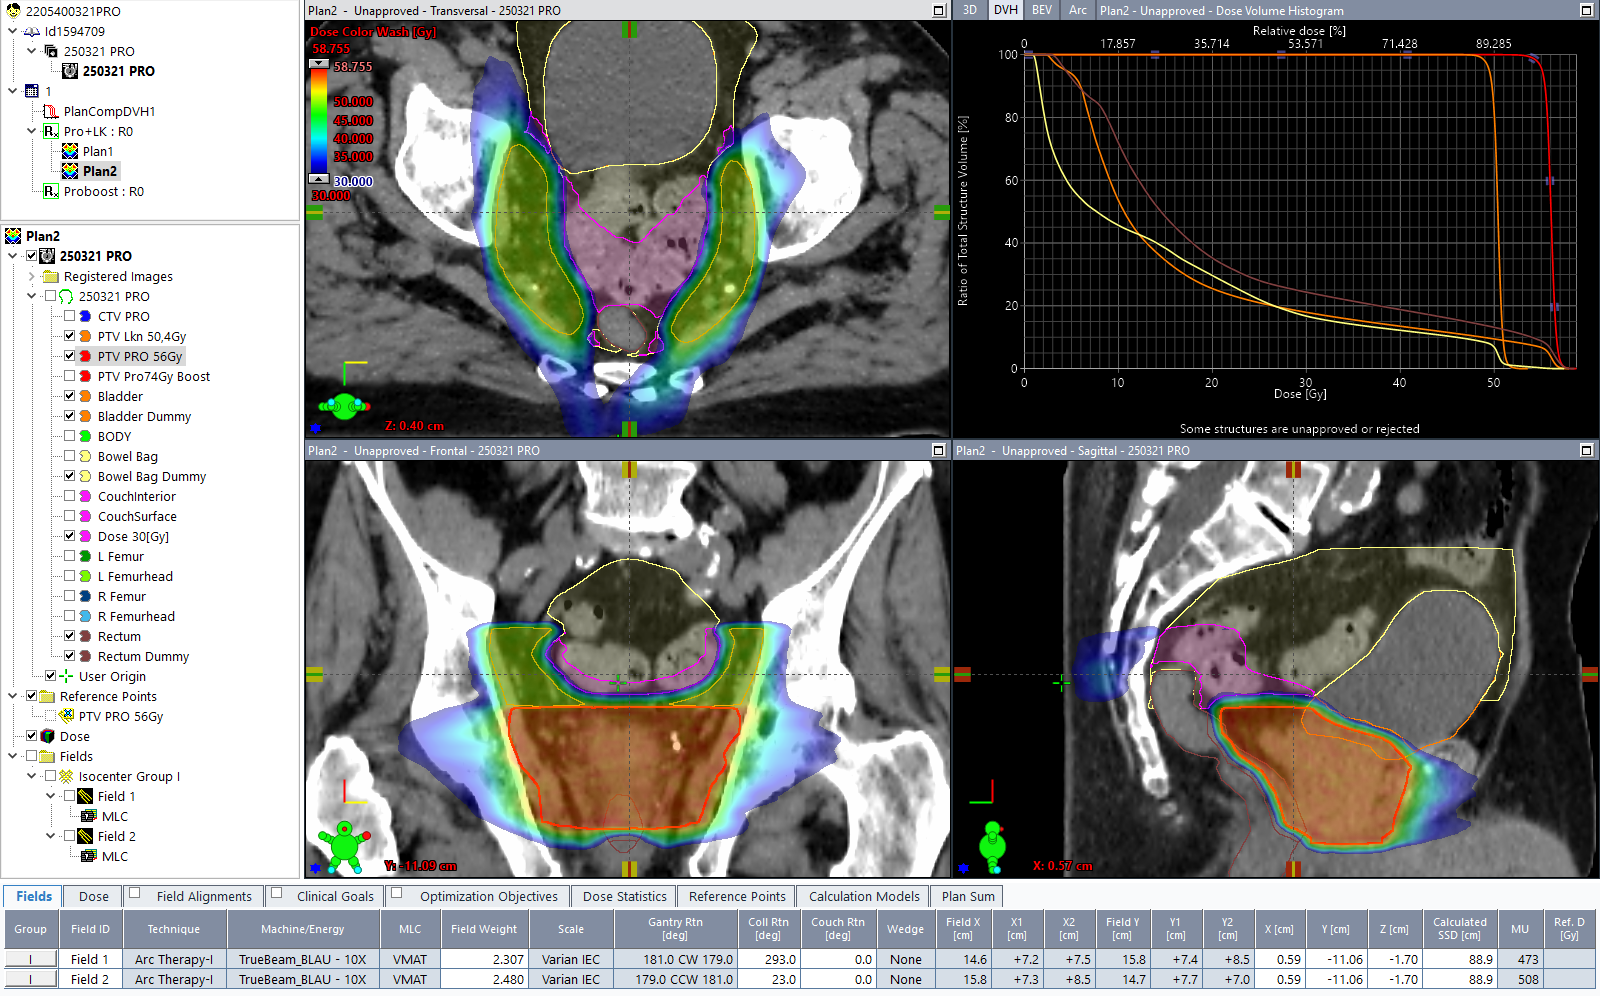
The latter is convenient in prostate plans where the lymph nodes also have to be irradiated. The part of the bowel bag which sits right between the nodes leads to a challenging optimization situation. While the "Dose [%]" structure can take care of hotspots outside the PTV as described above, a "Dose 30[Gy]" structure can be used to reduce bowel bag dose. In the starting plan, the uncropped dose structure penetrates the bowel bag wherever dose exceeds 30 Gy:
We then crop "Dose 30[Gy]" outside Bowel Bag Dummy7 with no margin, so that the dose structure is entirely inside Bowel Bag Dummy:
By adding an upper objective, the cropped structure is finally used to squeeze out dose from Bowel Bag Dummy (Plan1 was copied to Plan2). The results are rather impressive:
All the numbers in the described method can be varied on a case-by-case basis. Neither is it necessary to always use the 90% isodose to convert it into a "Dose" structure, nor is the cropping margin fixed. We only wanted to convey the idea of using the "Convert Isodose Level to Structure" function as a powerful method of getting better plan quality.
Notes
1 Our current Application Build is 16.1.4.4, algorithms are version 16.1.0
2 Most of our VMAT plans are normalized to 100% in Target Mean.
3 In case you wondered about the high MU number in the screenshot: this is a non-typical 3 Gy prostate.
4 Once again, after hitting OK, a deliverable VMAT plan is created, which hopefully contains no hotspots.
5 Structure creation will not work if the Structure Set is already approved, which prevents adding more structures. In the planning phase, Structure Sets are usually still unapproved.
6 A margin of 4 mm is also used frequently.
7 Our "Dummy" structures never overlap with targets. They are helper structures and primarily used for optimization. The typical cropping margins from the full organ are 3 mm in the head and neck region, and 5 mm elsewhere.