
Introduction
A complete beam data set is presented, which may be used to configure the AAA and Acuros XB algorithms of the Eclipse TPS for comparison purposes. We used this data set to generate beam models of the 11.0.31 version of algorithms AAA, AXB, DVO, PGO and PRO.
The Source Surface Distance (SSD) for all curve measurements and output factor measurements was 100 cm. Only the MLC transmission and Dosimetric Leaf Gap (DLG) were measured at SSD 90 cm.
Choice of Detector
The choice of this detector considered the following aspects:
- "The recommended detector for all profile measurements is the ion chamber." (Torsti 2013).
- "One widely used and acceptable approach for measuring profiles uses a diode detector for fields smaller than 5 x 5 cm2 and an ion chamber for larger field sizes" (Torsti 2013).
- "Measuring all profiles with a diode is equally acceptable, as long as care is taken for the accuracy of the measured profile outside the field in the profile tail region as well as inside the field" (Torsti 2013).
- "It is recommended to use an ionization chamber for all beam data measurements for the source model" (Eclipse Algorithm Reference Guide, p.56).
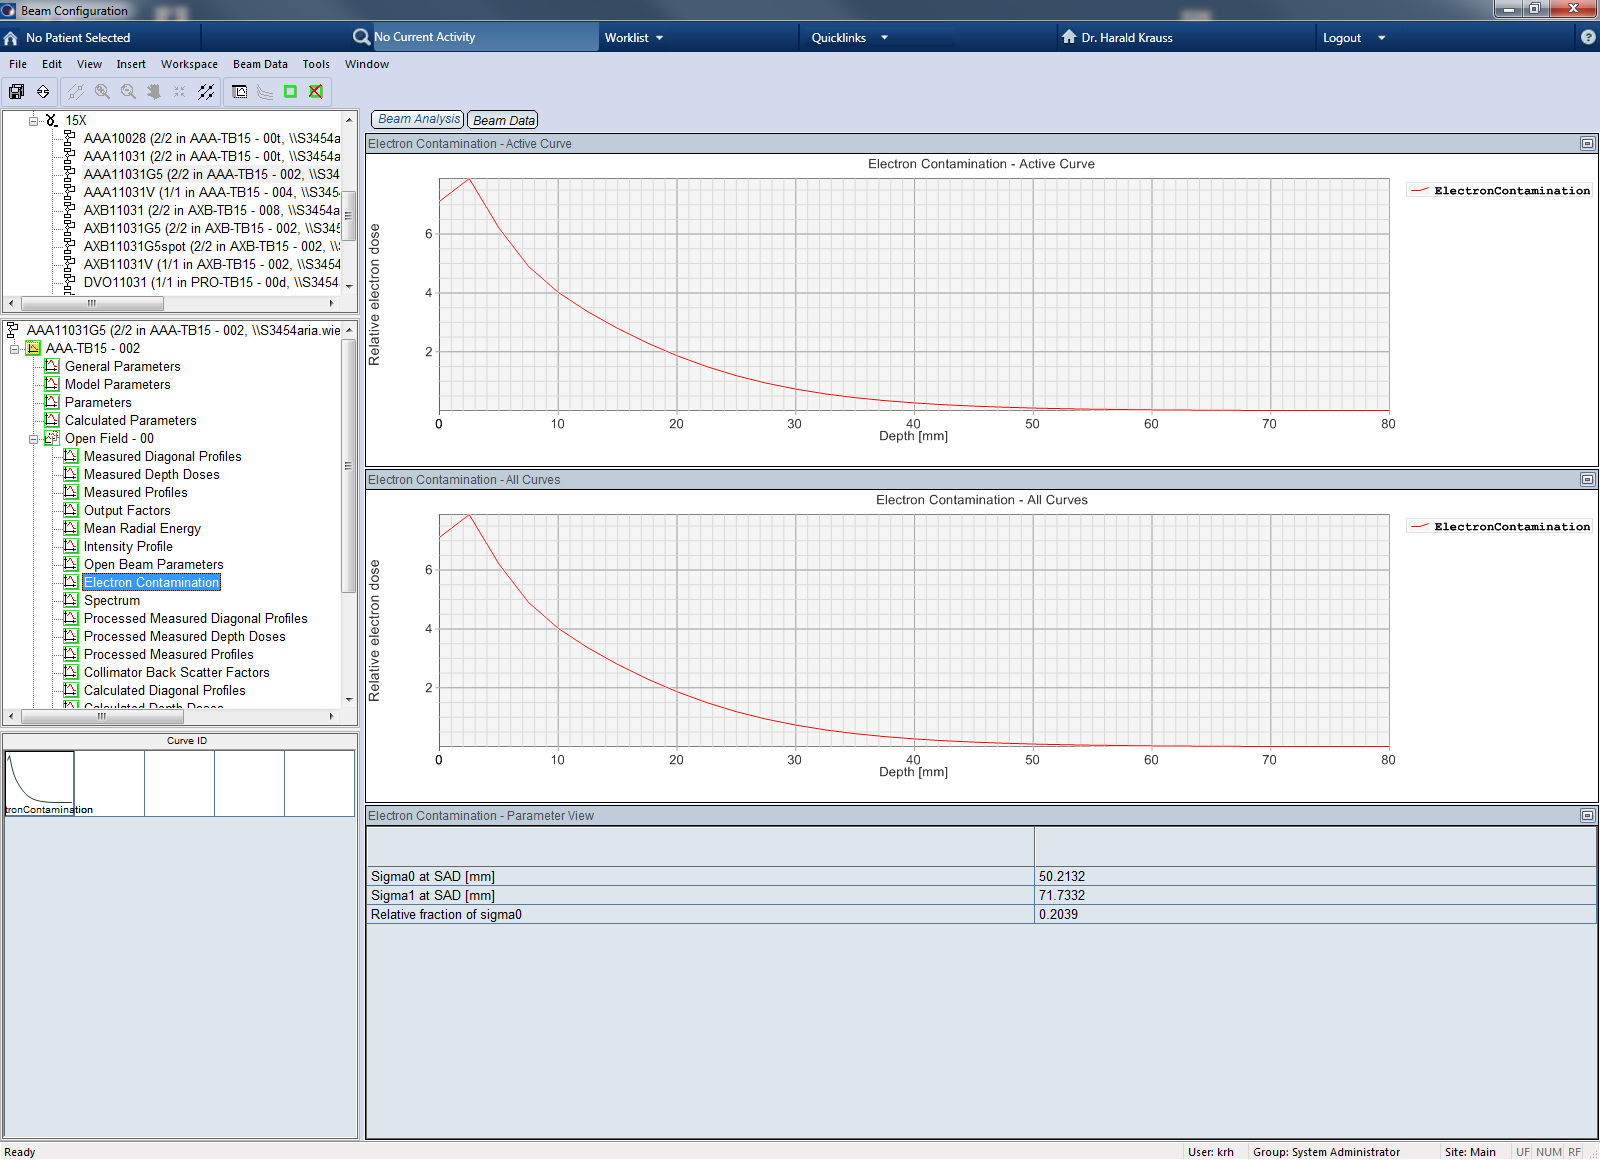
- "Do not mix depth dose measurements performed with different detector types (for example diodes and cylindrical ion chamber) as this may lead to errors in the electron contamination model" (Eclipse Algorithm Reference Guide, p.56).
For most of the curve data (PDD, transverse profiles), we used the PTW PinPoint chamber TM31015 ("PP15"), which has a chamber volume of 0.03 cm3. According to PTW, the useful field size range of this chamber is (2 x 2) ... (30 x 30) cm2 (PTW Small Field Dosimetry Application Guide).
The diagonal profiles were measured with a standard PTW TM31010 (chamber volume: 0.125 cm3).
The output factor table was measured with an Electron diode PTW TM60012 and the standard PTW TM31002 (the predecessor of the 31010) with chamber volume 0.125 cm3.
MLC transmission was measured with a Farmer chamber PTW TM30013 (chamber volume: 0.6 cm3).
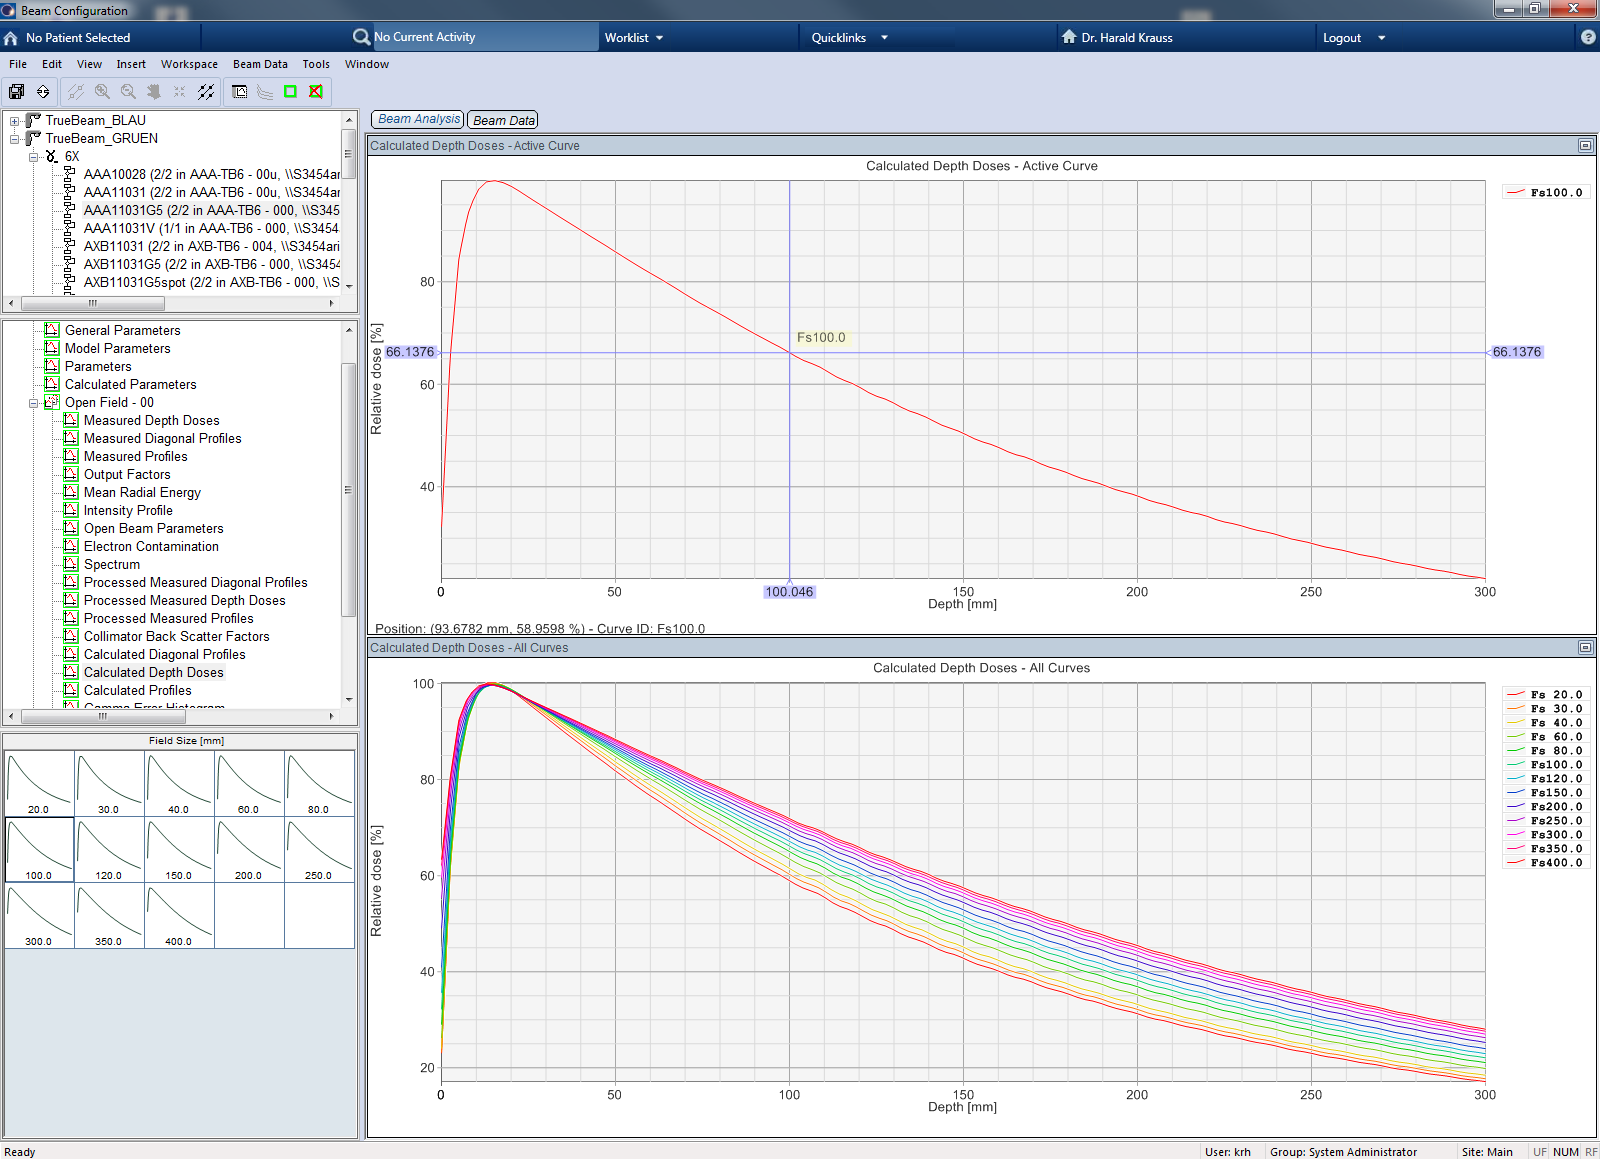
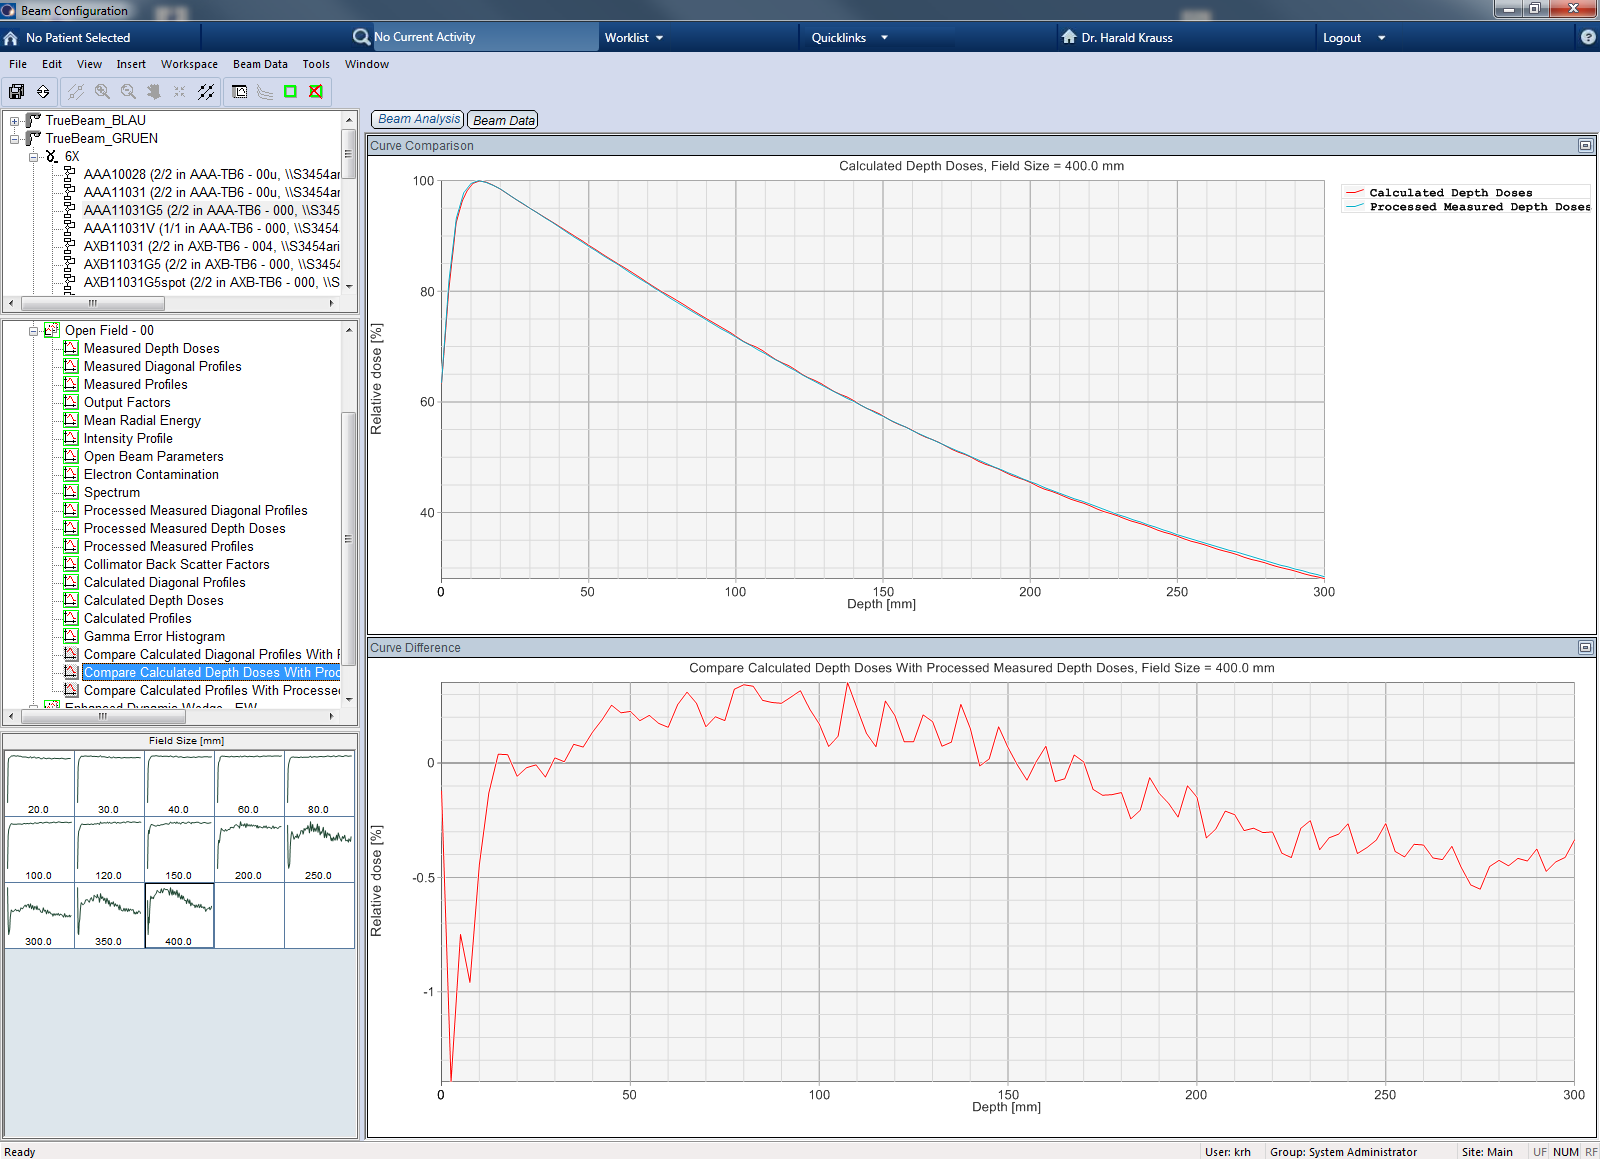
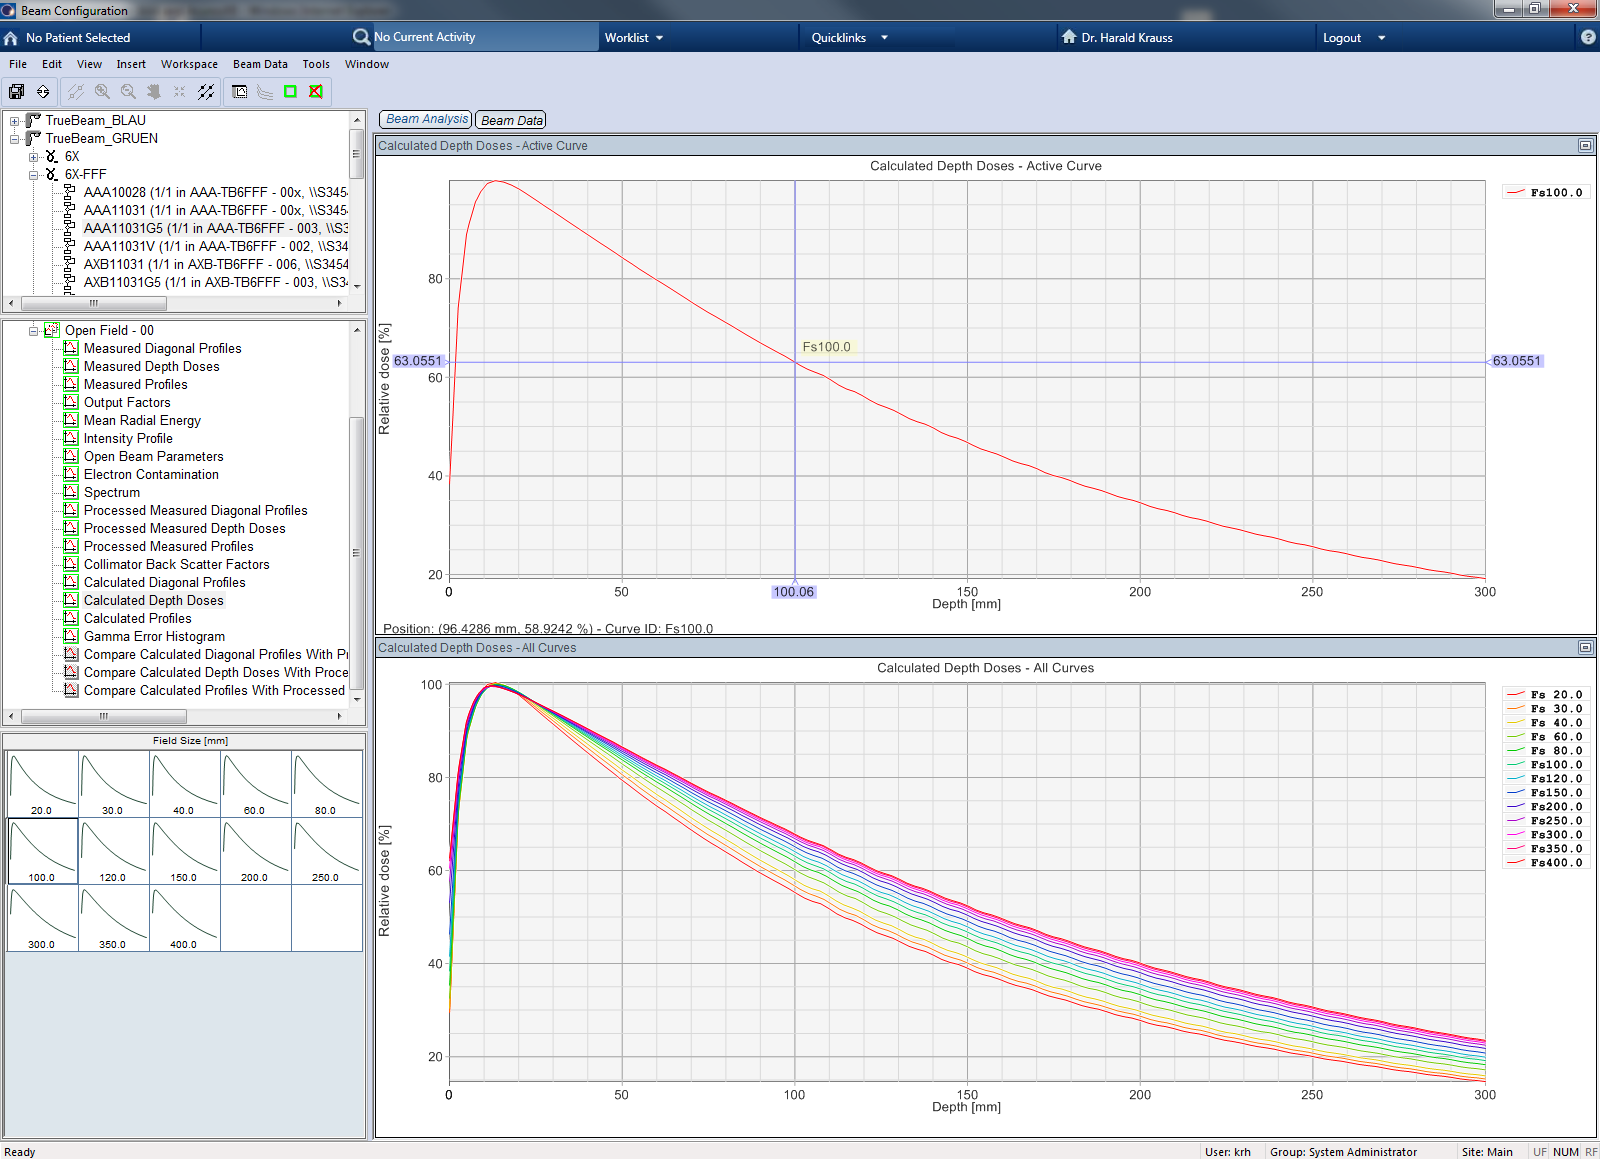
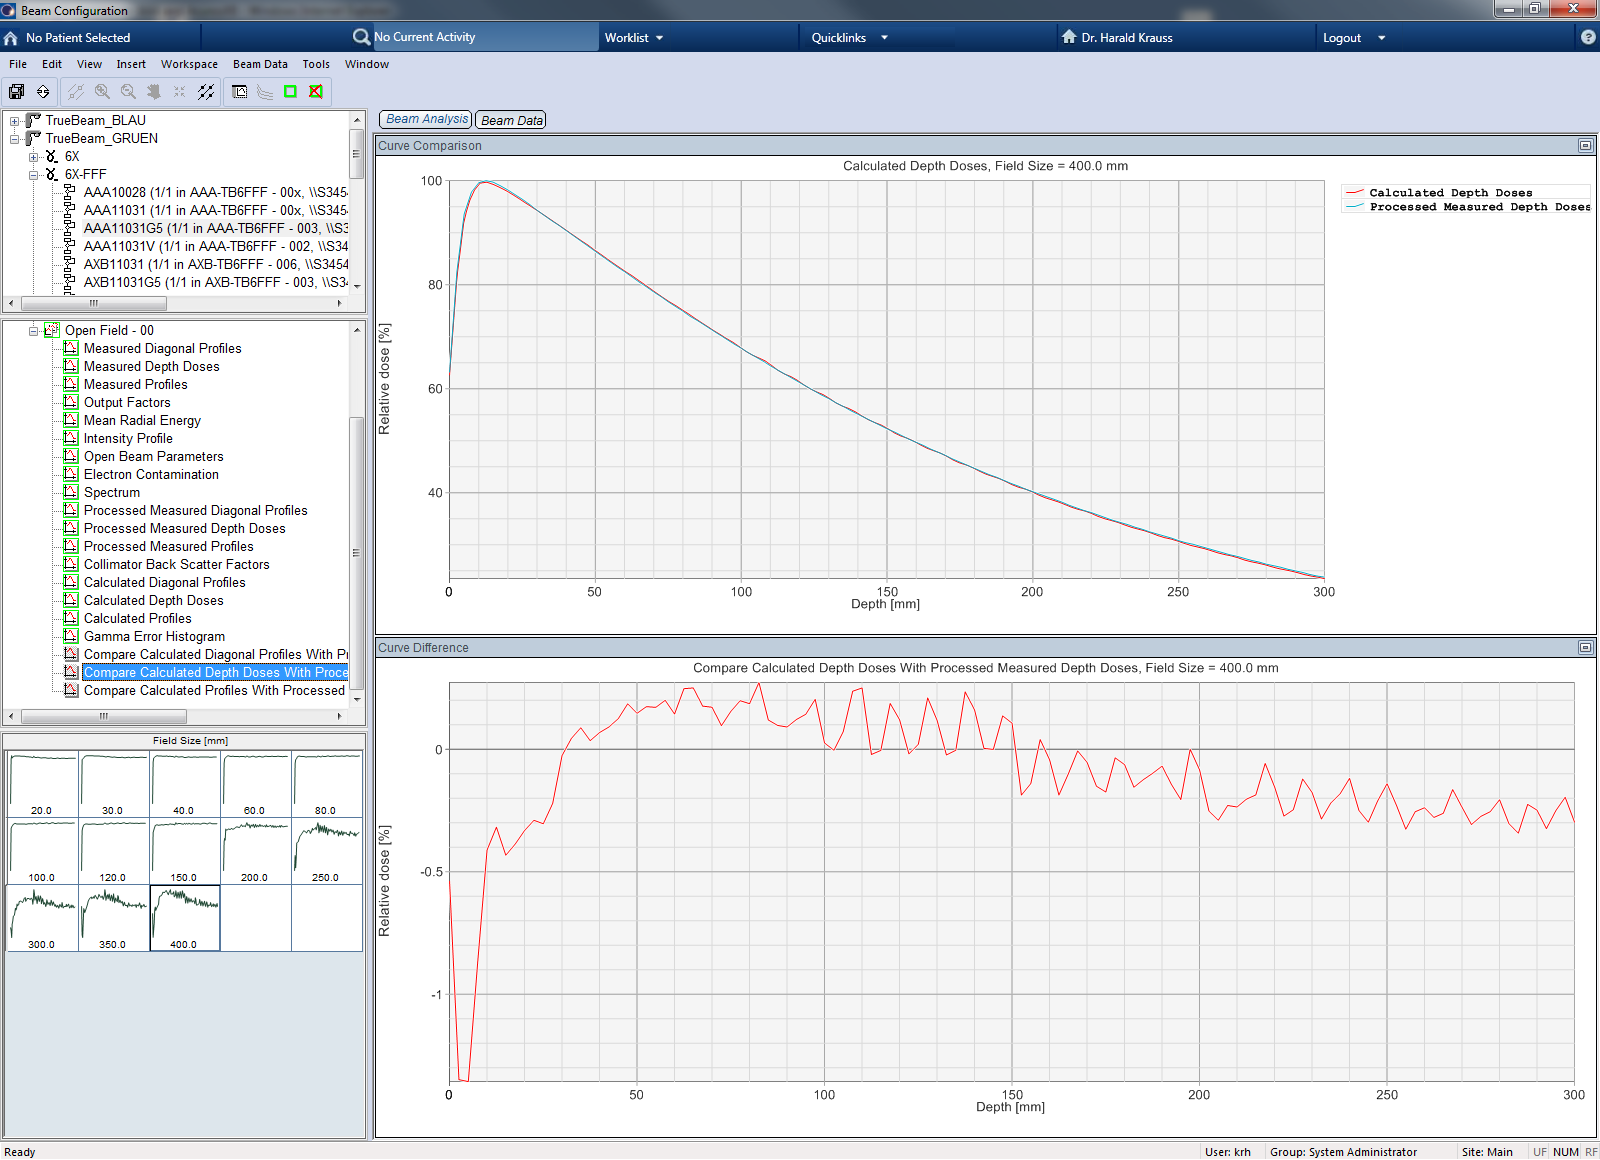
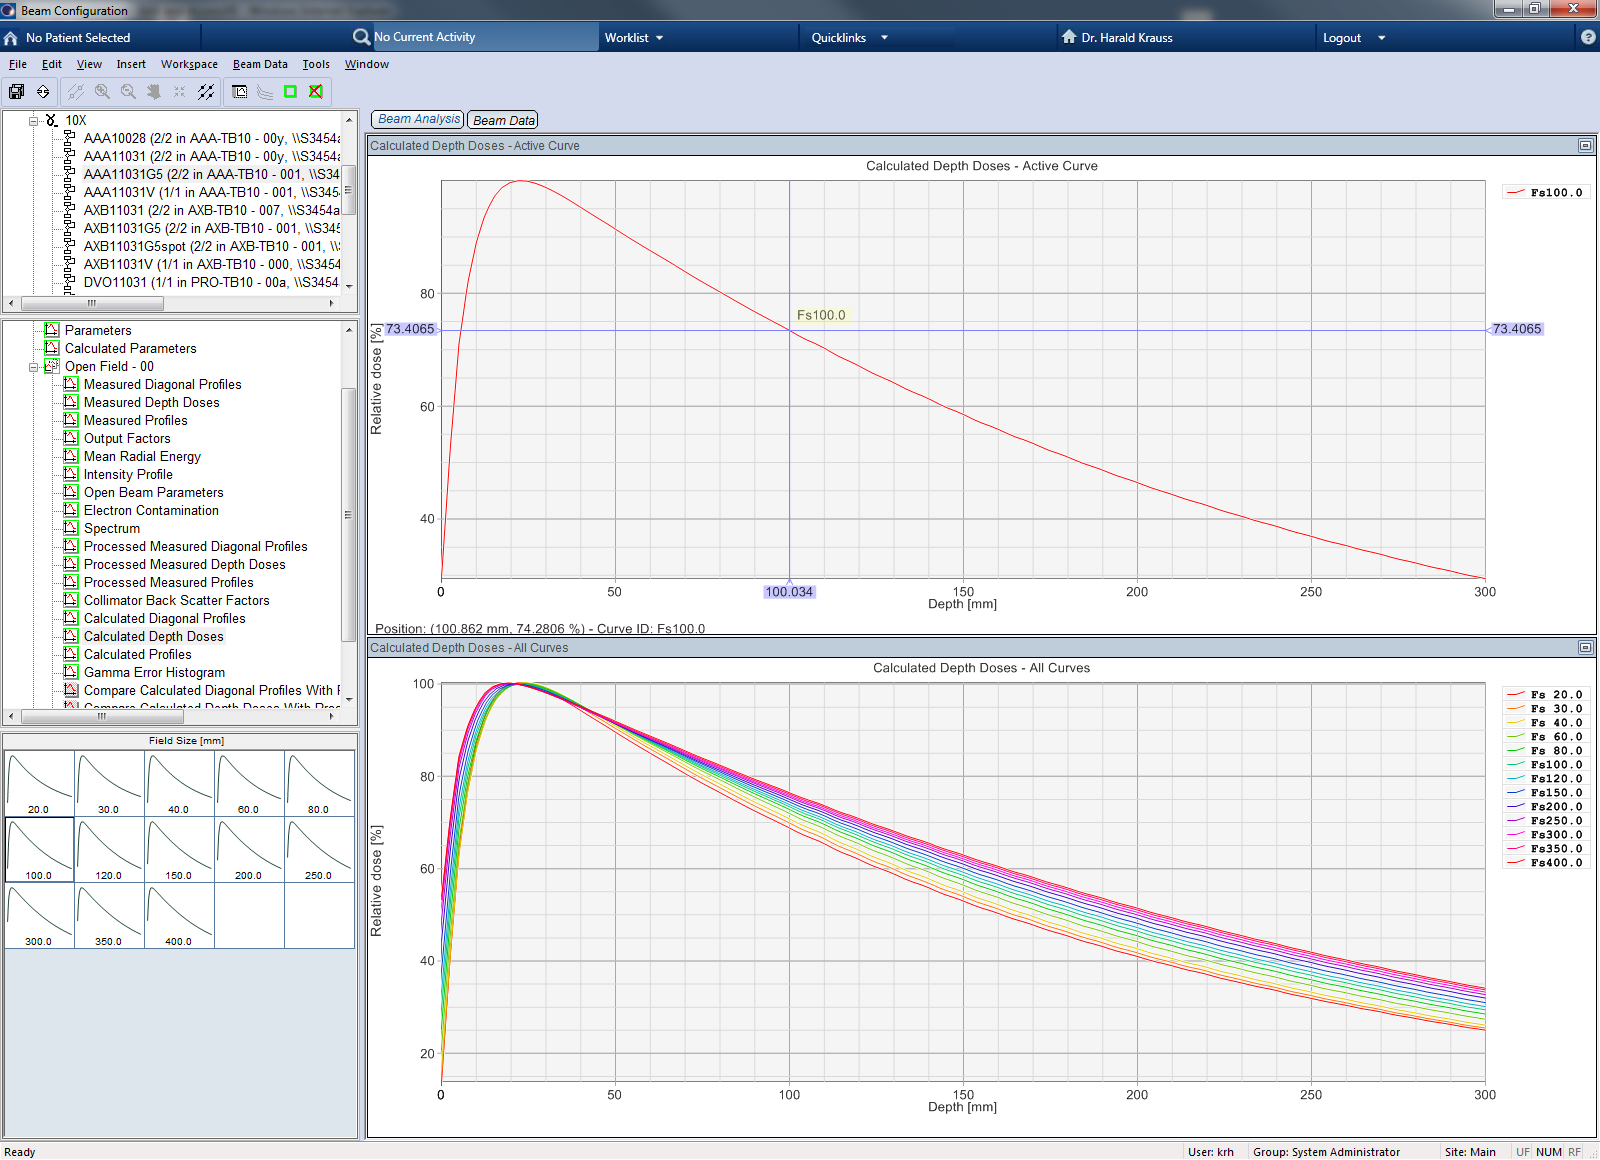
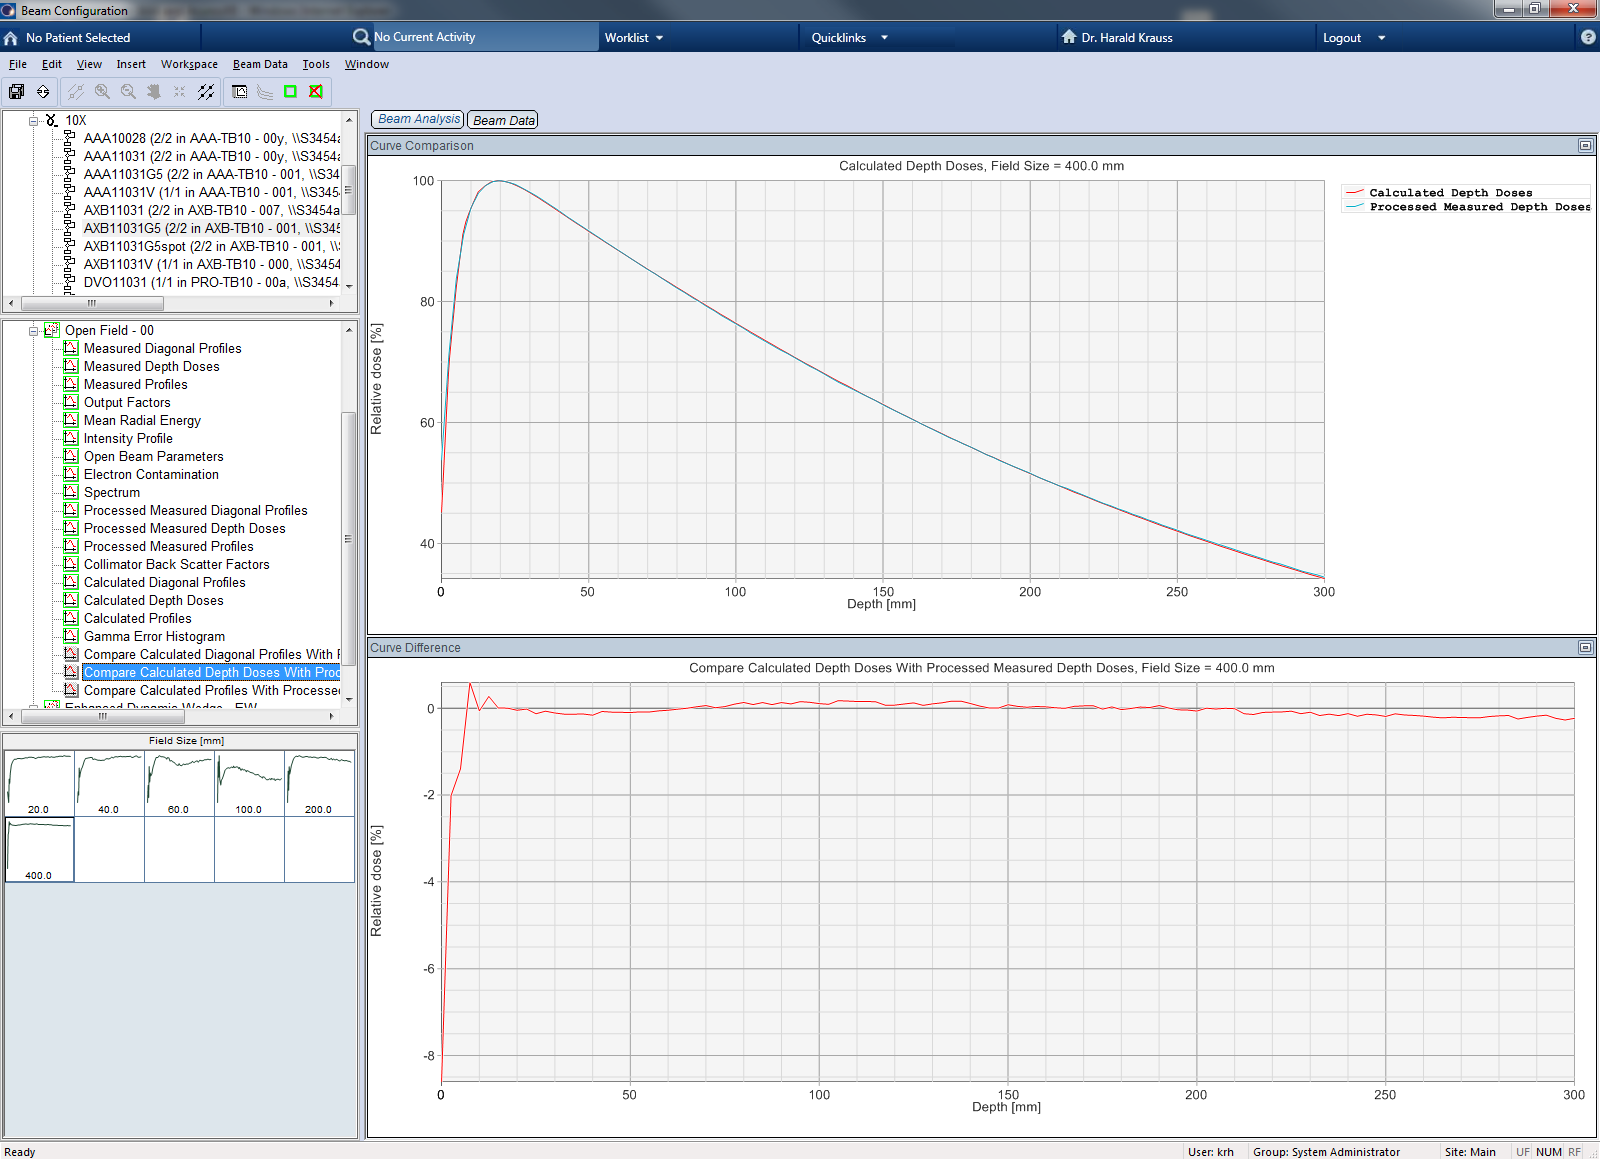
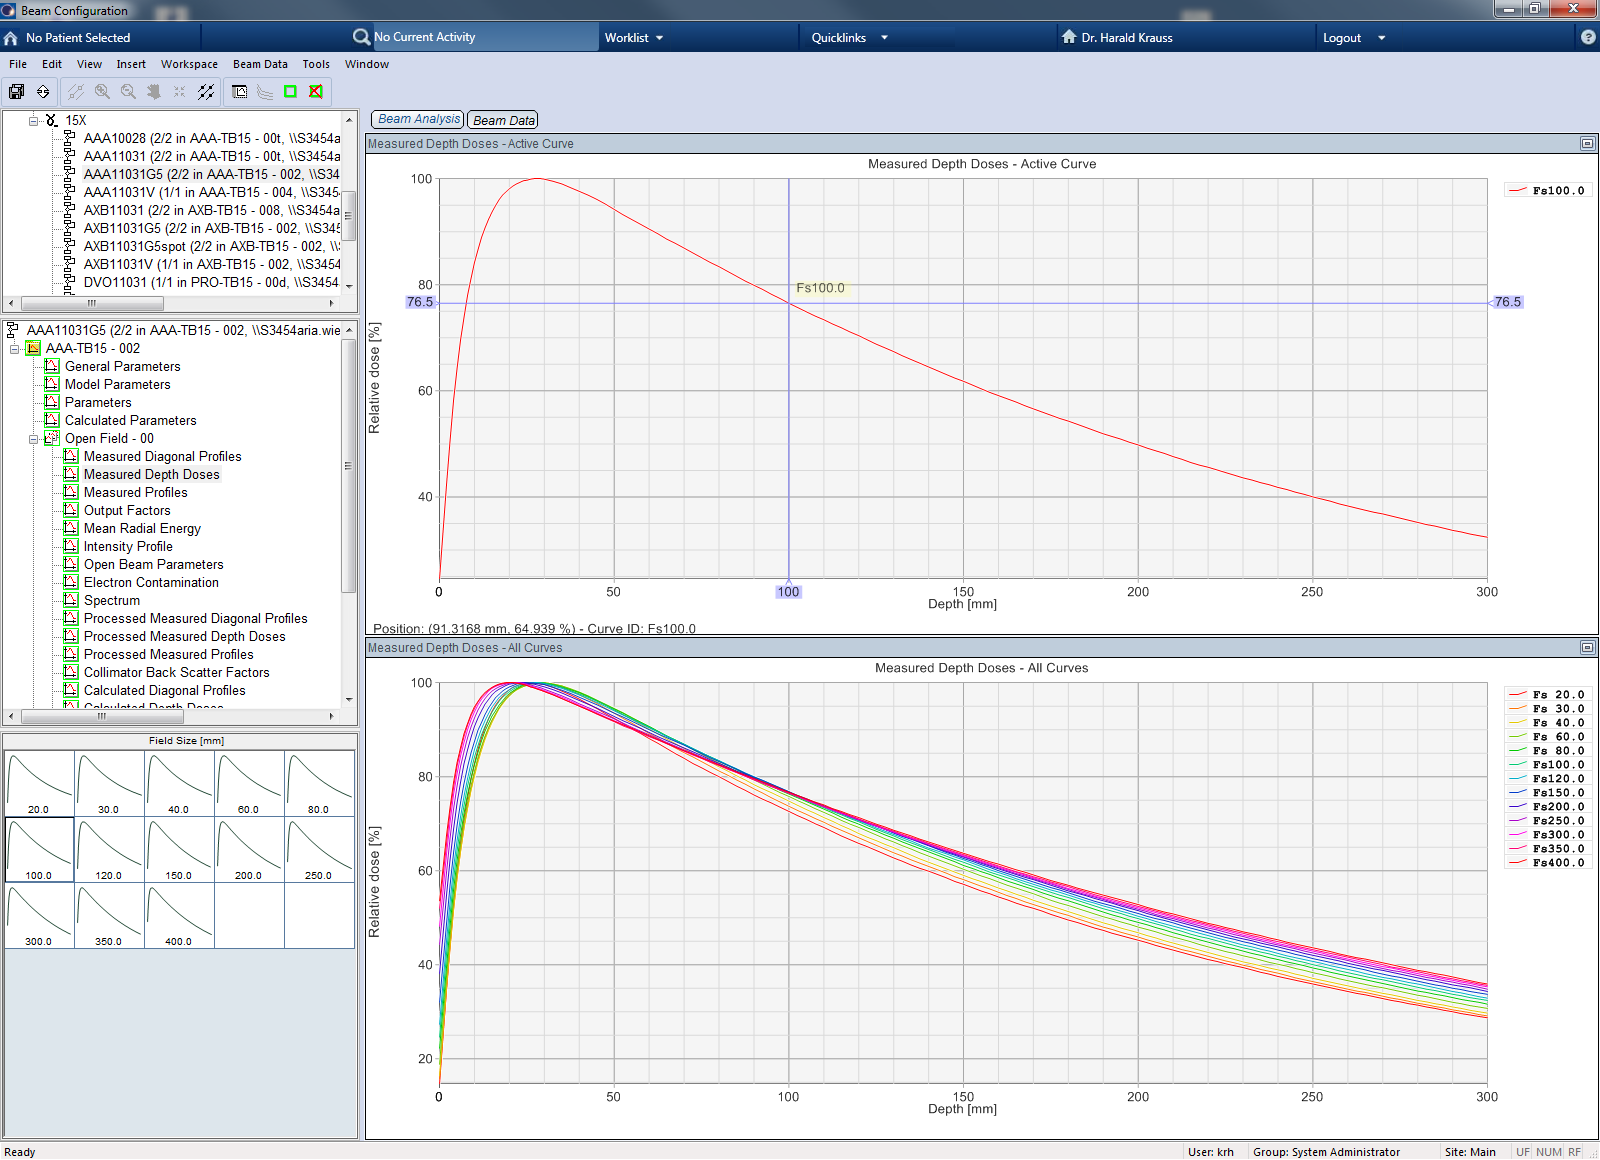
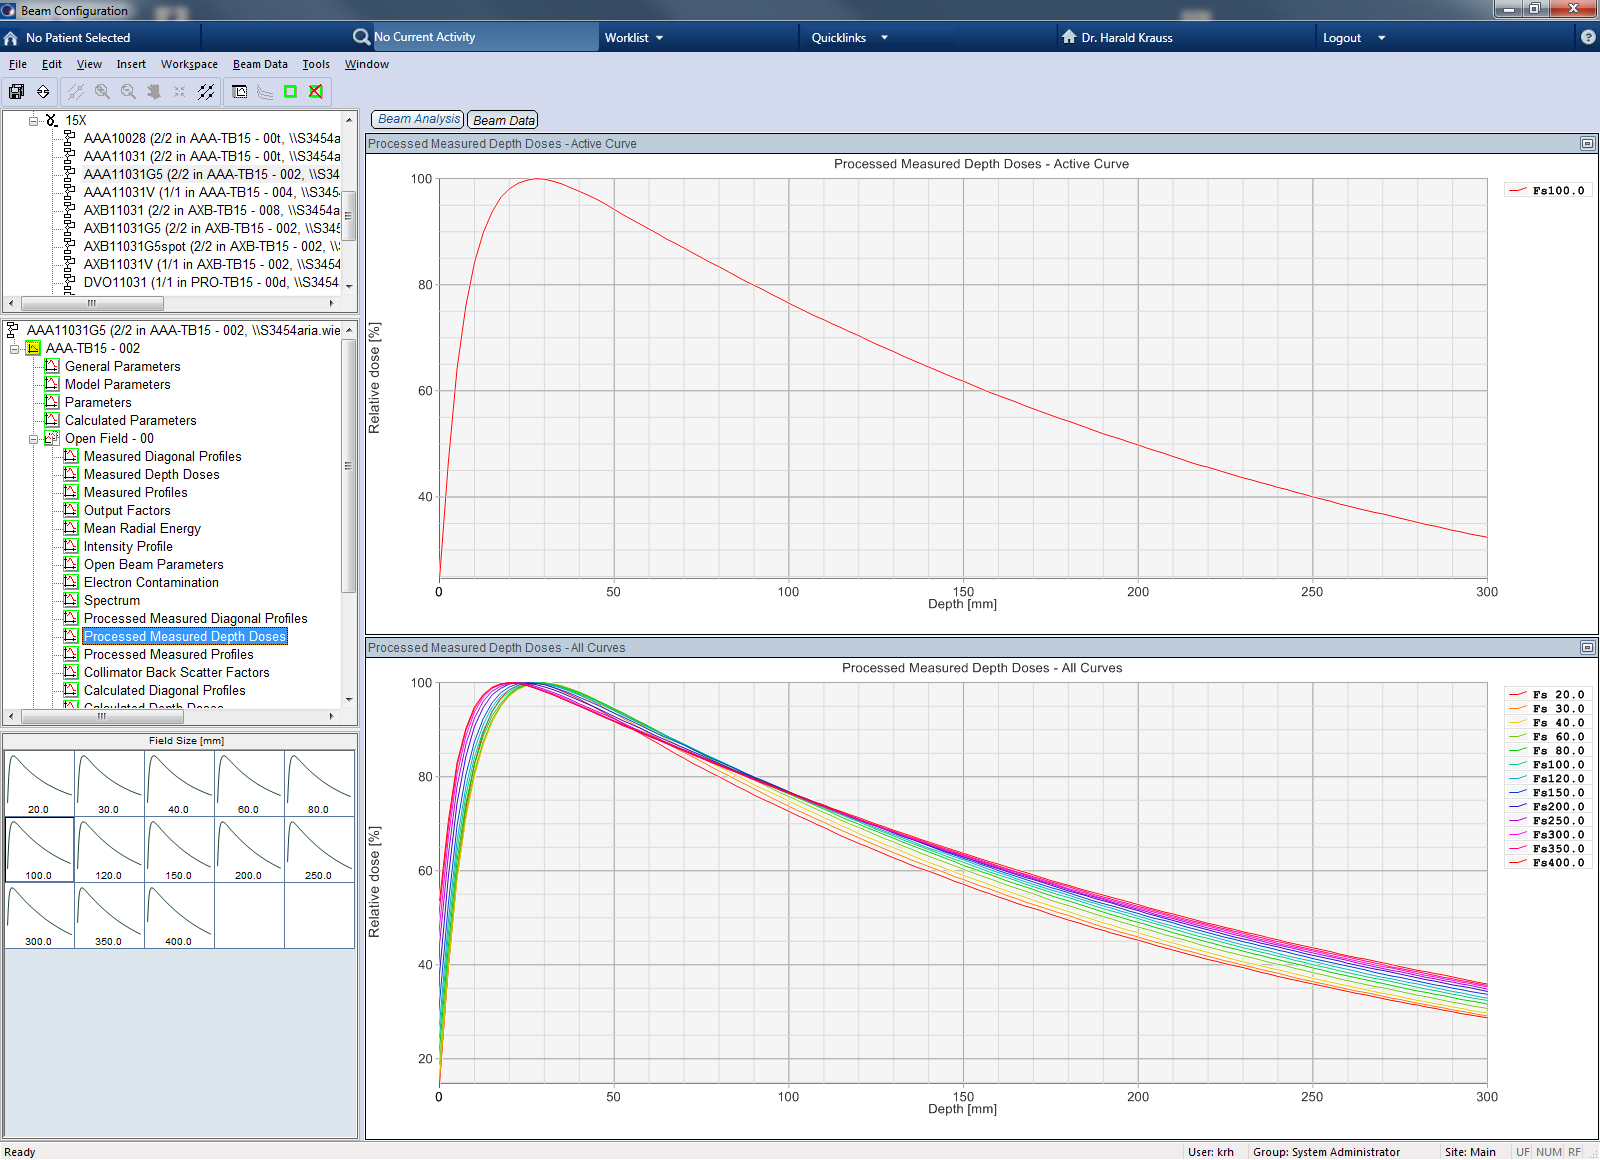
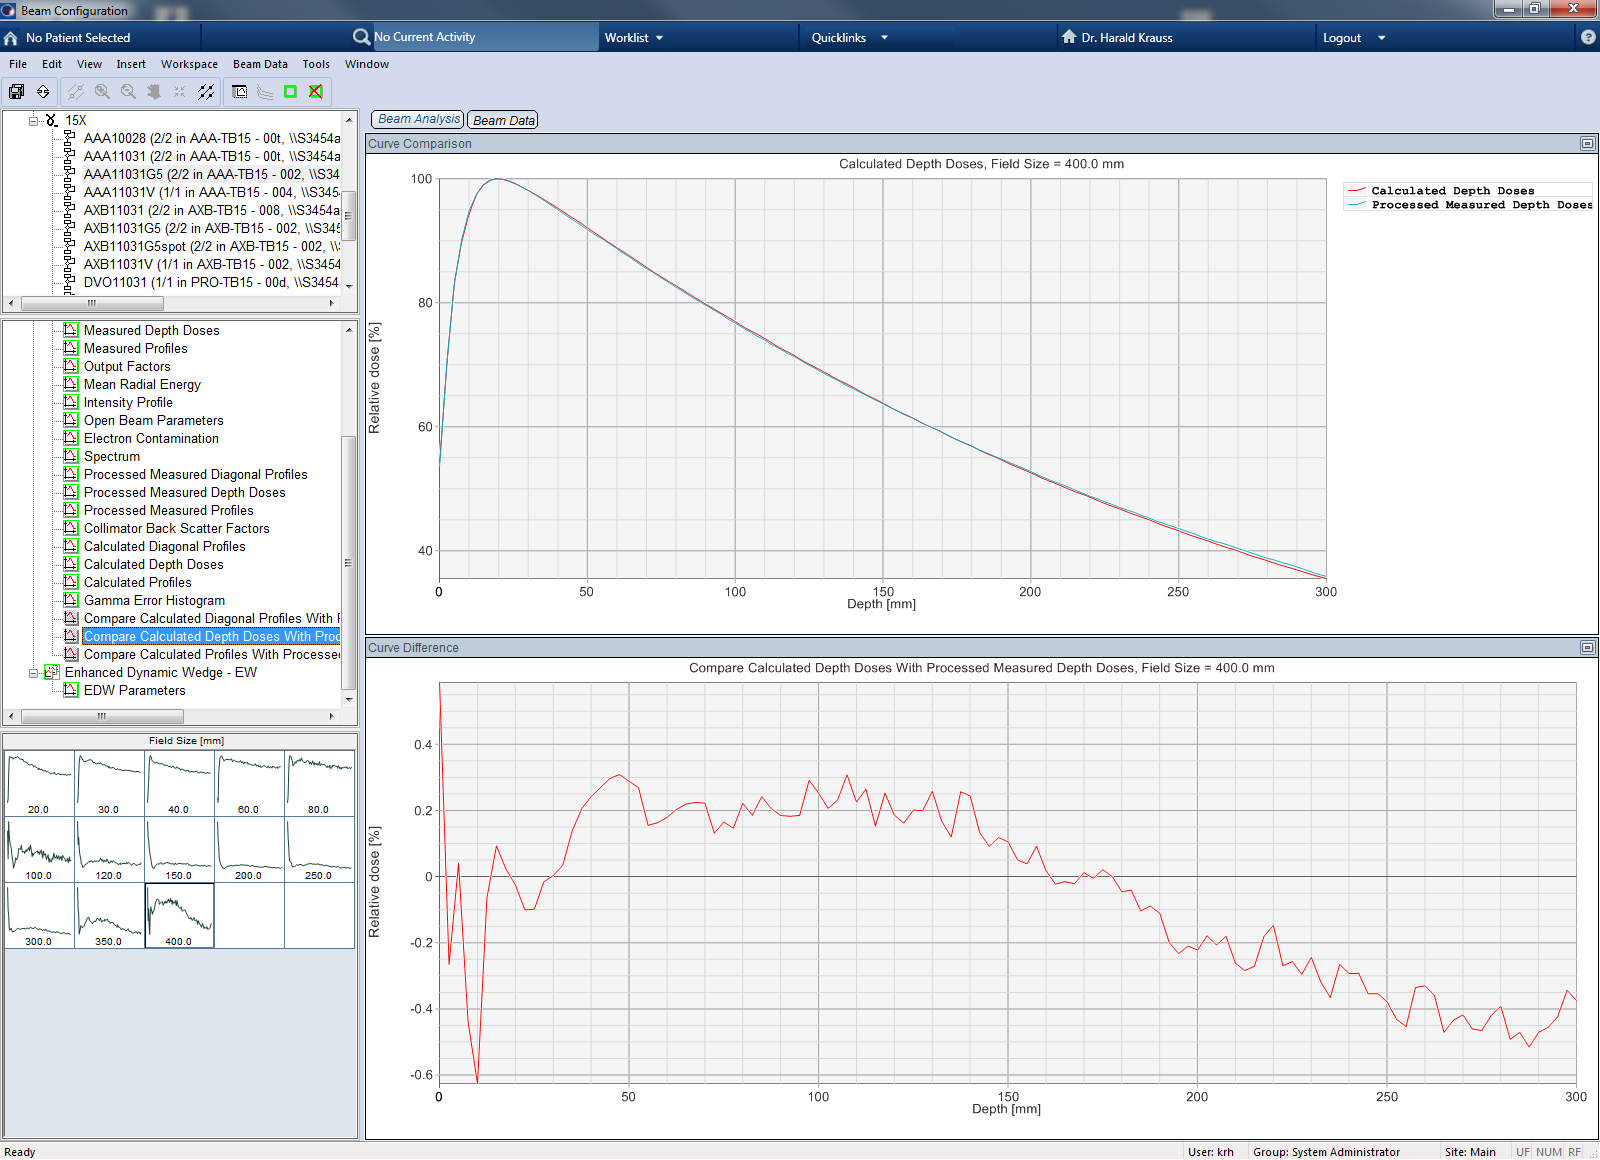
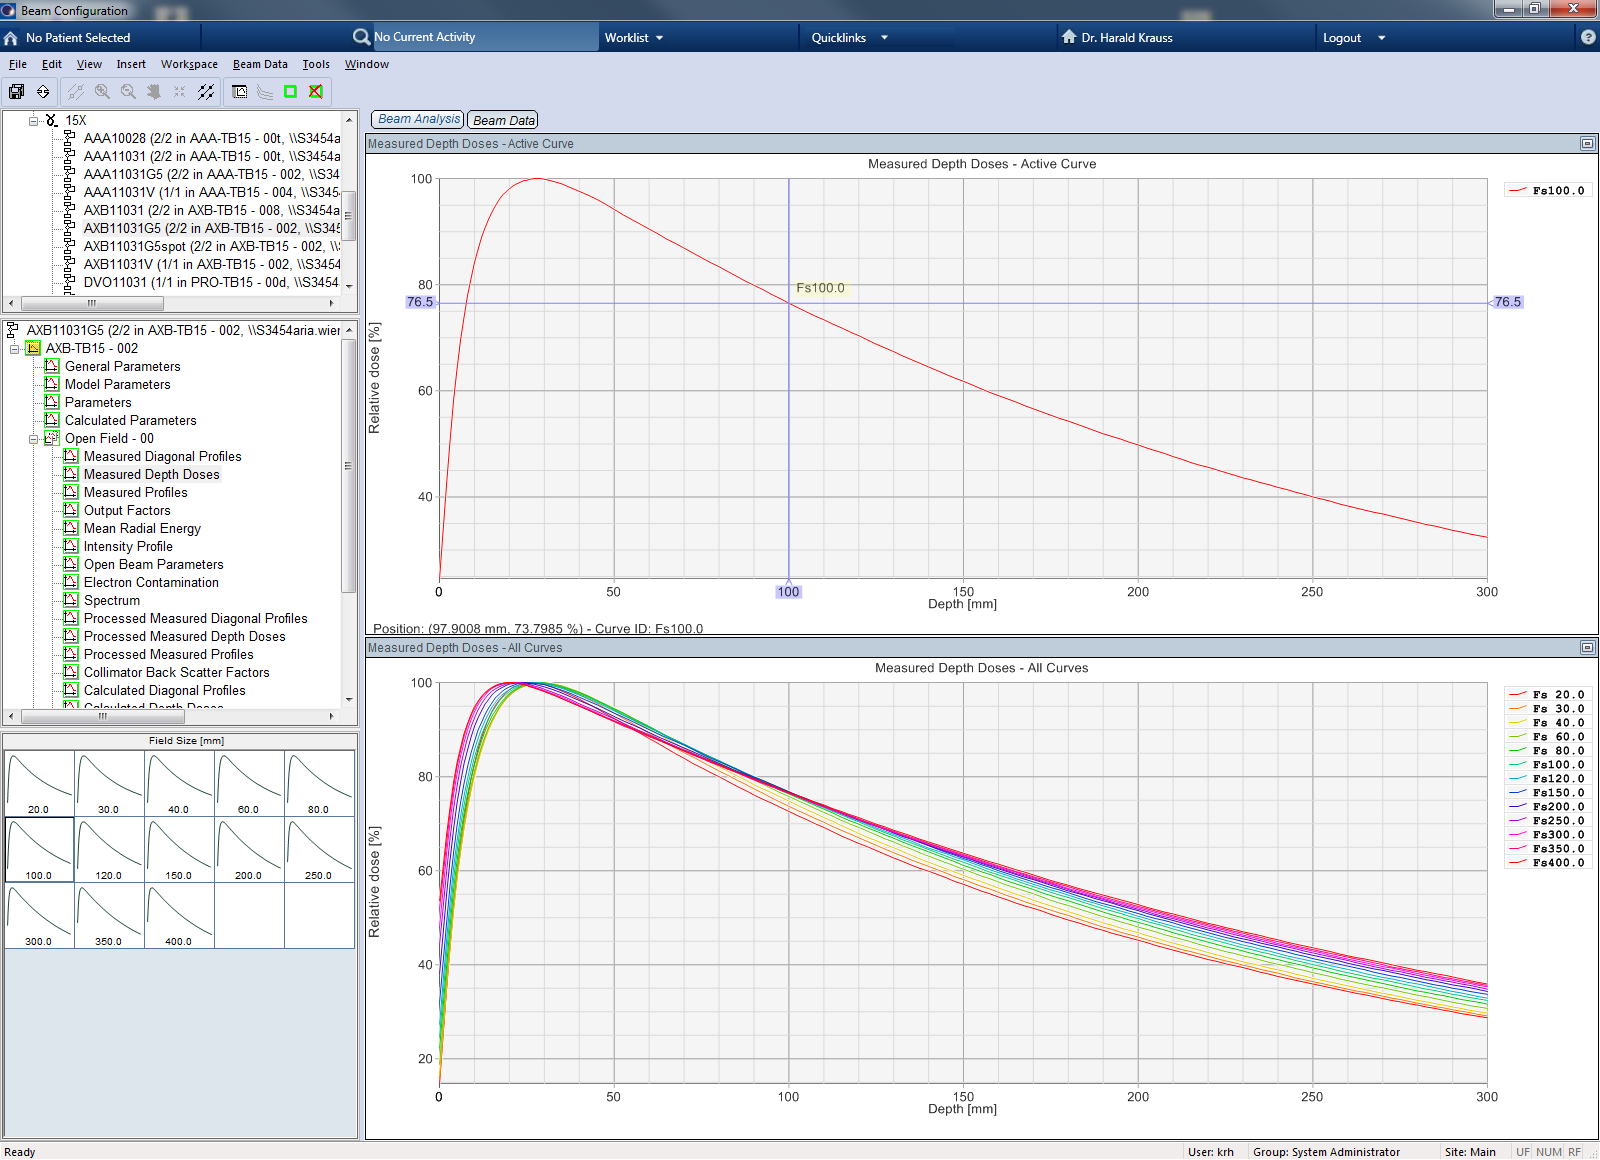
Depth Dose Curves
Depth dose curves were measured with PP15, S/N 492.
Chamber and Phantom Setup
In a percentage depth dose curve (PDD), an ionization chamber is at zero depth when the chamber's effective point of measurement (EPOM) is aligned with water surface. According to many dosimetry protocols, the EPOM of a thimble ionization chamber is shifted upstream by half of the chamber's inner radius1. This means that after the reference point (for thimble chambers this is the chamber axis) has been temporarily aligned with water level, the chamber must move downstream by the same distance, and zero set again.
The outer diameter of the PP15 is 4.3 mm (outer radius R = 2.15 mm). The inner radius r is 1.45 mm (0.5 r = 0.725 mm). This means that after the lowest point of the circumference has been aligned with water surface temporarily, the chamber has to move downstream by R + 0.5 r = 2.875 mm ≈ 2.9 mm. Now the effective point of measurement is at water level.
The PTW Trufix system of detector holders should take care of all this. However, we found that there is a slight shift of 0.3 mm between the chamber position after it has been set up "manually" (as described above) and with our Trufix system. According to PTW, the Trufix accuracy is ±0.3 mm, so our deviation is still within specs.
Also the manual method has its uncertainties. The most obvious contribution to uncertainty is the visual judgement "When is the bottom of the thimble aligned with water surface?". It is easy to cross-check, by repeating the procedure with the top of the chamber. The difference of the two vertical readouts should be the outer chamber diameter (within 0.1 mm, the MP3 step size).
We measured all Eclipse beam data after manual vertical alignment of the detector, not using the Trufix system.
The PP15 was positioned in the MP3 water phantom in horizontal orientation (= radial irradiation of the detector). The chamber cable ran through a weight (taken from the TrueBeam LaserGuard QA set), which dragged the cable down during the scans. This minimized the cable effect.
After the MP3 water tank was levelled with a clinometer and rotated to match crosshair projection on the floor of the tank, source to water surface distance was set to 100 cm using the TrueBeam front pointer device.
Then followed detector alignment:
- Horizontal alignment (with radiation): With X6 energy and jaws set to 2 x 2 cm, inplane and crossplane scans were measured at two depths: dmax (14 mm) and 250 mm. The MP3 phantom was levelled until the CAX deviation of the four scans was minimal (max residual CAX deviation: 0.06 mm).
- Vertical alignment (mechanical): The PP15 was first aligned with its bottom at water surface. Then the chamber was moved down by 2.9 mm, and the MP3 coordinate system was zeroed.
PDD scanning direction was upstream (starting at 300 mm depth).
Scan Settings
Scanning was controlled by PTW MEPHYSTO mc2 software version 3.0. Step size was 1 mm between surface and 20 mm (X6, 6FFF) or 30 mm (X10, 10FFF, X15) depth, and 2.5 mm at larger depths. Measurement time was 0.5 s per point. No reference detector was set, since TrueBeam dose rate was extremely stable. This means that all scans (the MCC files) were measured in absolute units [Gy/min], not only in normalized mode (relative to a static reference detector). This made saturation correction very easy (see below). The "ready to import" ASCII files in w2CAD format however are always normalized to dmax.
Session Log
Data was measured on Aug 2, 2013 on TDS1469. For each photon energy, PDD curves were acquired for 13 square field sizes: 2, 3, 4, 6, 8, 10, 12, 15, 20, 25, 30, 35 and 40 cm. Field size was defined by jaws, not MLC.
Water level was checked periodically with the front pointer: always before the first scan, for X6 and 6FFF additionally at mid-field size. Evaporation can make it necessary to fill up the water tank every 30 minutes or so, depending on room temperature and humidity. The front pointer method can detect changes of SSD in the order of 0.2 mm.
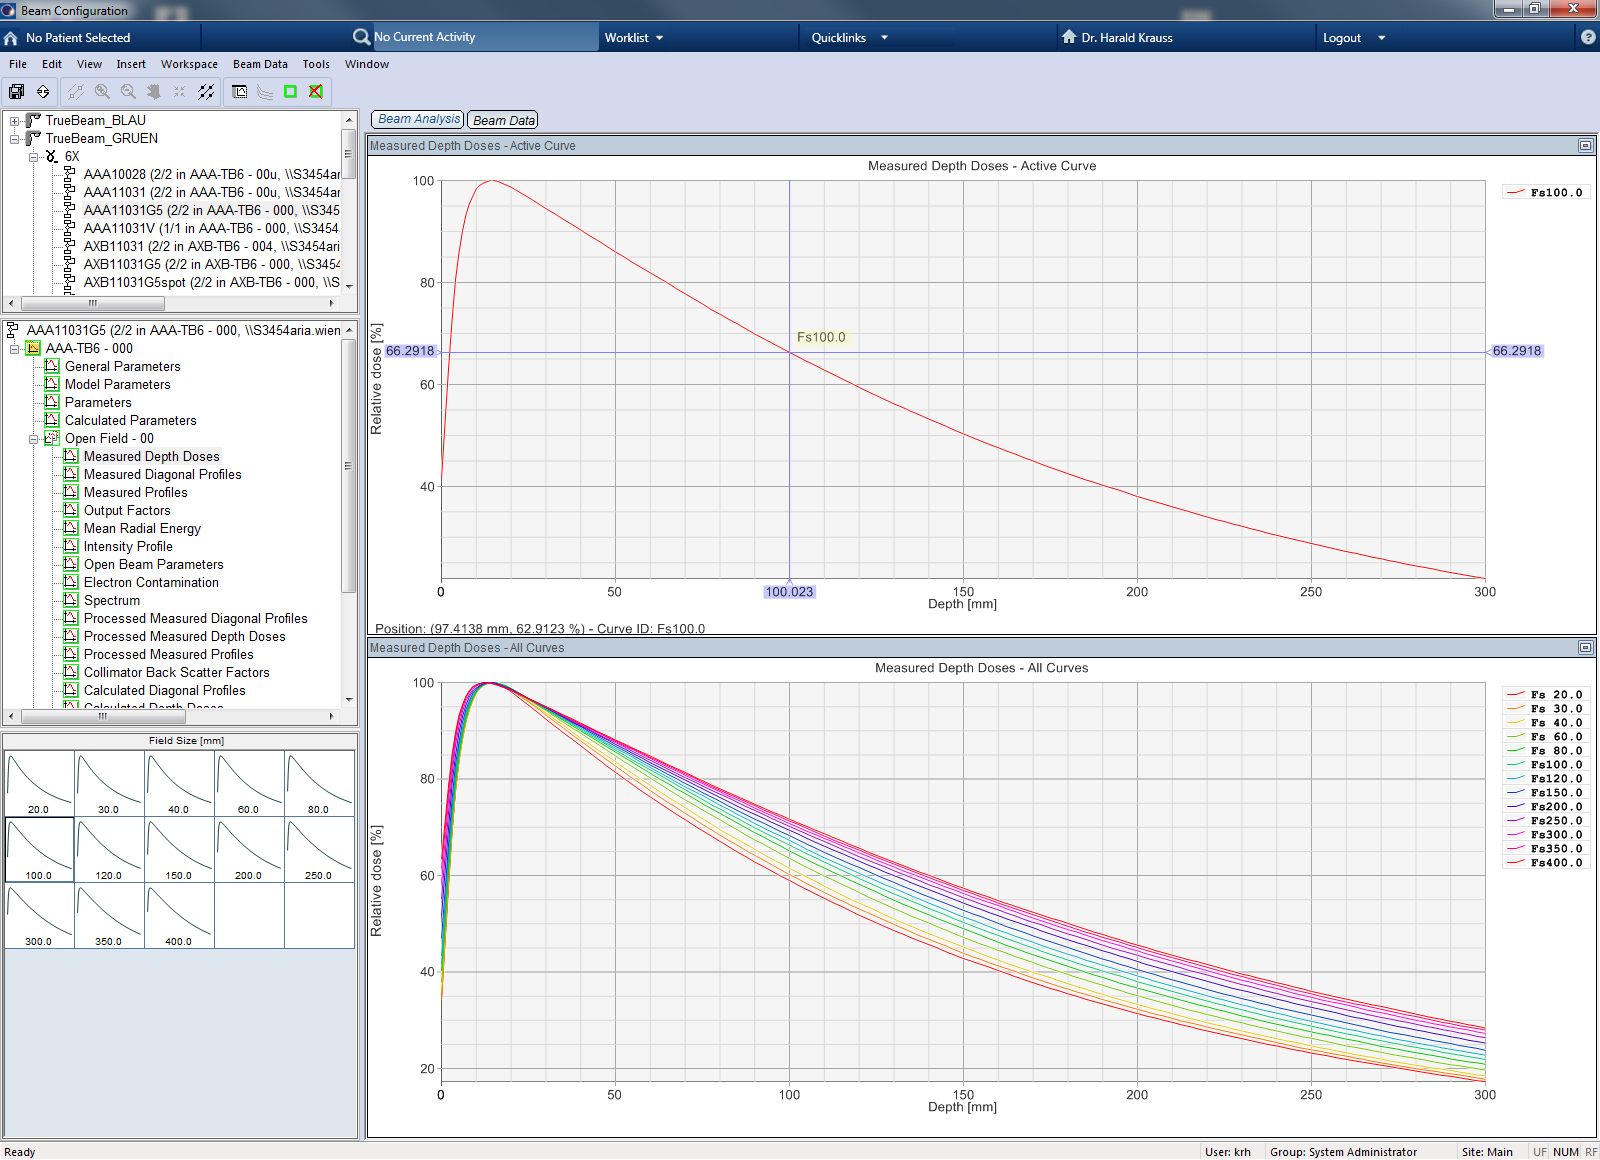
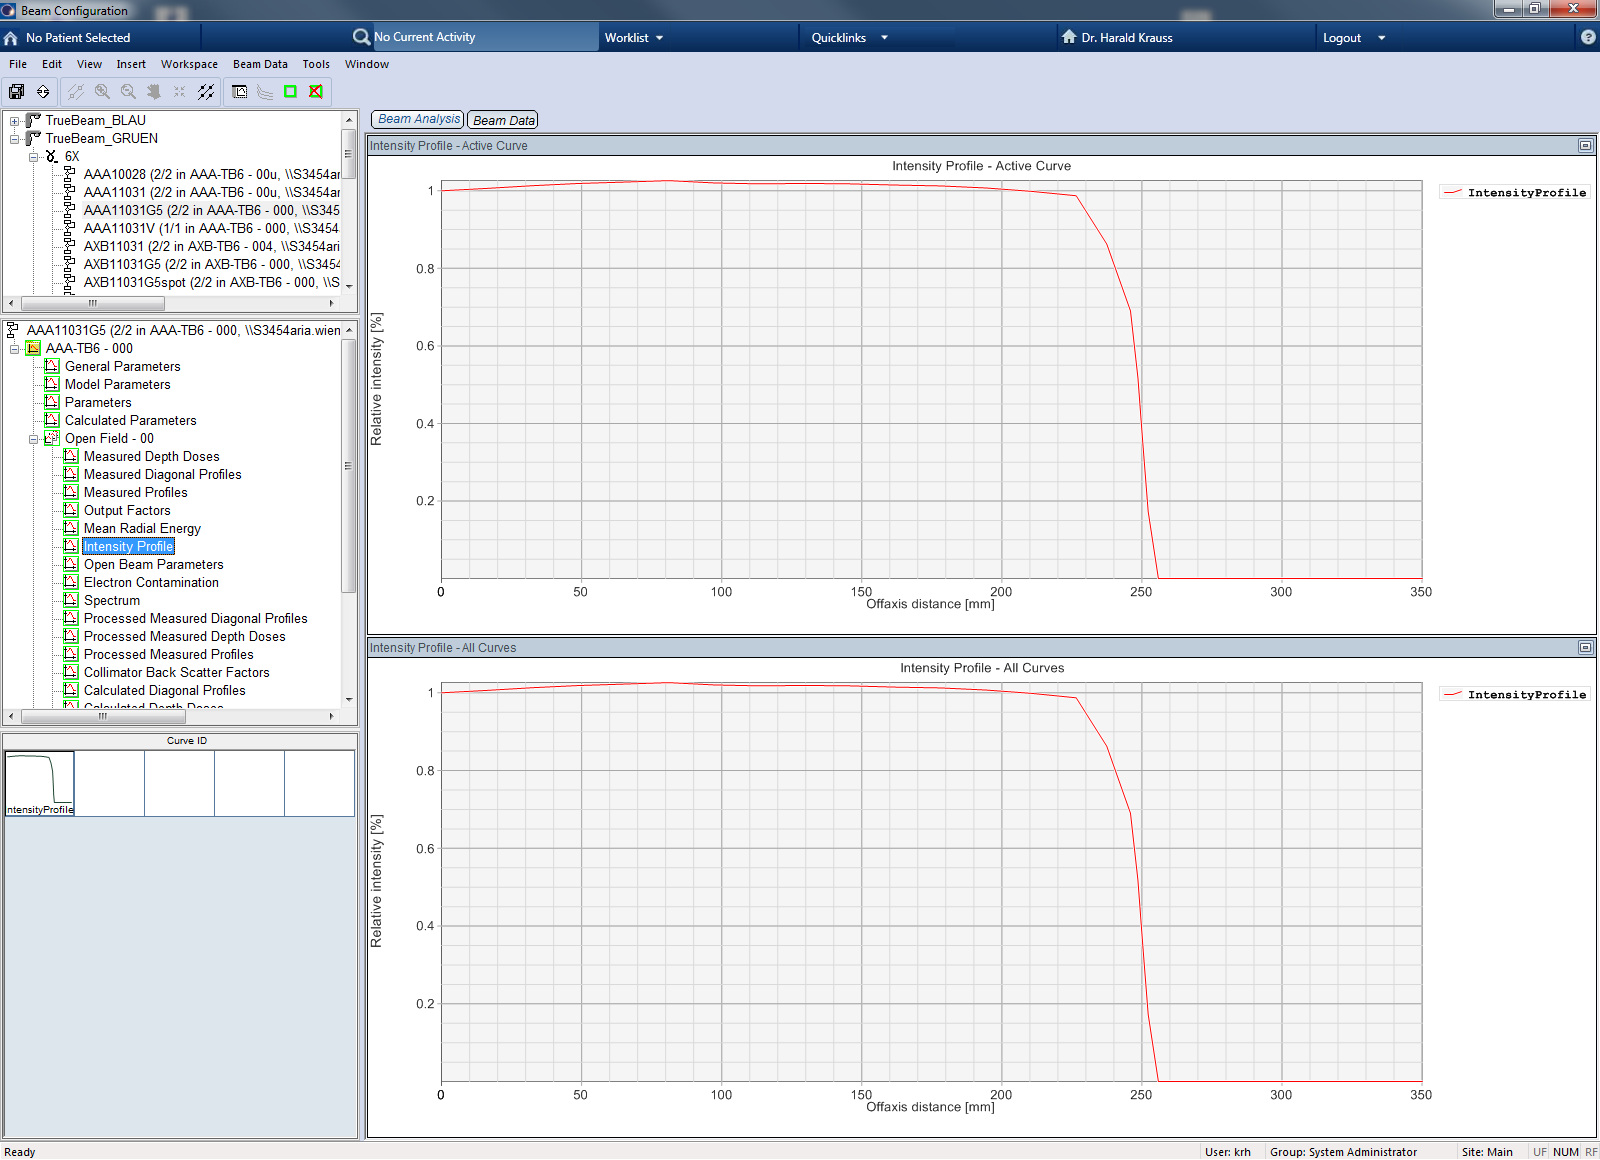
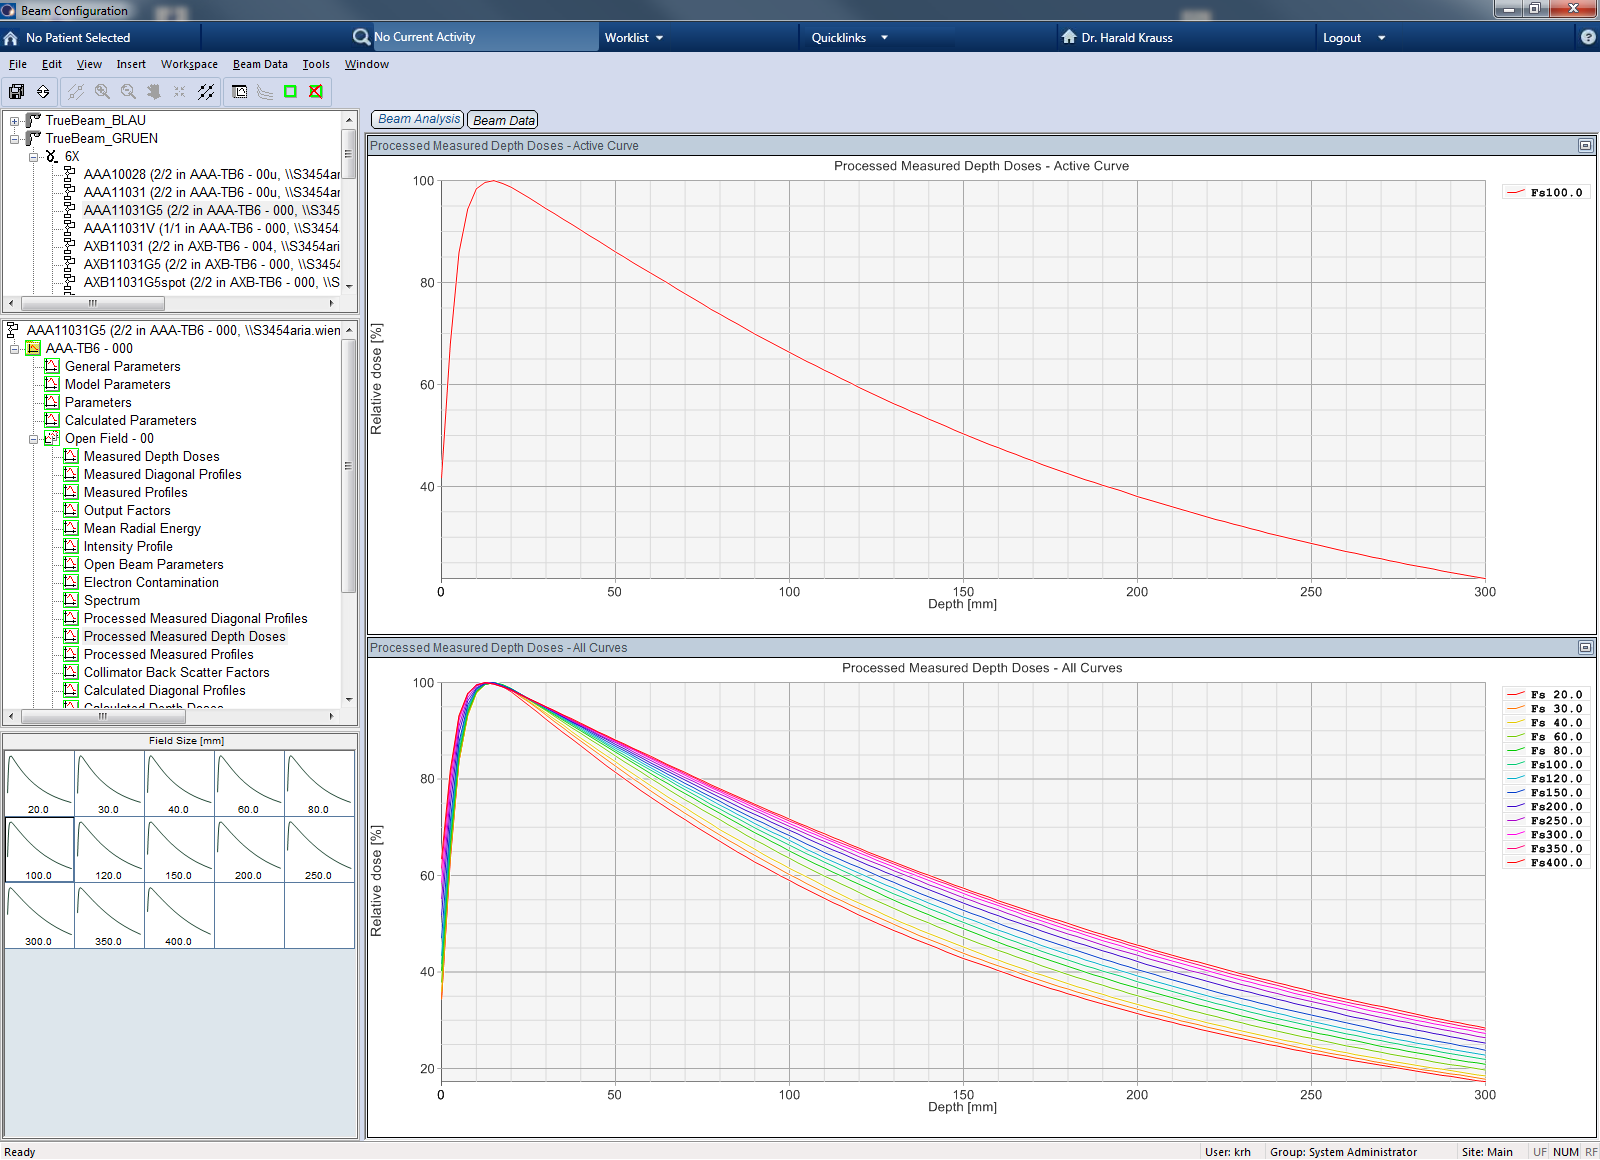
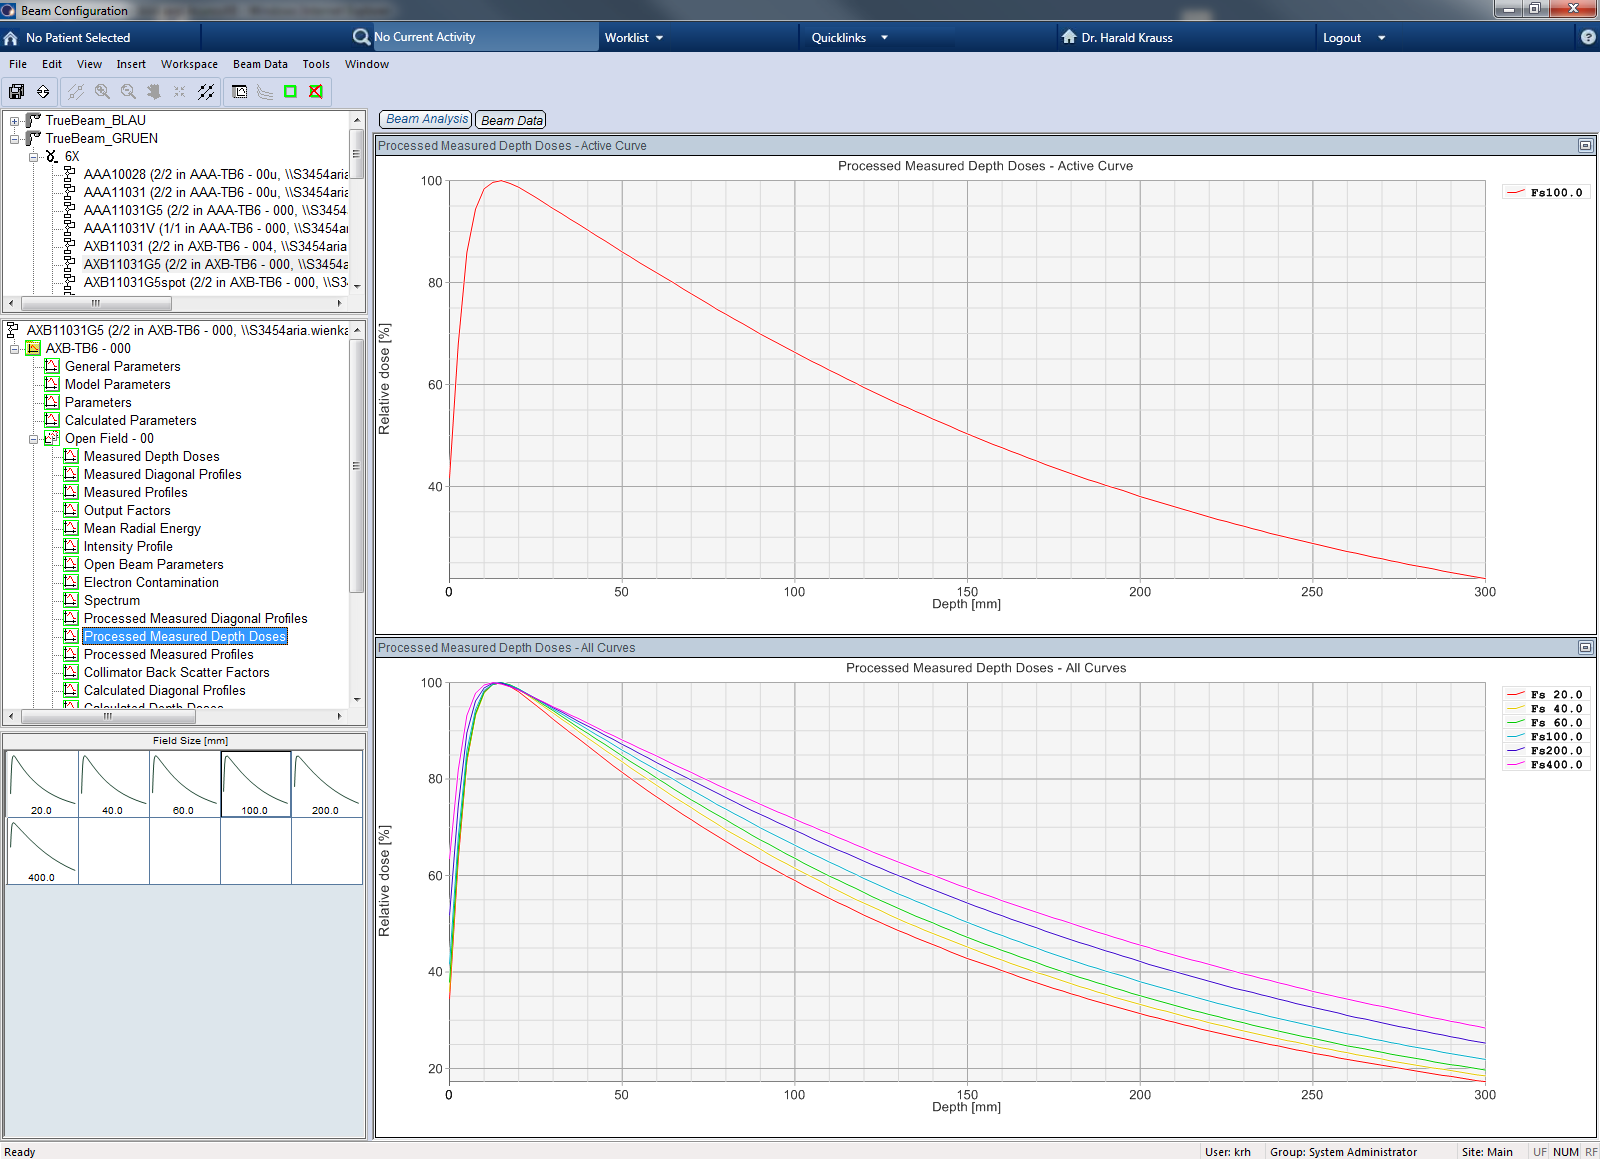
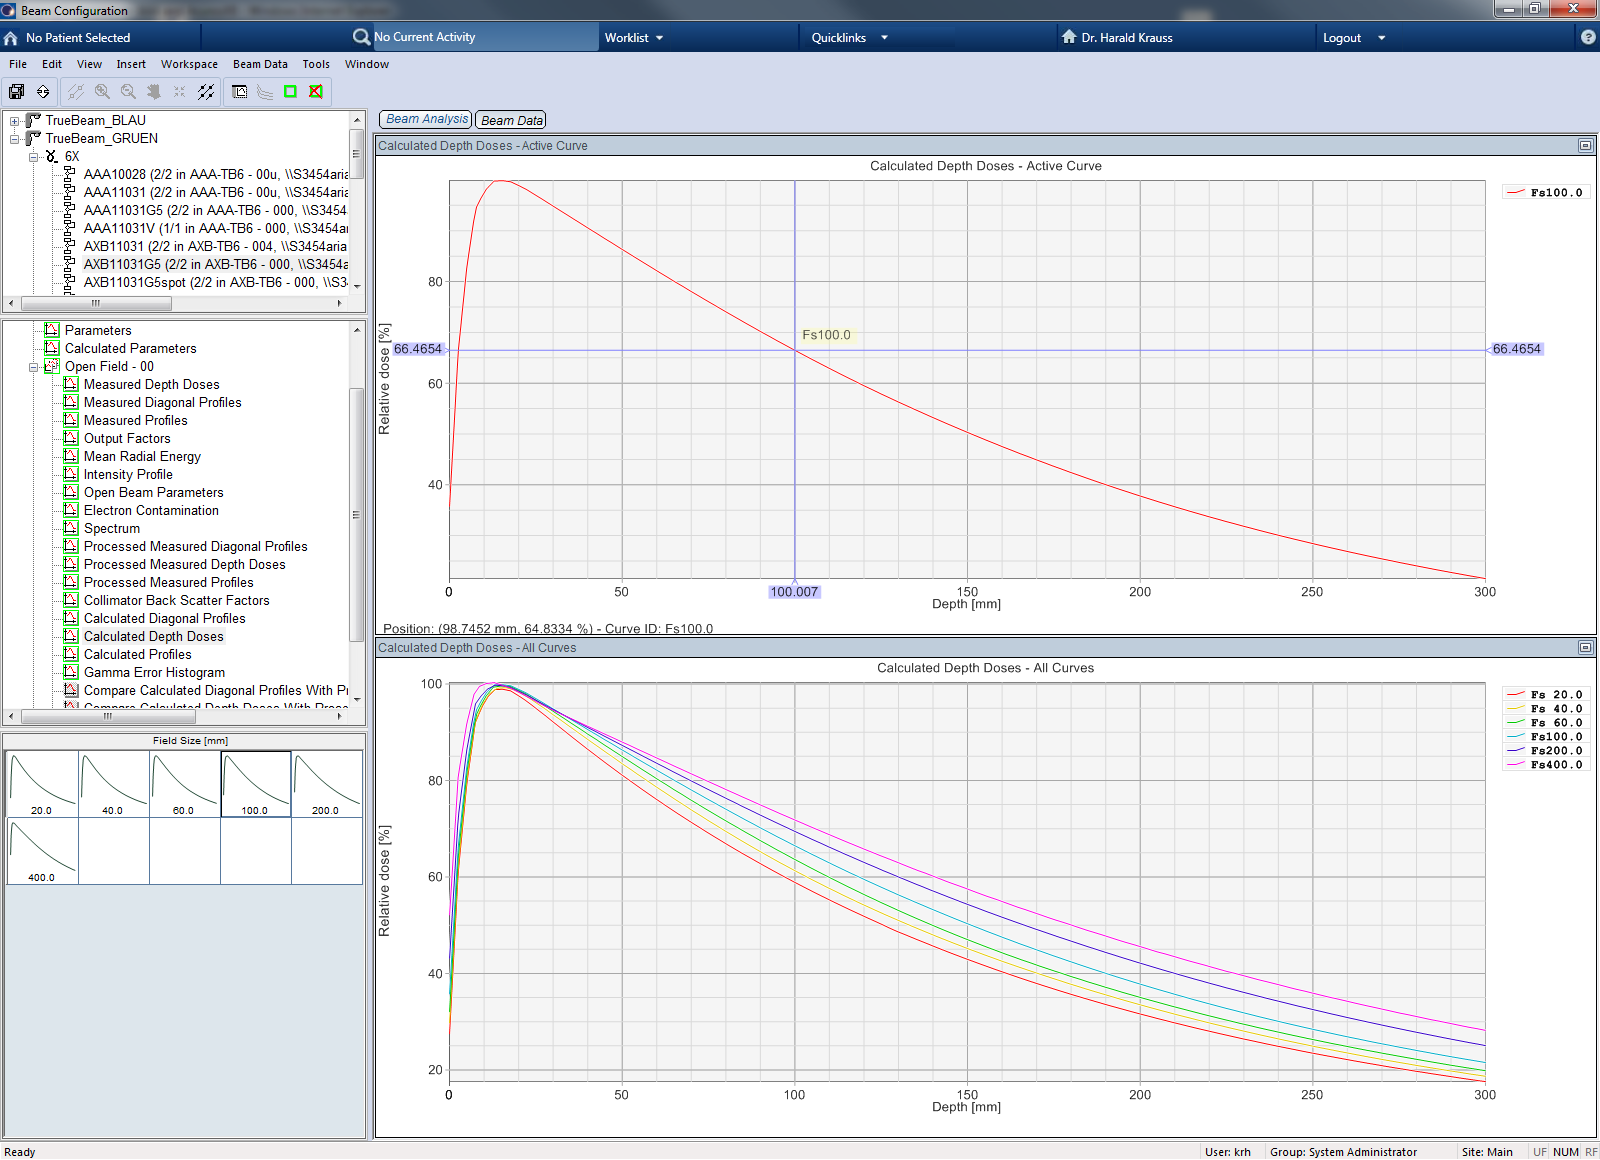
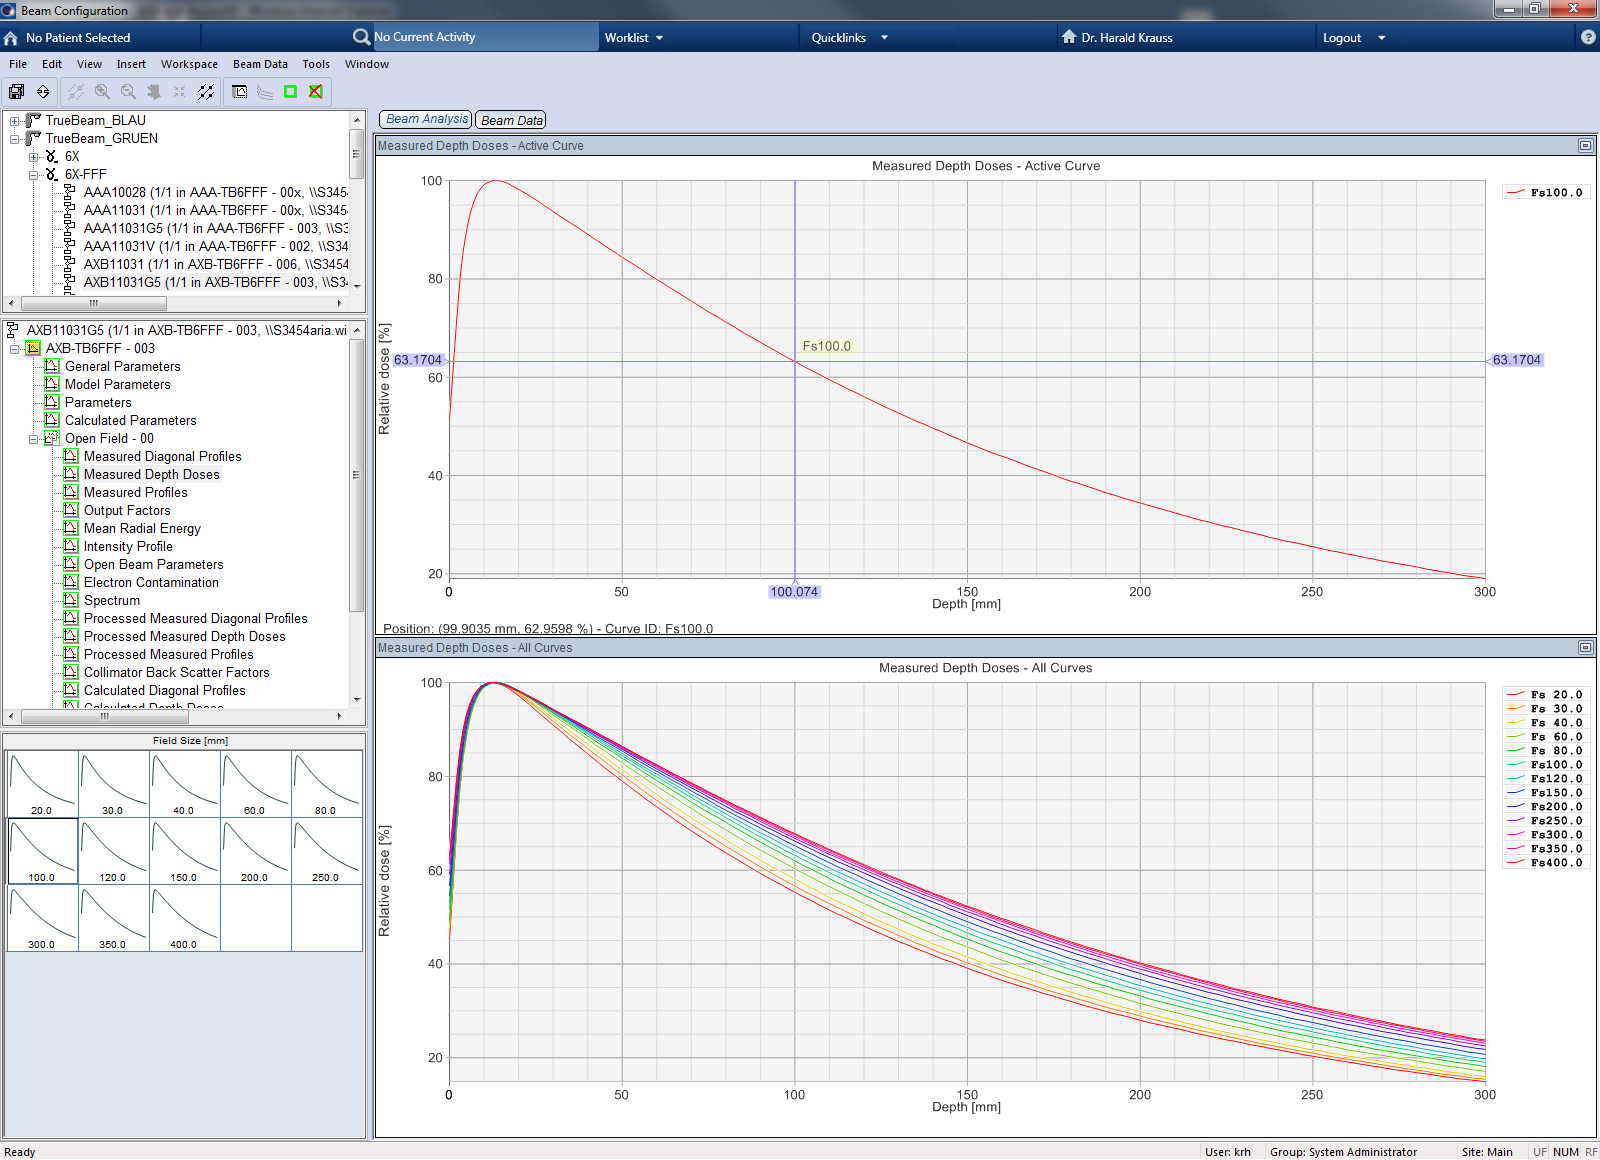
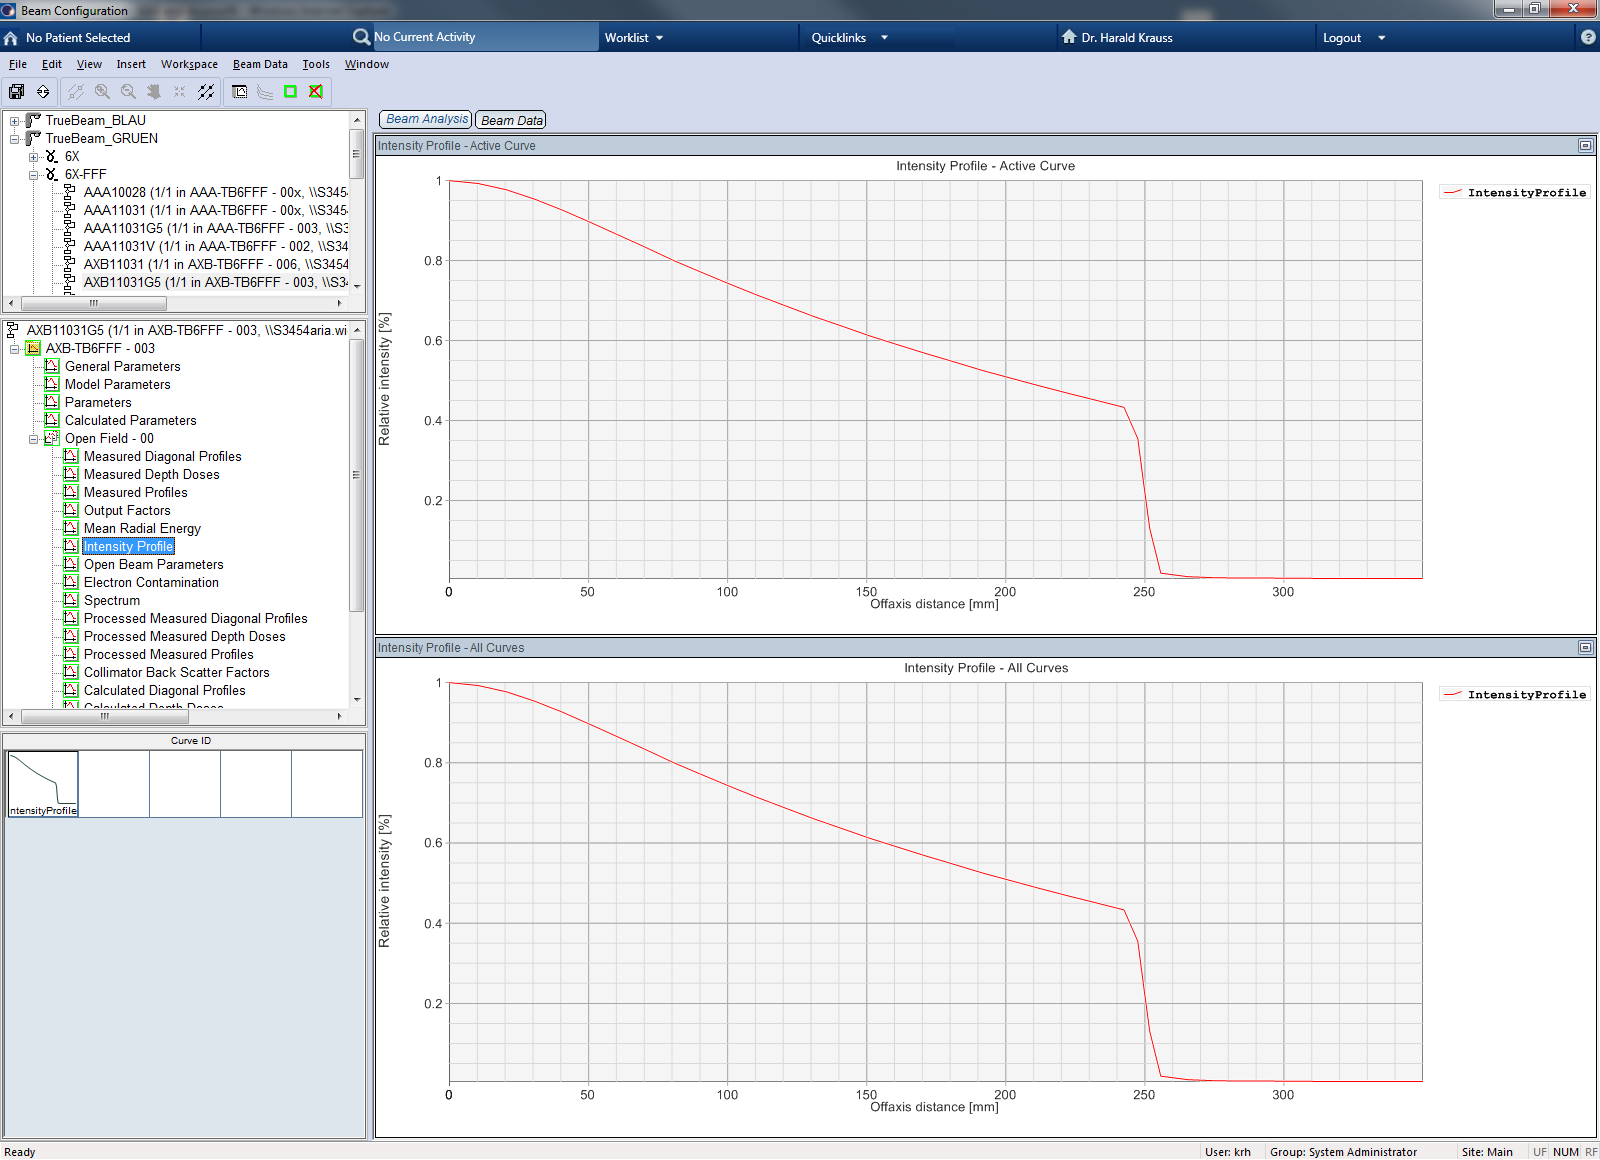
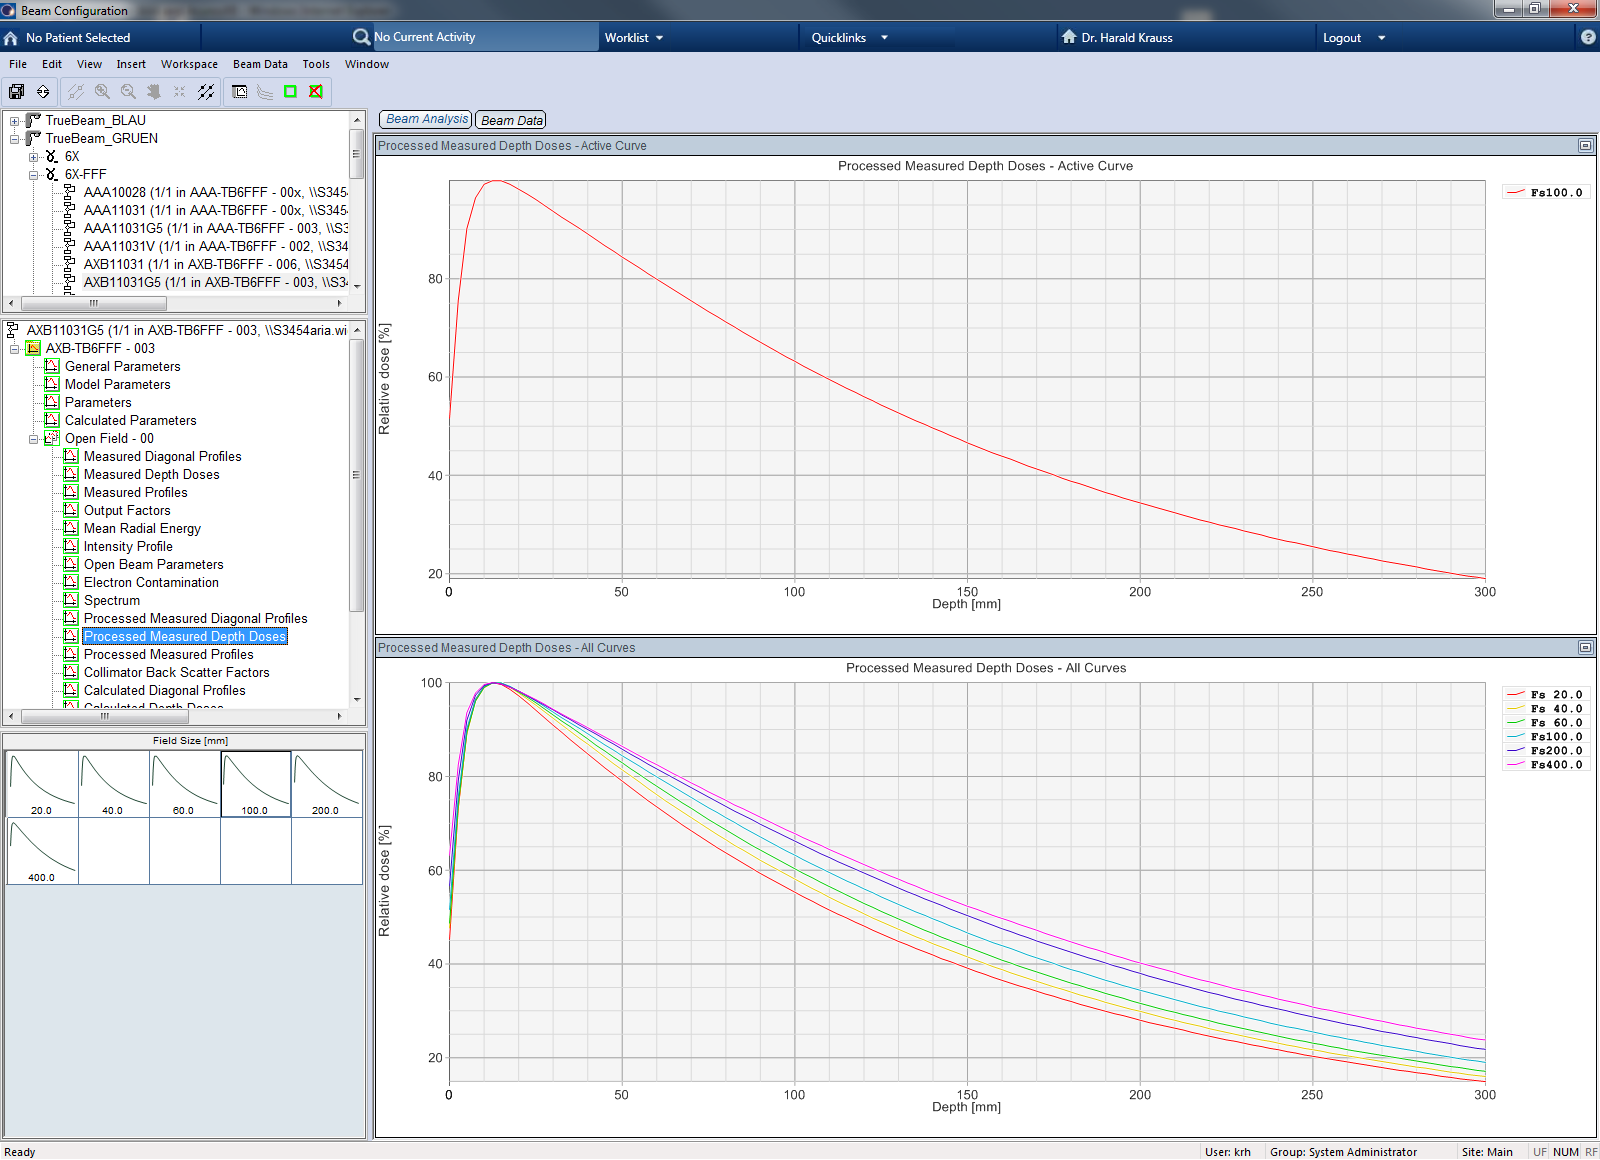
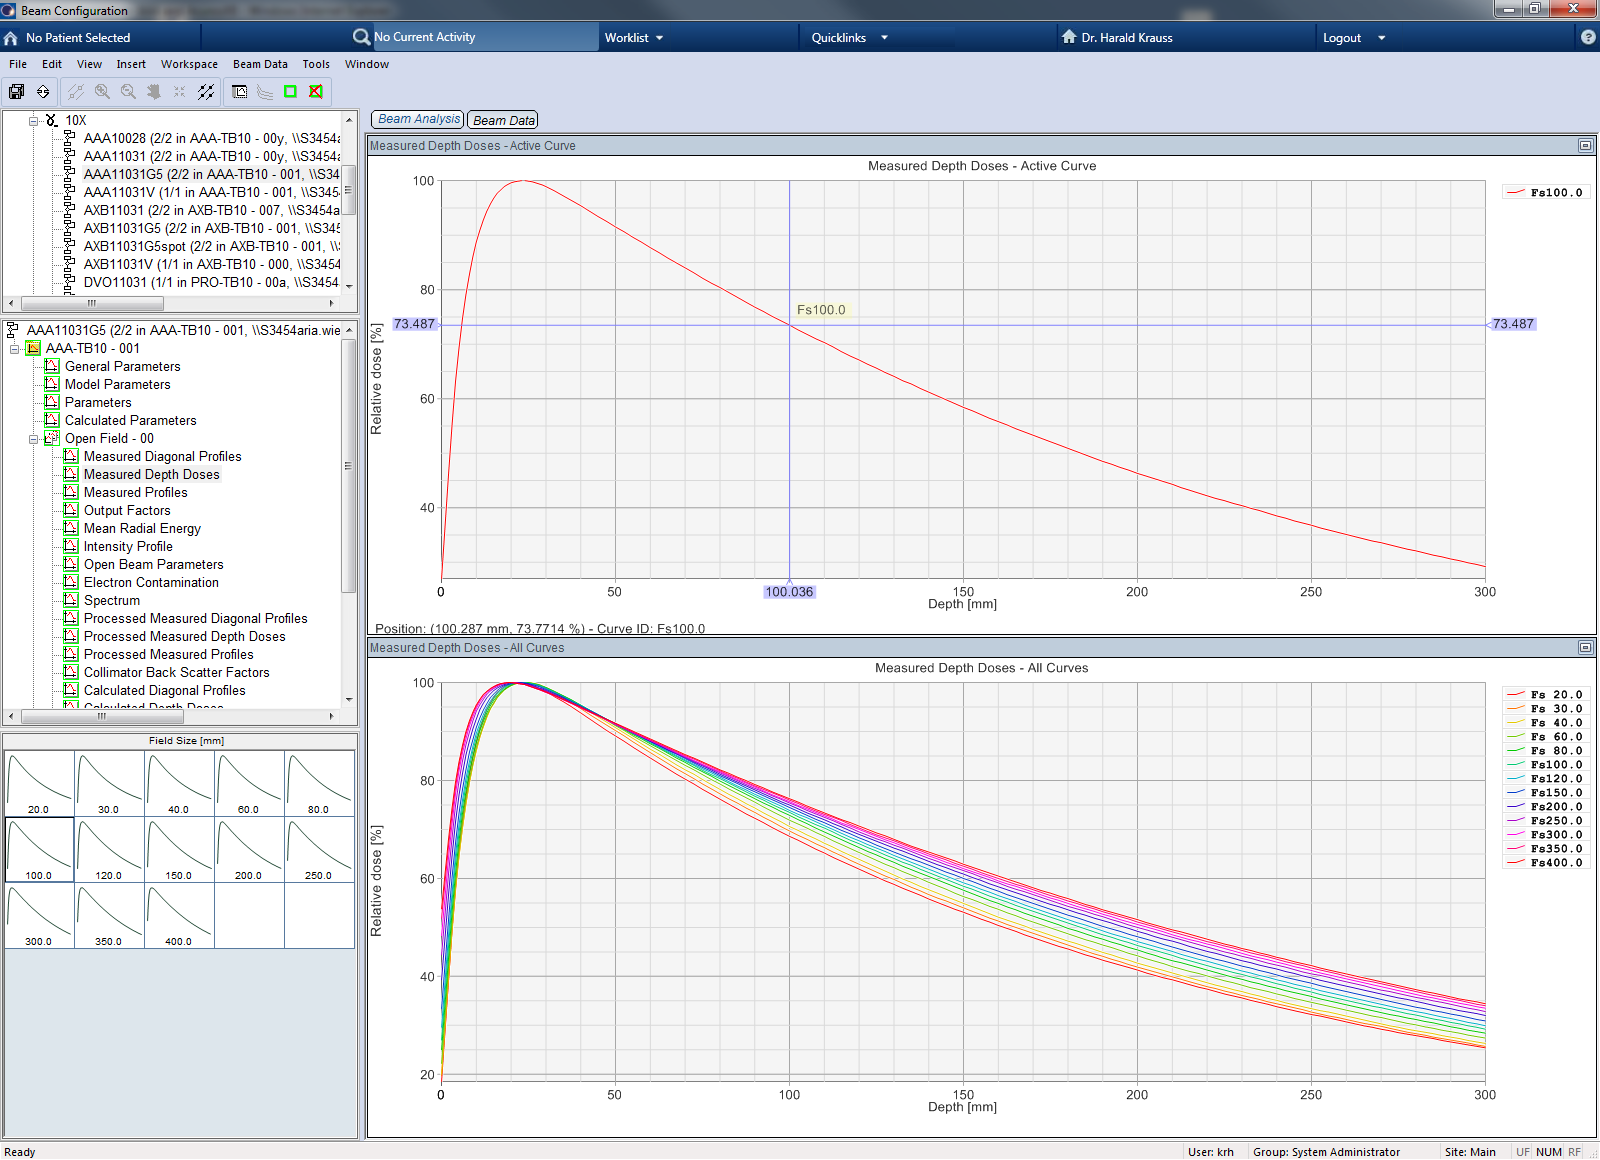
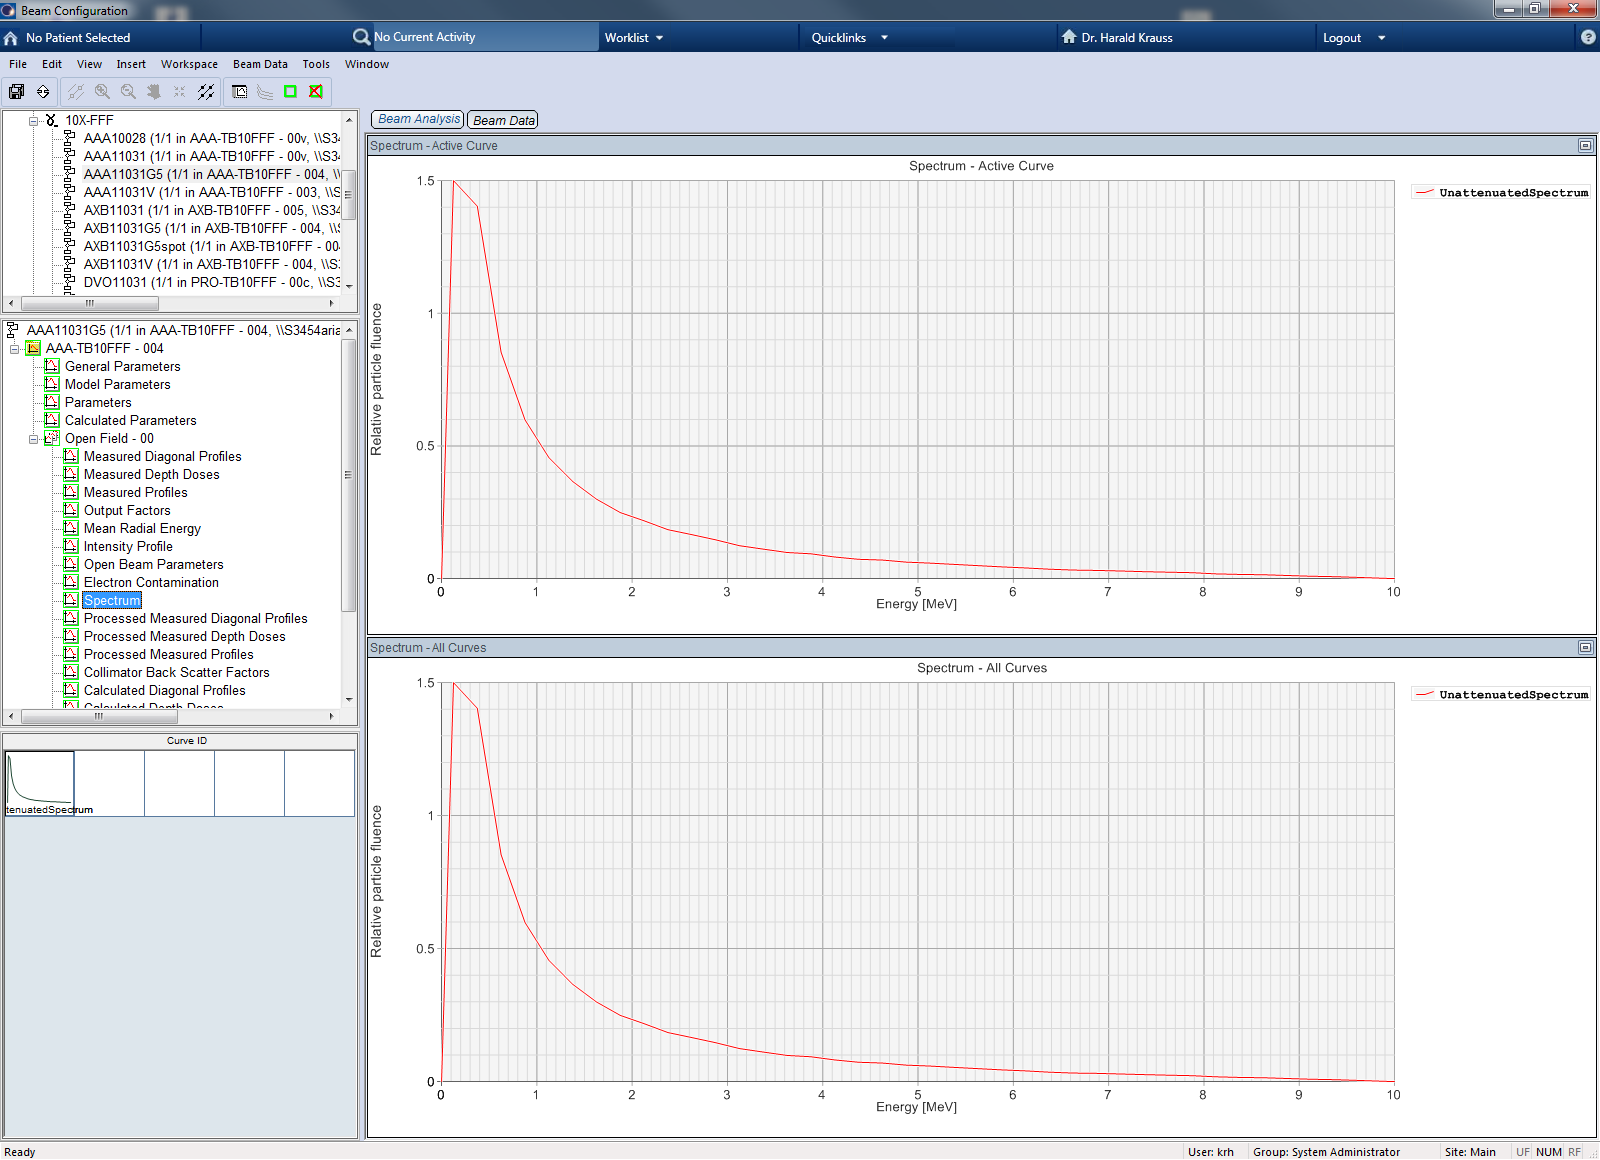
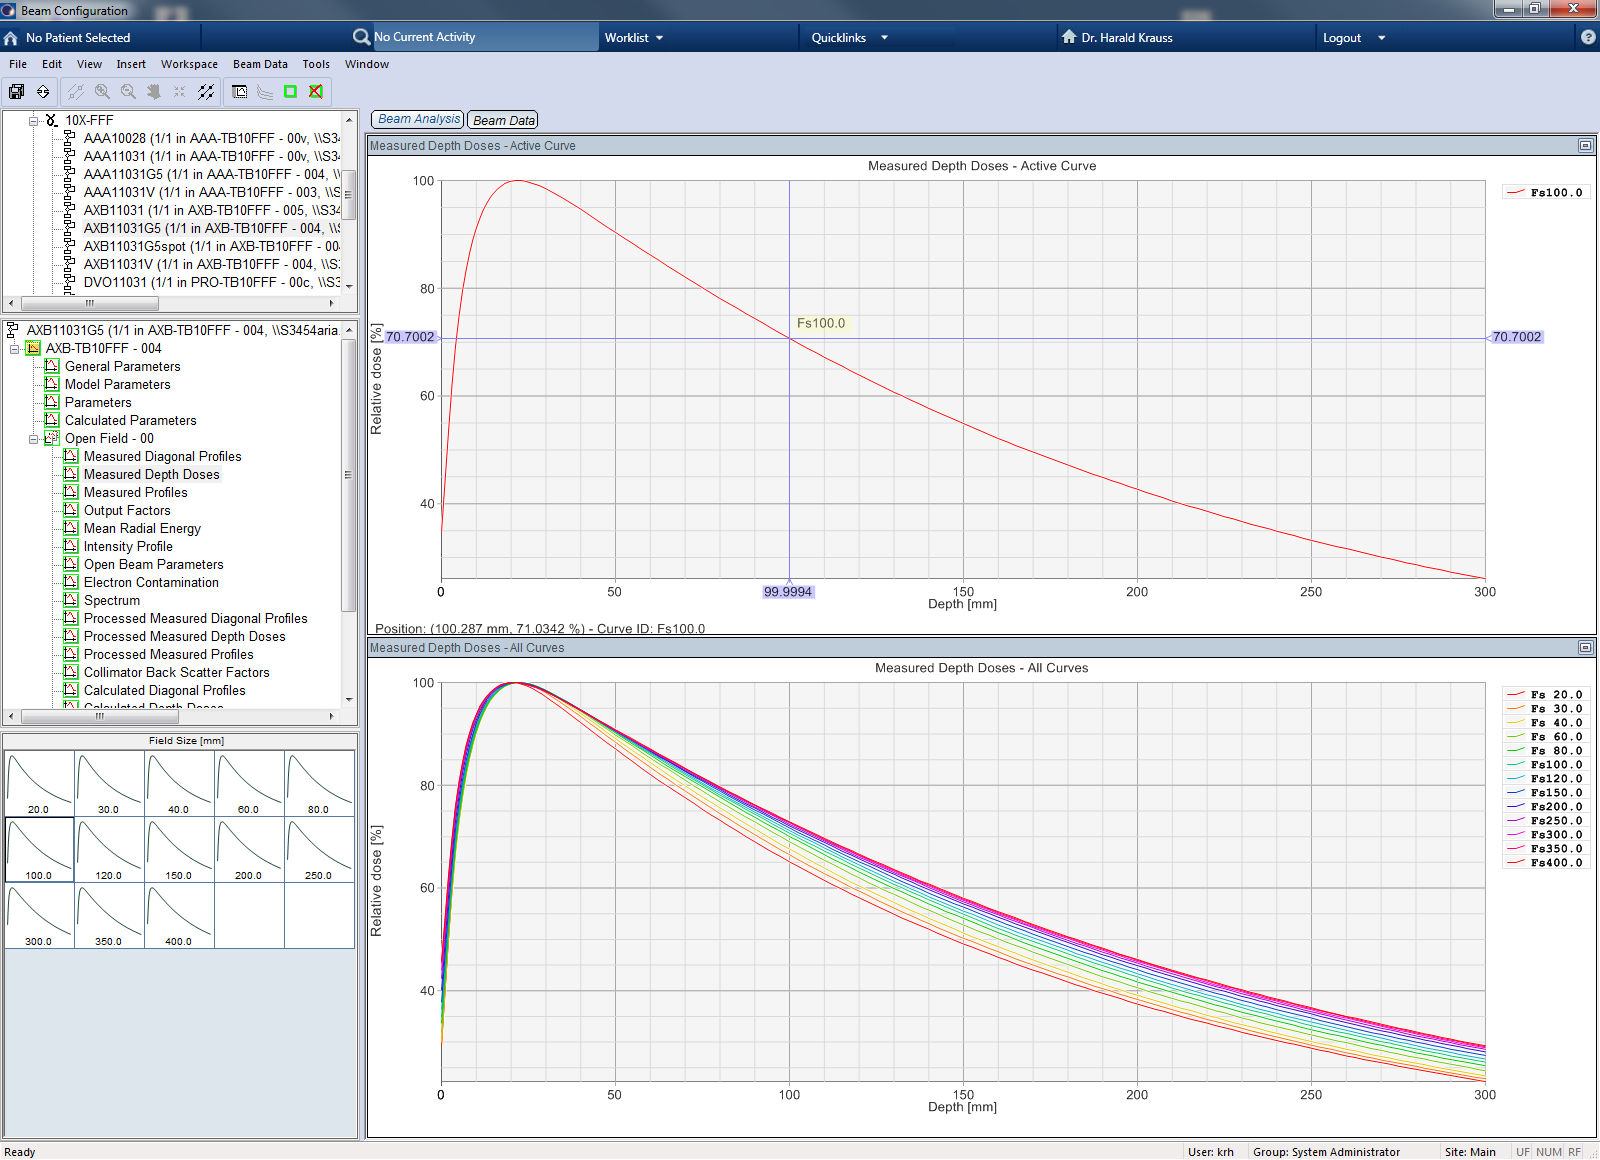
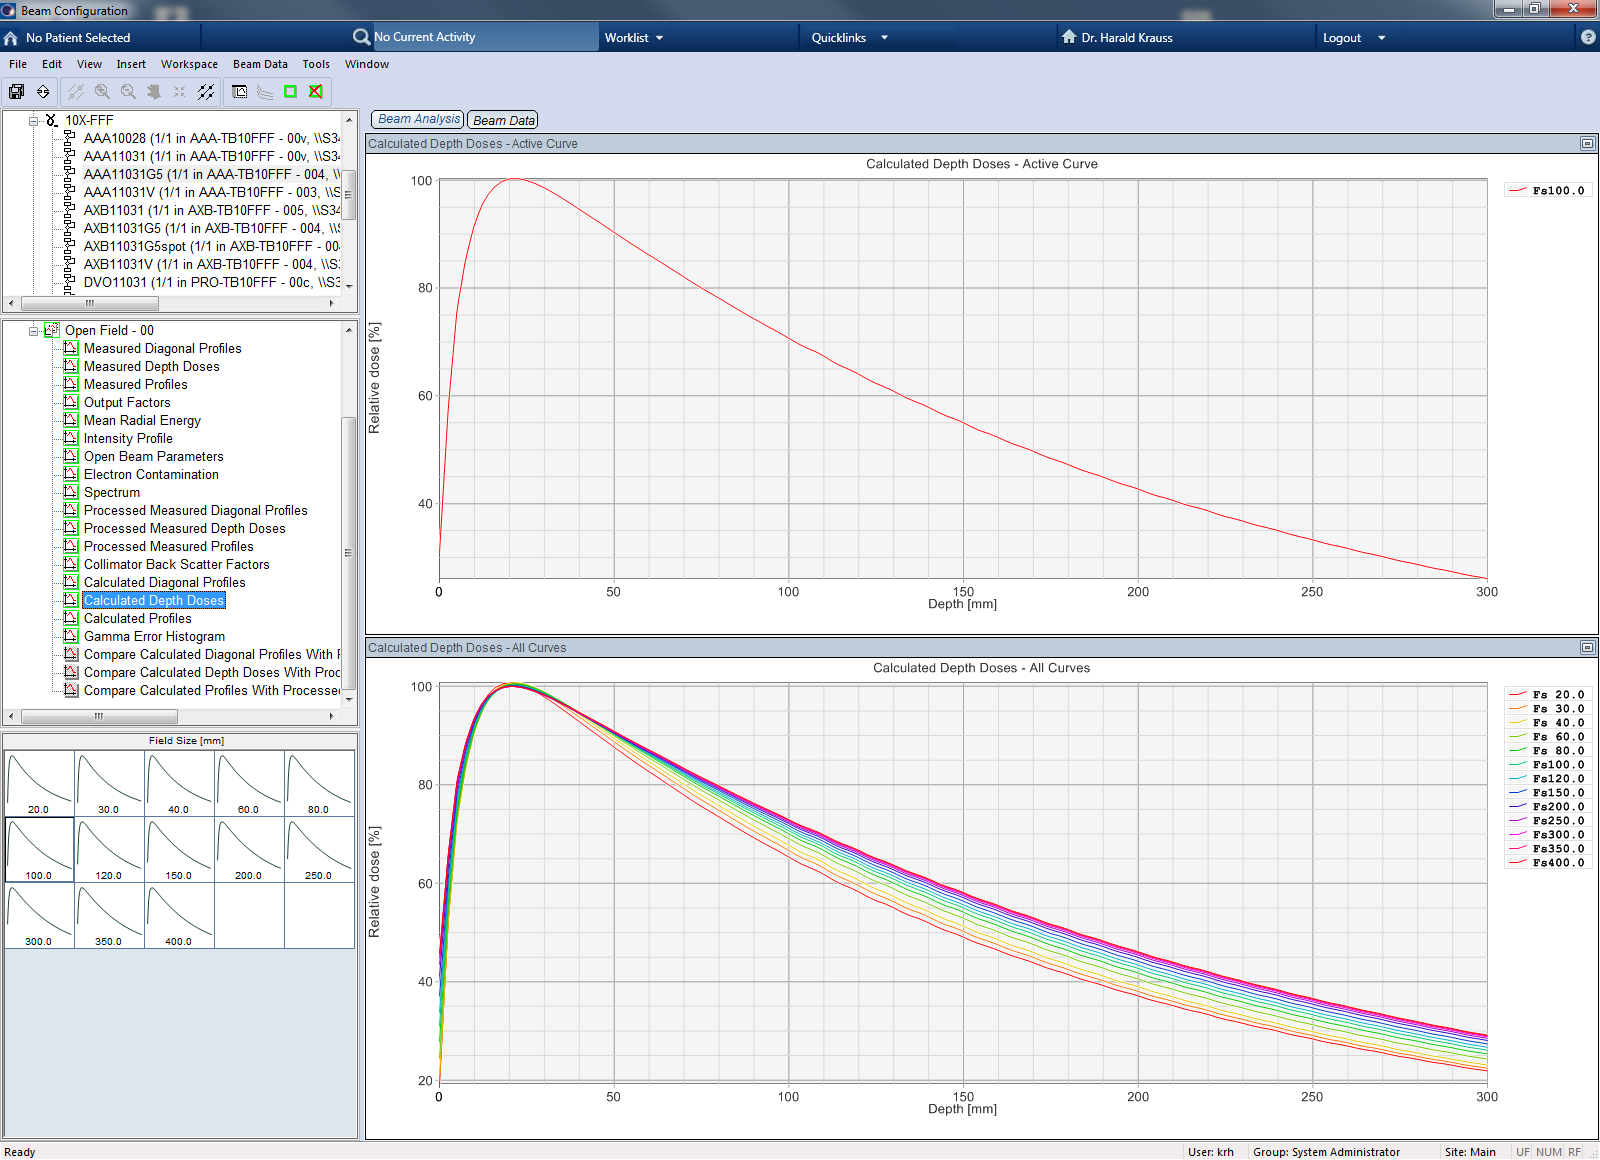
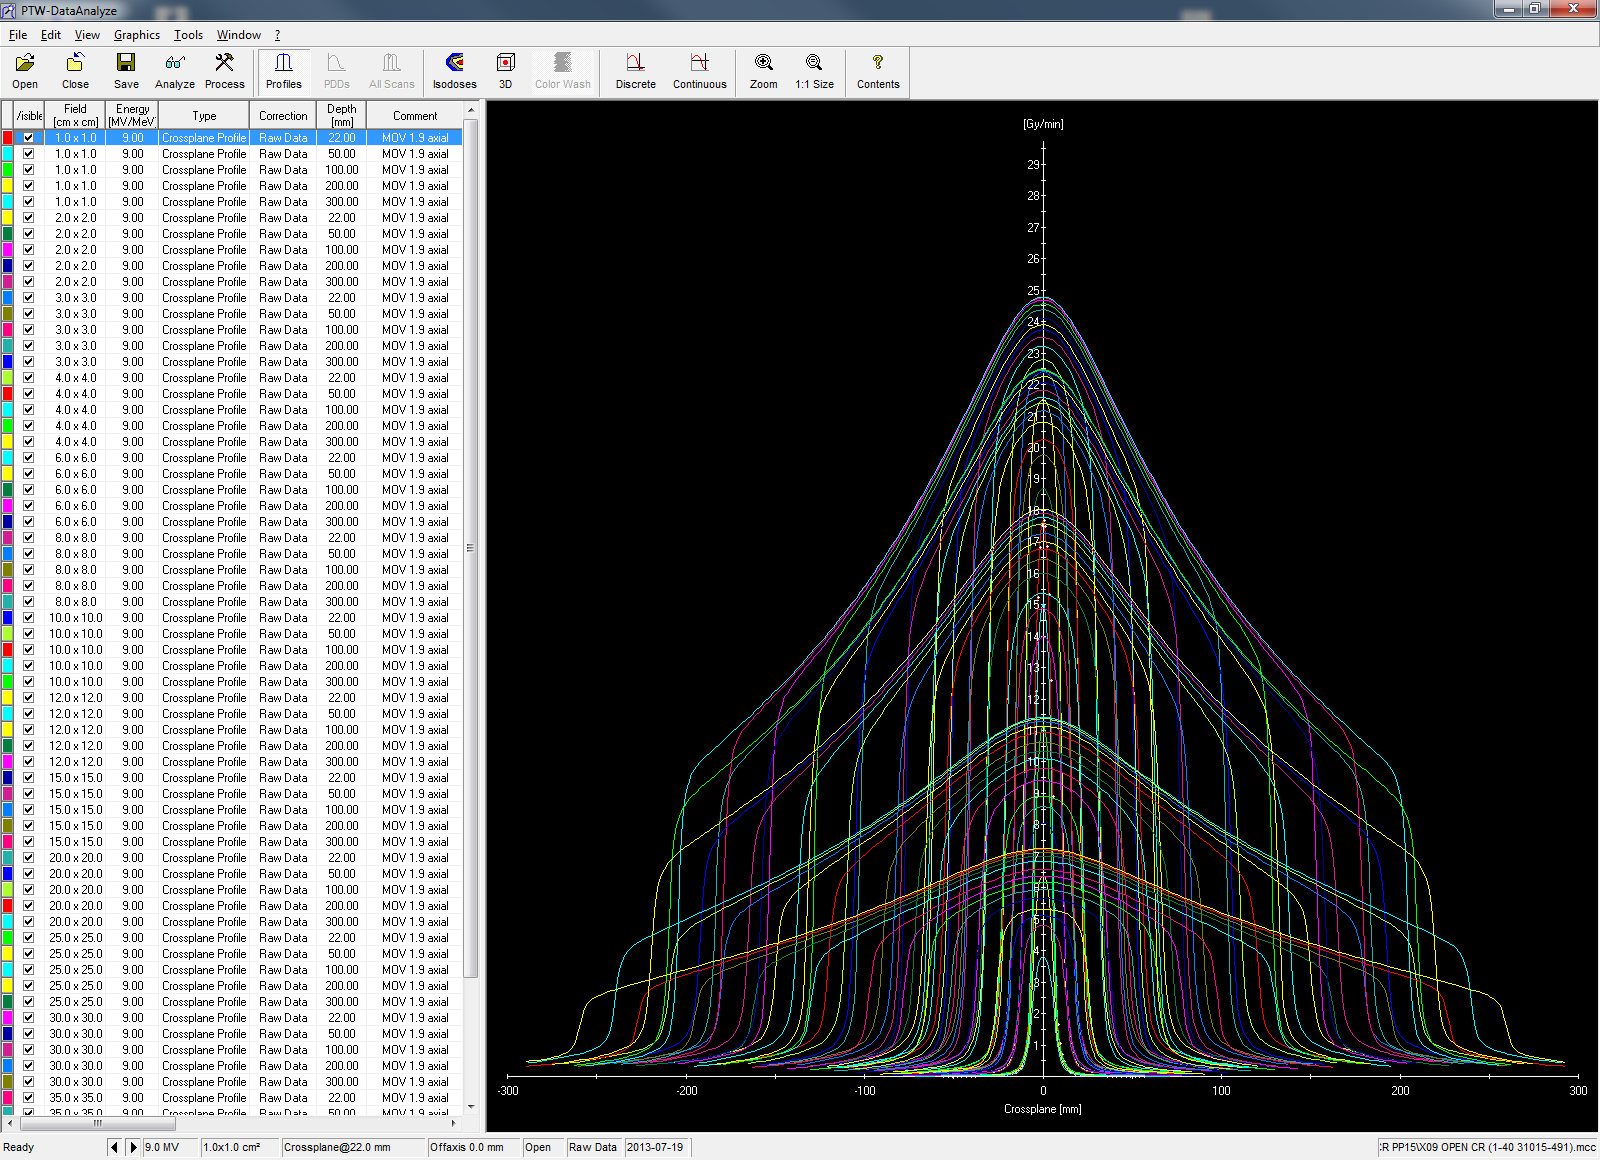
Here a plot of the raw 6FFF data:
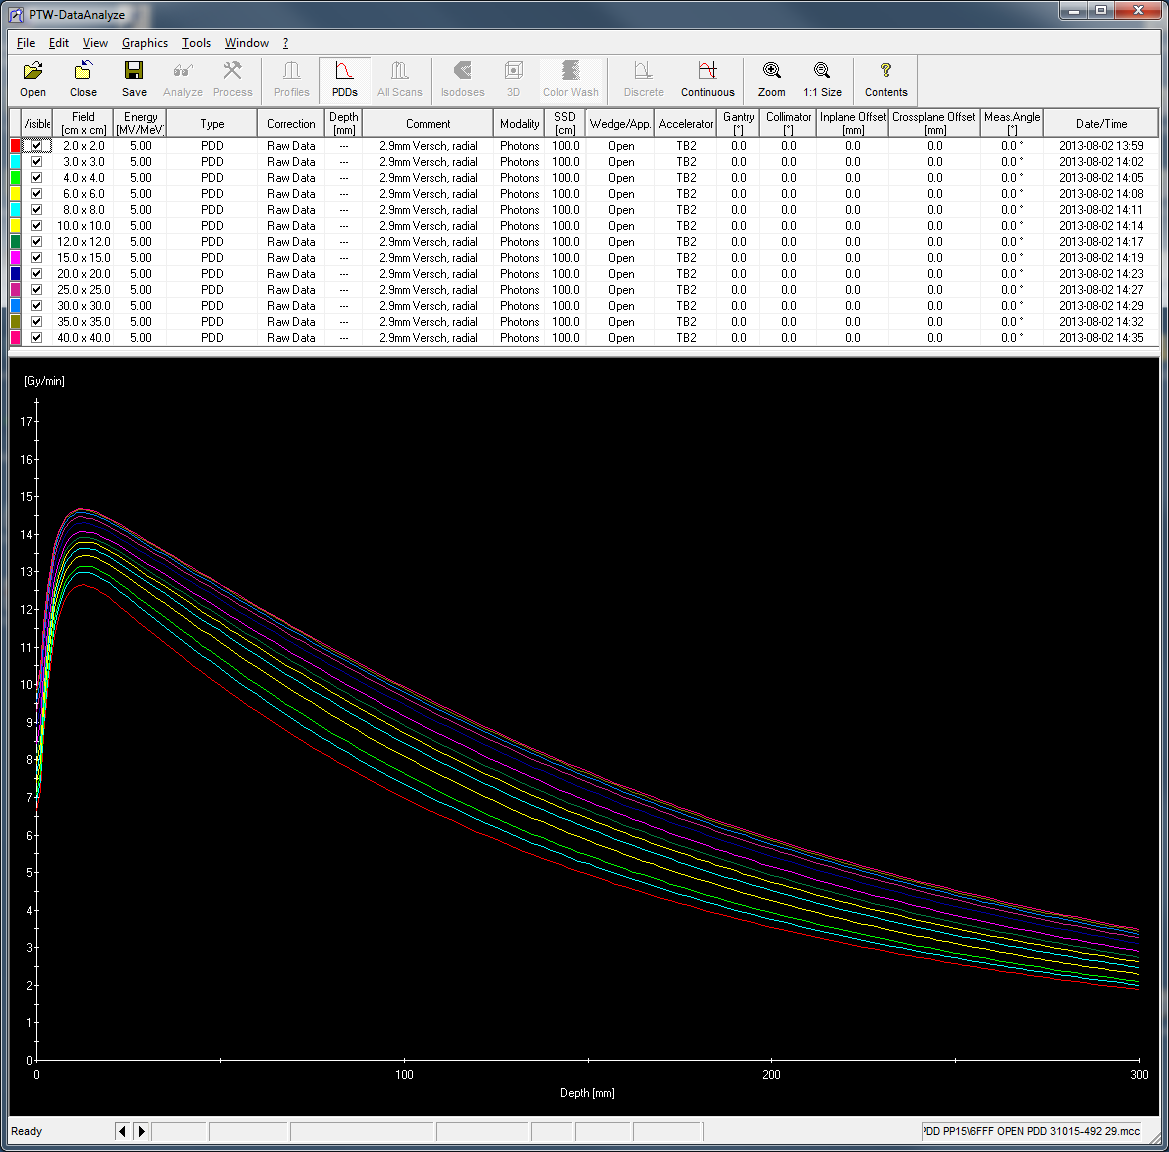
Note that in MEPHYSTO software, we assigned the 6FFF energy the label "5" (10FFF has "9") , because characters may not be used when naming energies.
Total scan time per energy was 40 minutes, total session time on Aug 2 was 3:50 hours for all 5 photon energies.
Dmax Results
With the PP15, the following dmax depths for the 10 x 10 field were determined:
- 14 mm (X6)
- 13 mm (6FFF)
- 23 mm (X10)
- 22 mm (10FFF)
- 28 mm (X15).
On one hand, the dmax depths serve as reference depths for the linac output calibration. We calibrate our TrueBeams to deliver 1 Gy per 100 MU at an SSD of 100 cm in depth of dmax for the 10 x 10 cm reference field, following the Varian recommendation.
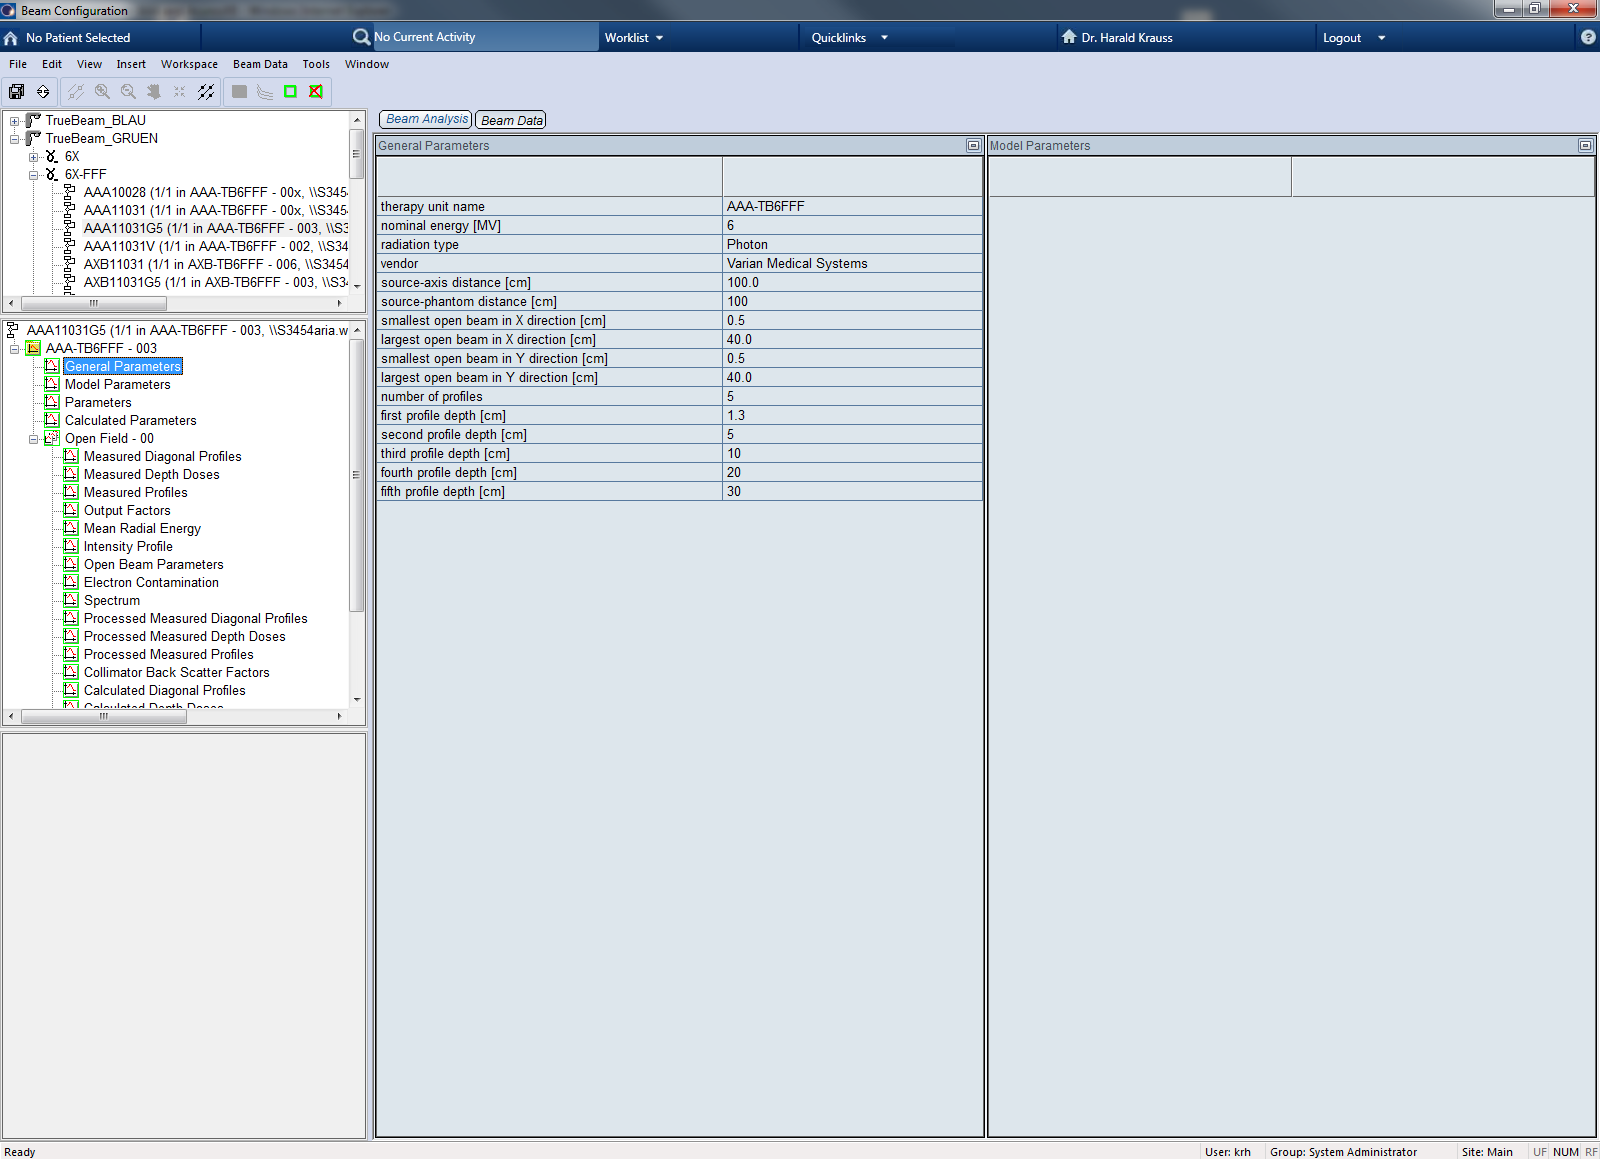
On the other hand, the first profile depth of the crossplane scans (total 5 depths) is typically at dmax. This is not exactly fulfilled in our Eclipse data for X10 and X15 (see below).
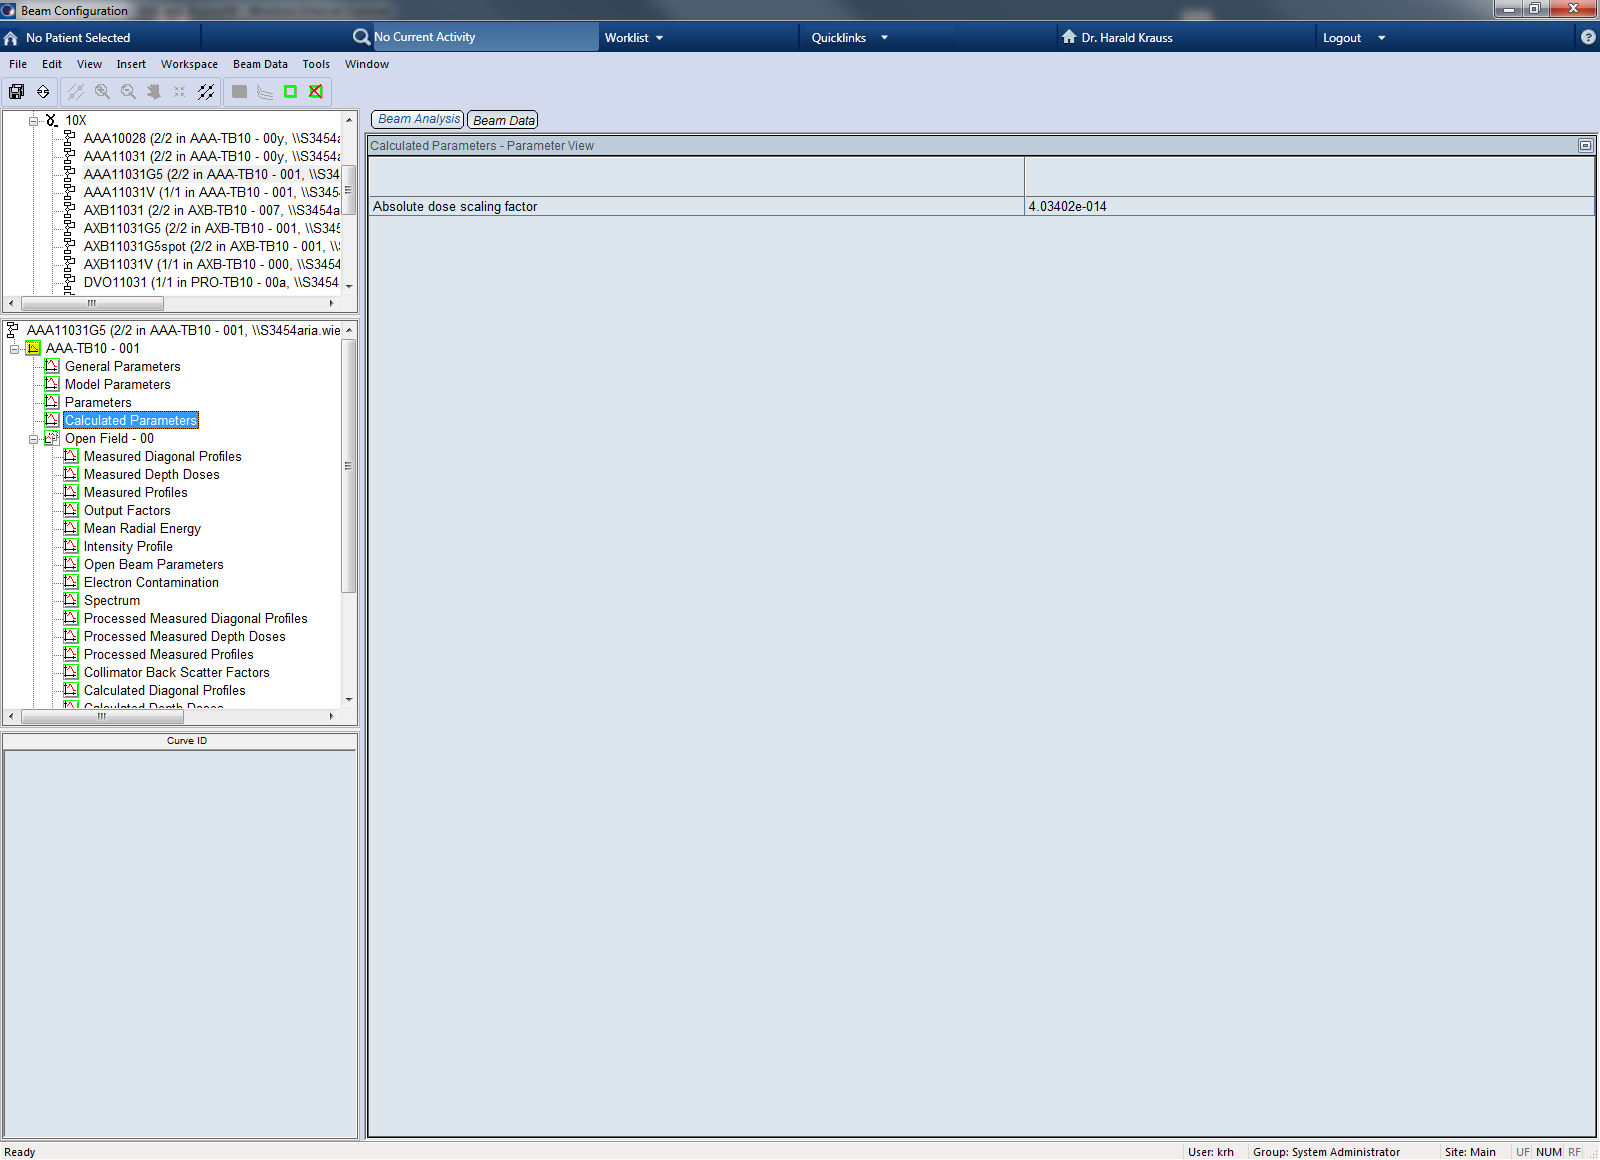
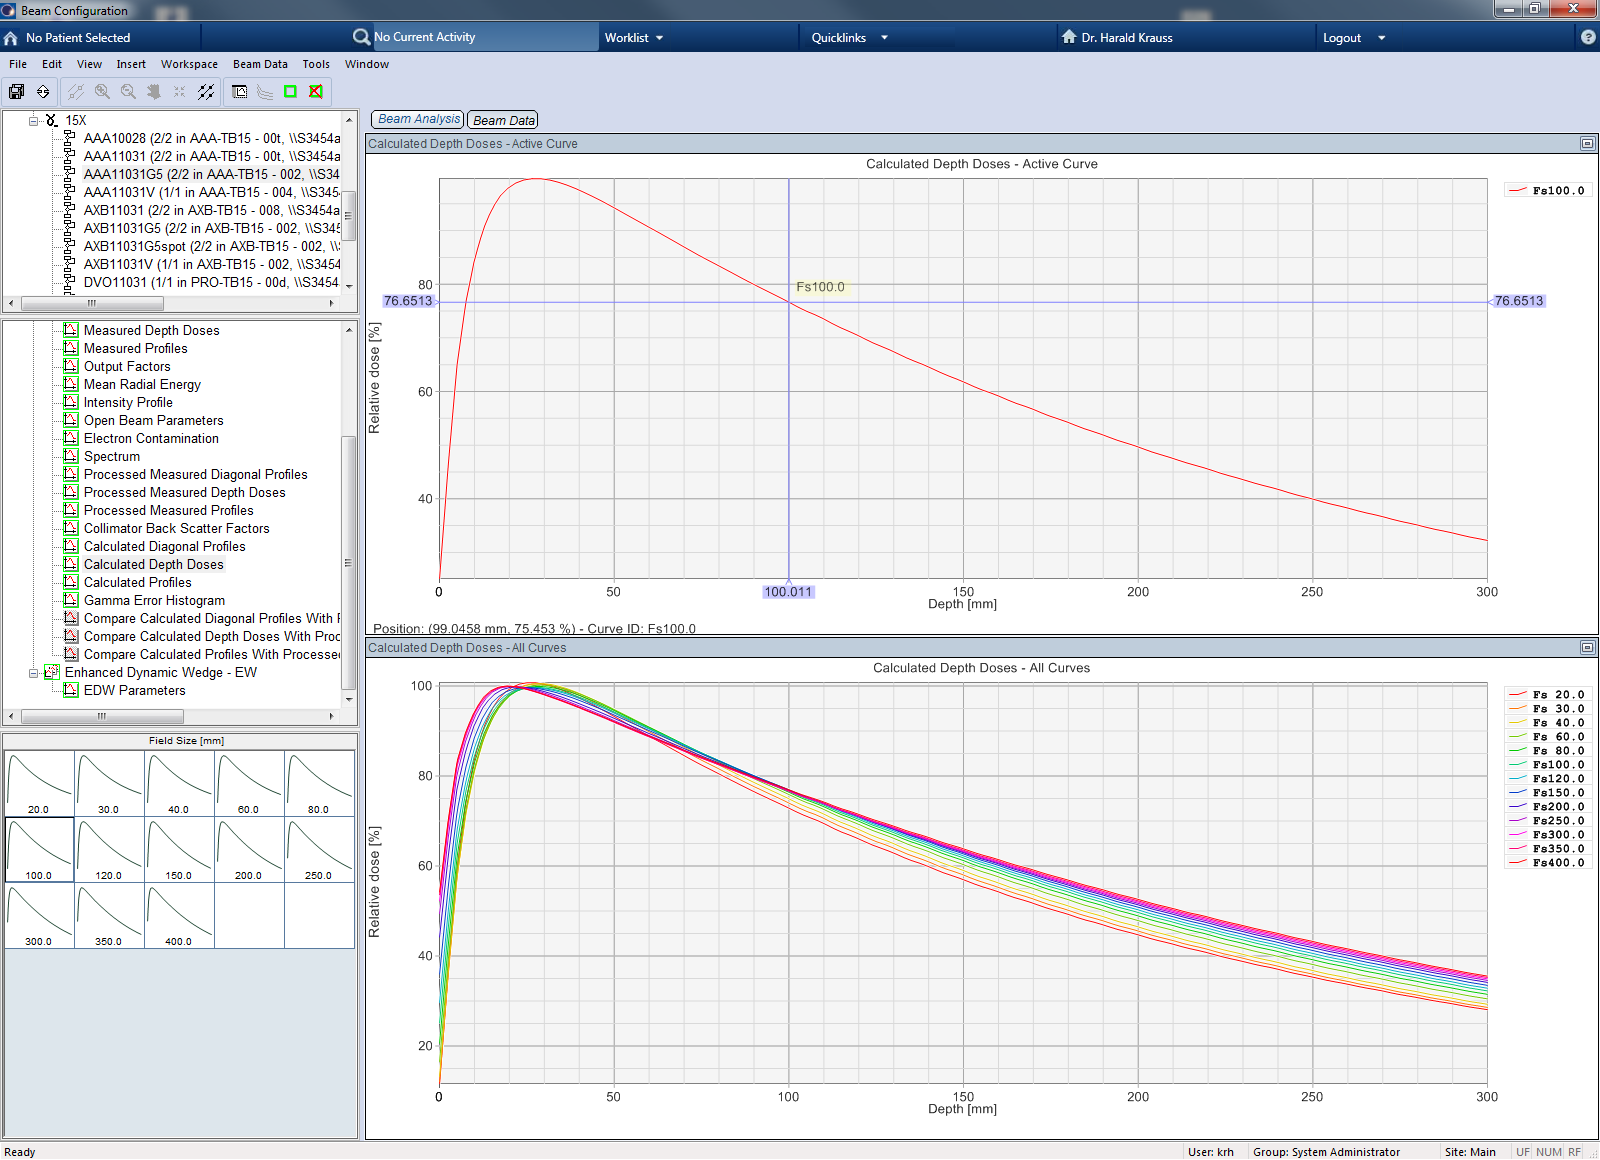
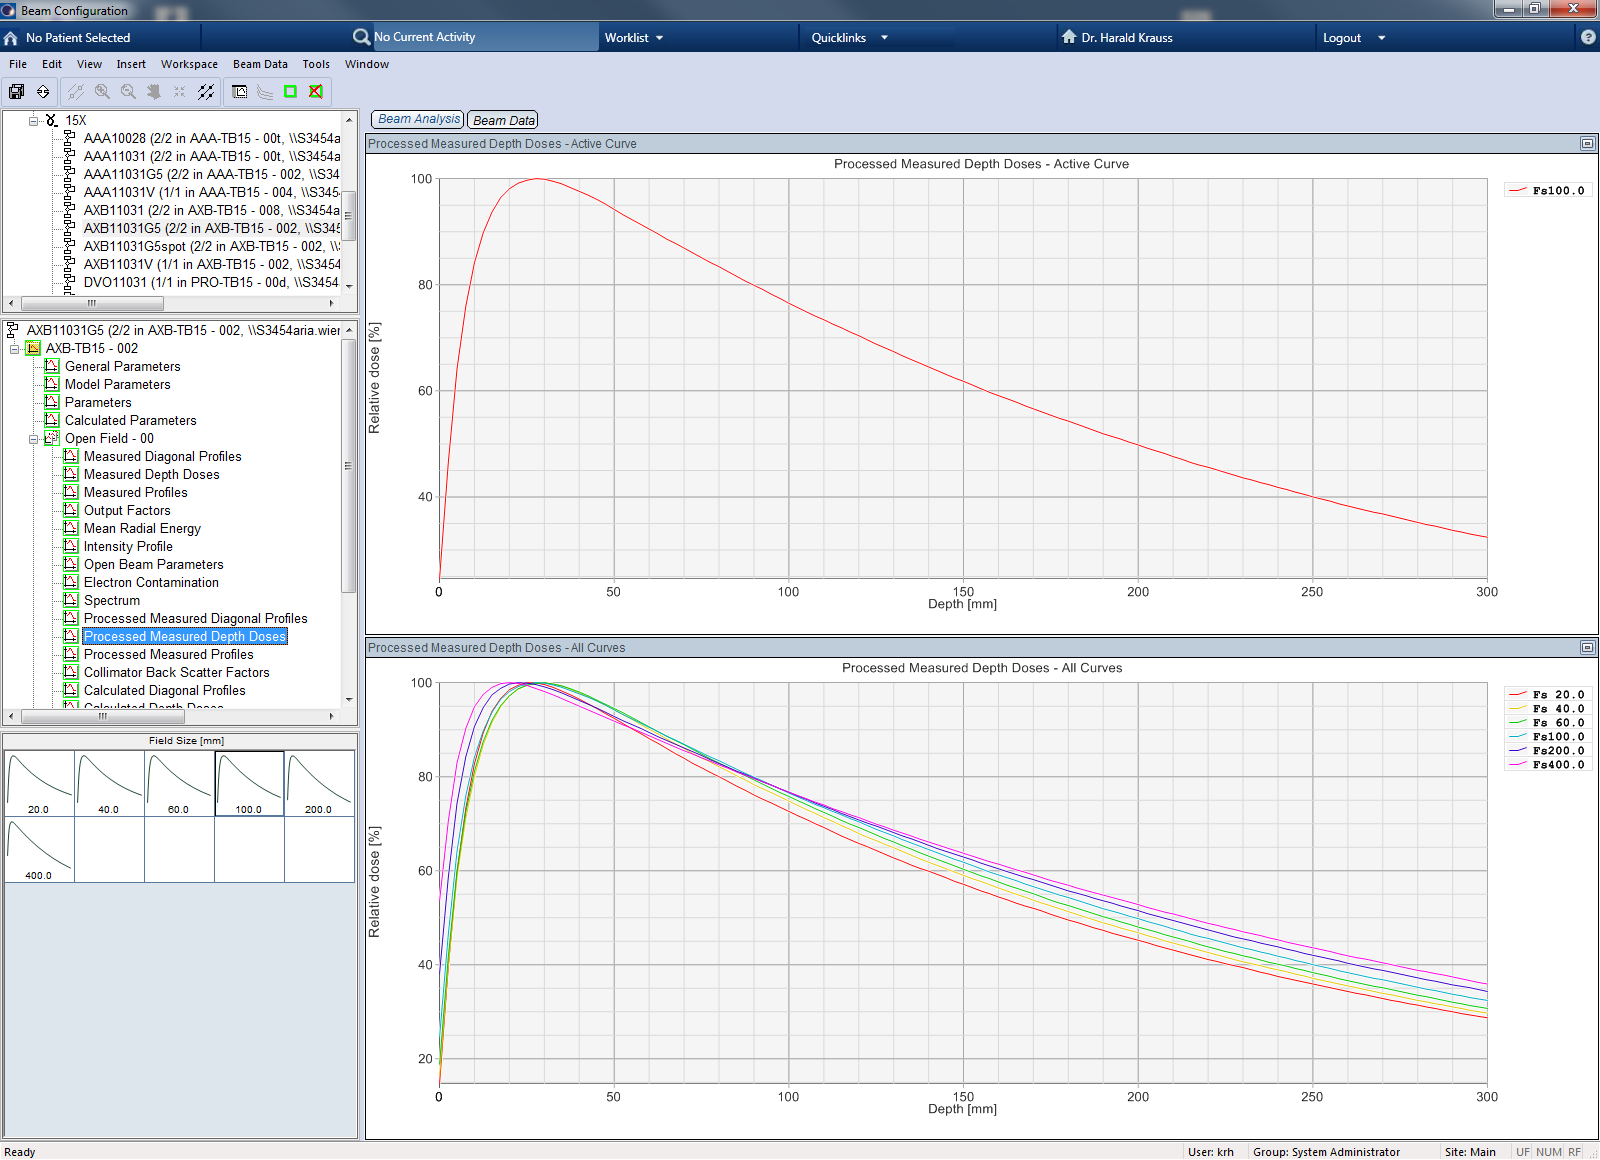
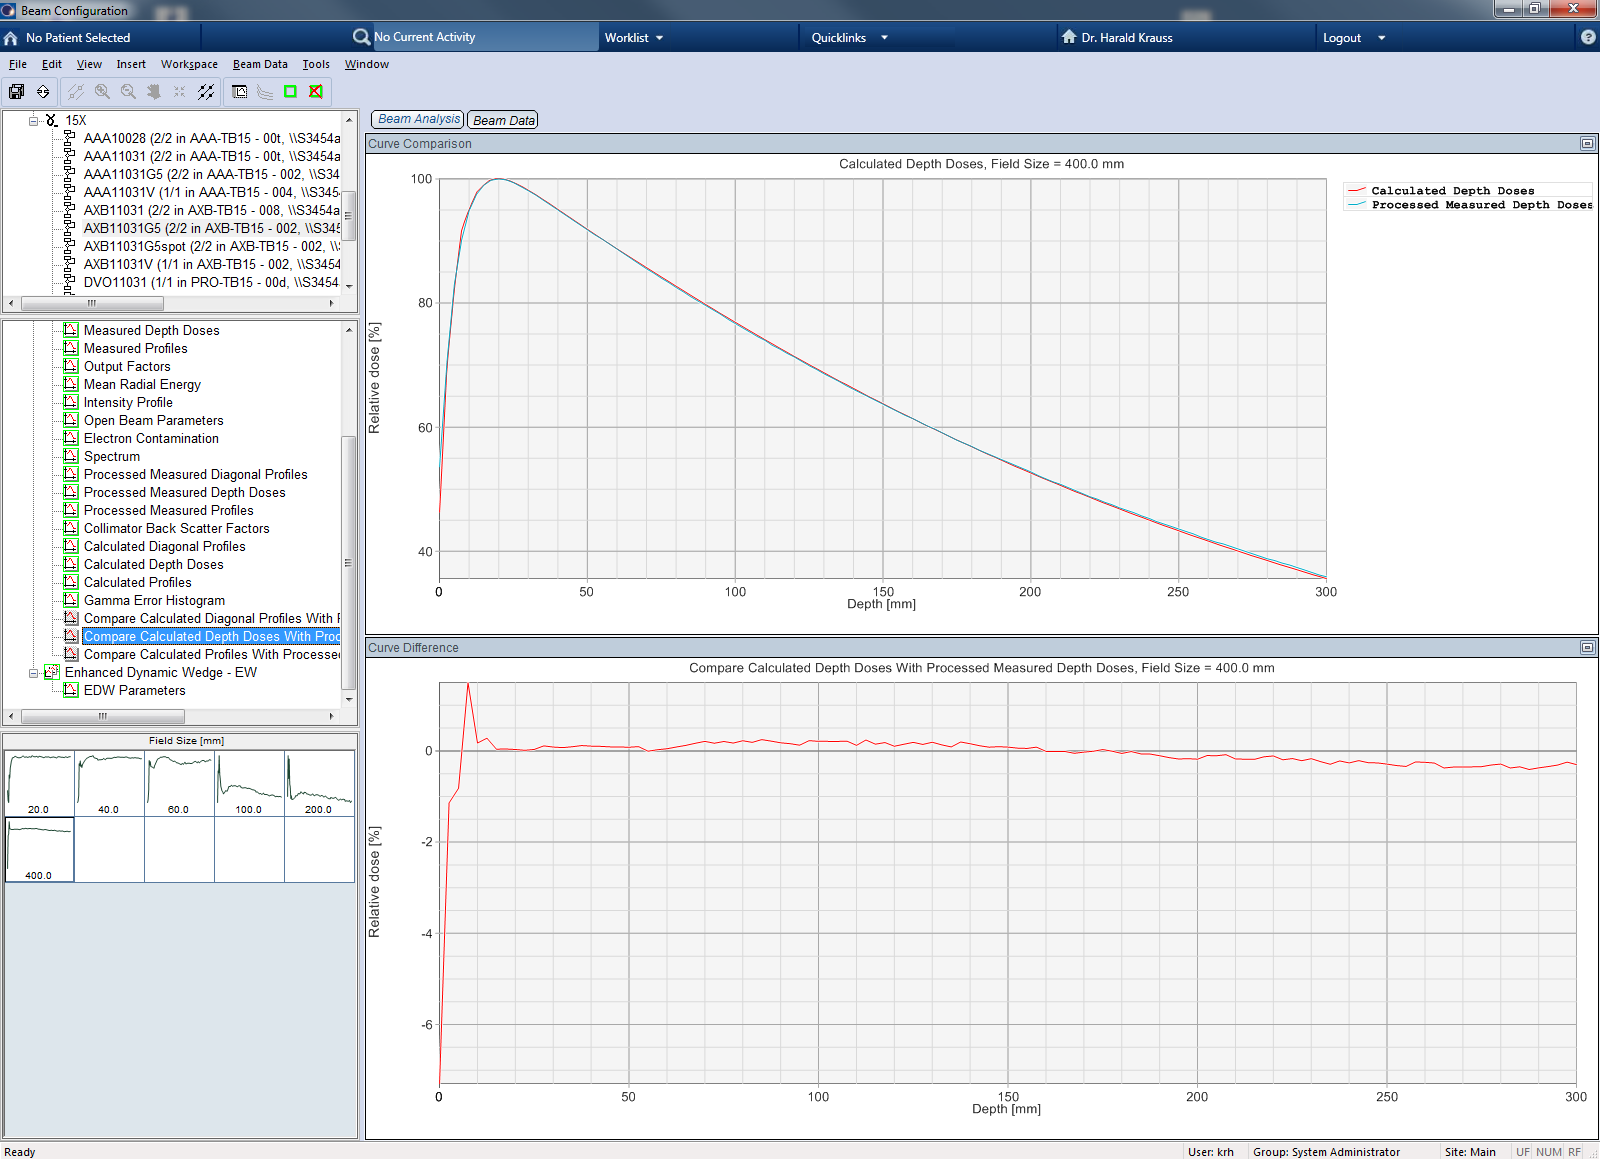
Post-Processing
Three types of post-processing were applied to the raw data, before the curves were formatted for Eclipse:
- mod0: The point at depth 0 (water surface) was computed by linear extrapolation from the points at 1 and 2 mm depth.
- sm2: From a depth shortly before dmax down to maximum depth at 300 mm, the curves were smoothed in MEPHYSTO twice.
- ks: A saturation correction was applied to the whole curve, which depended on the local dose-per-pulse, using the method of Boag. For this, a calibration curve was generated with PTW FilmCal, which converted a measured dose rate to a corrected dose rate.
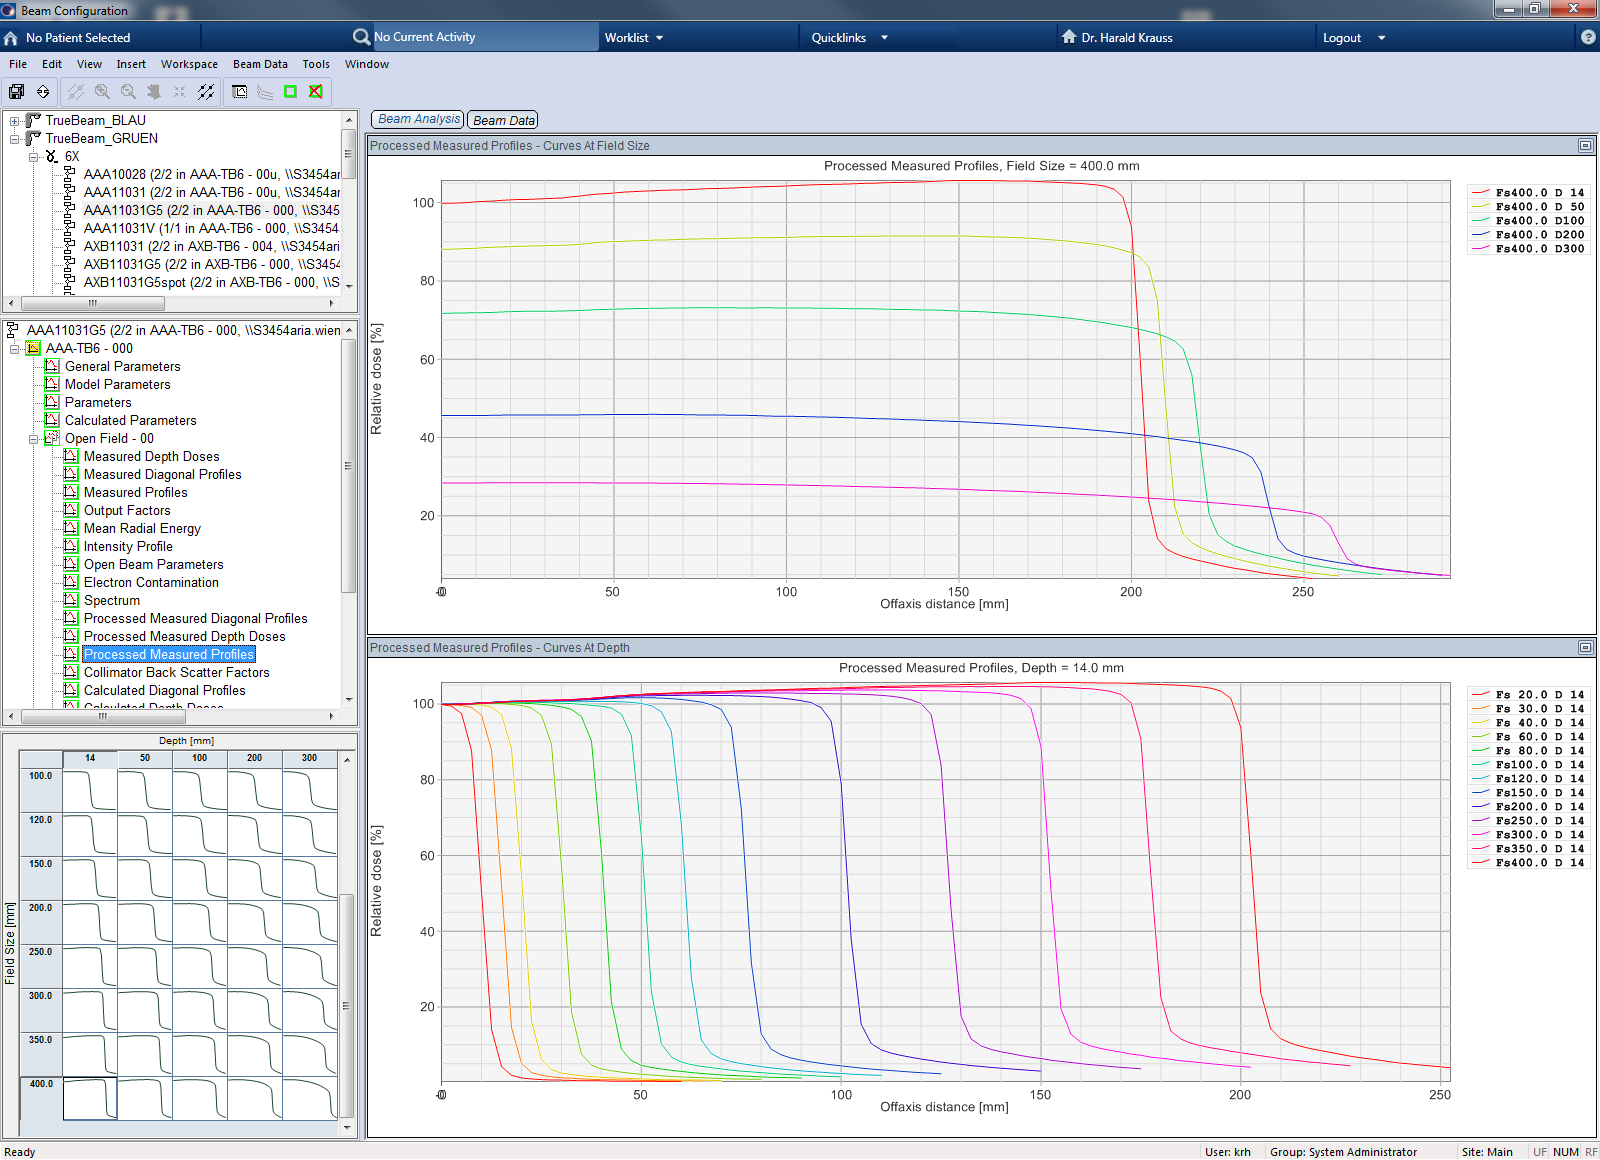
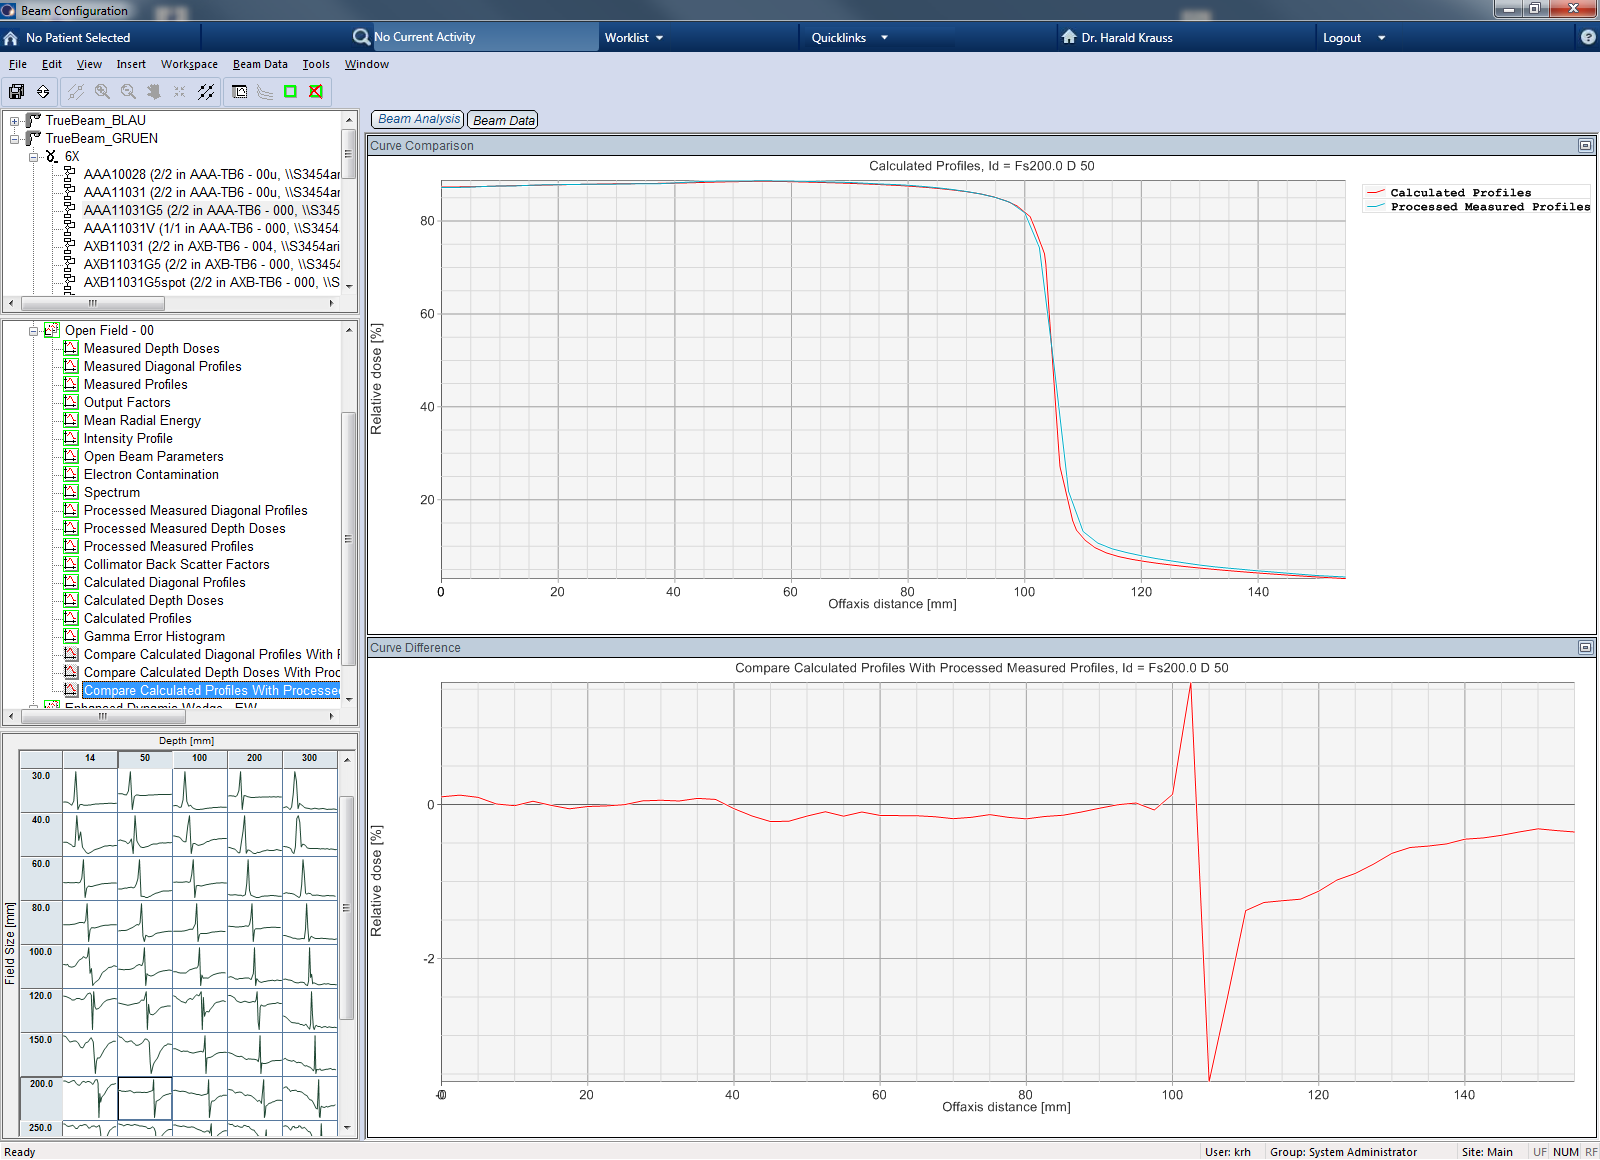
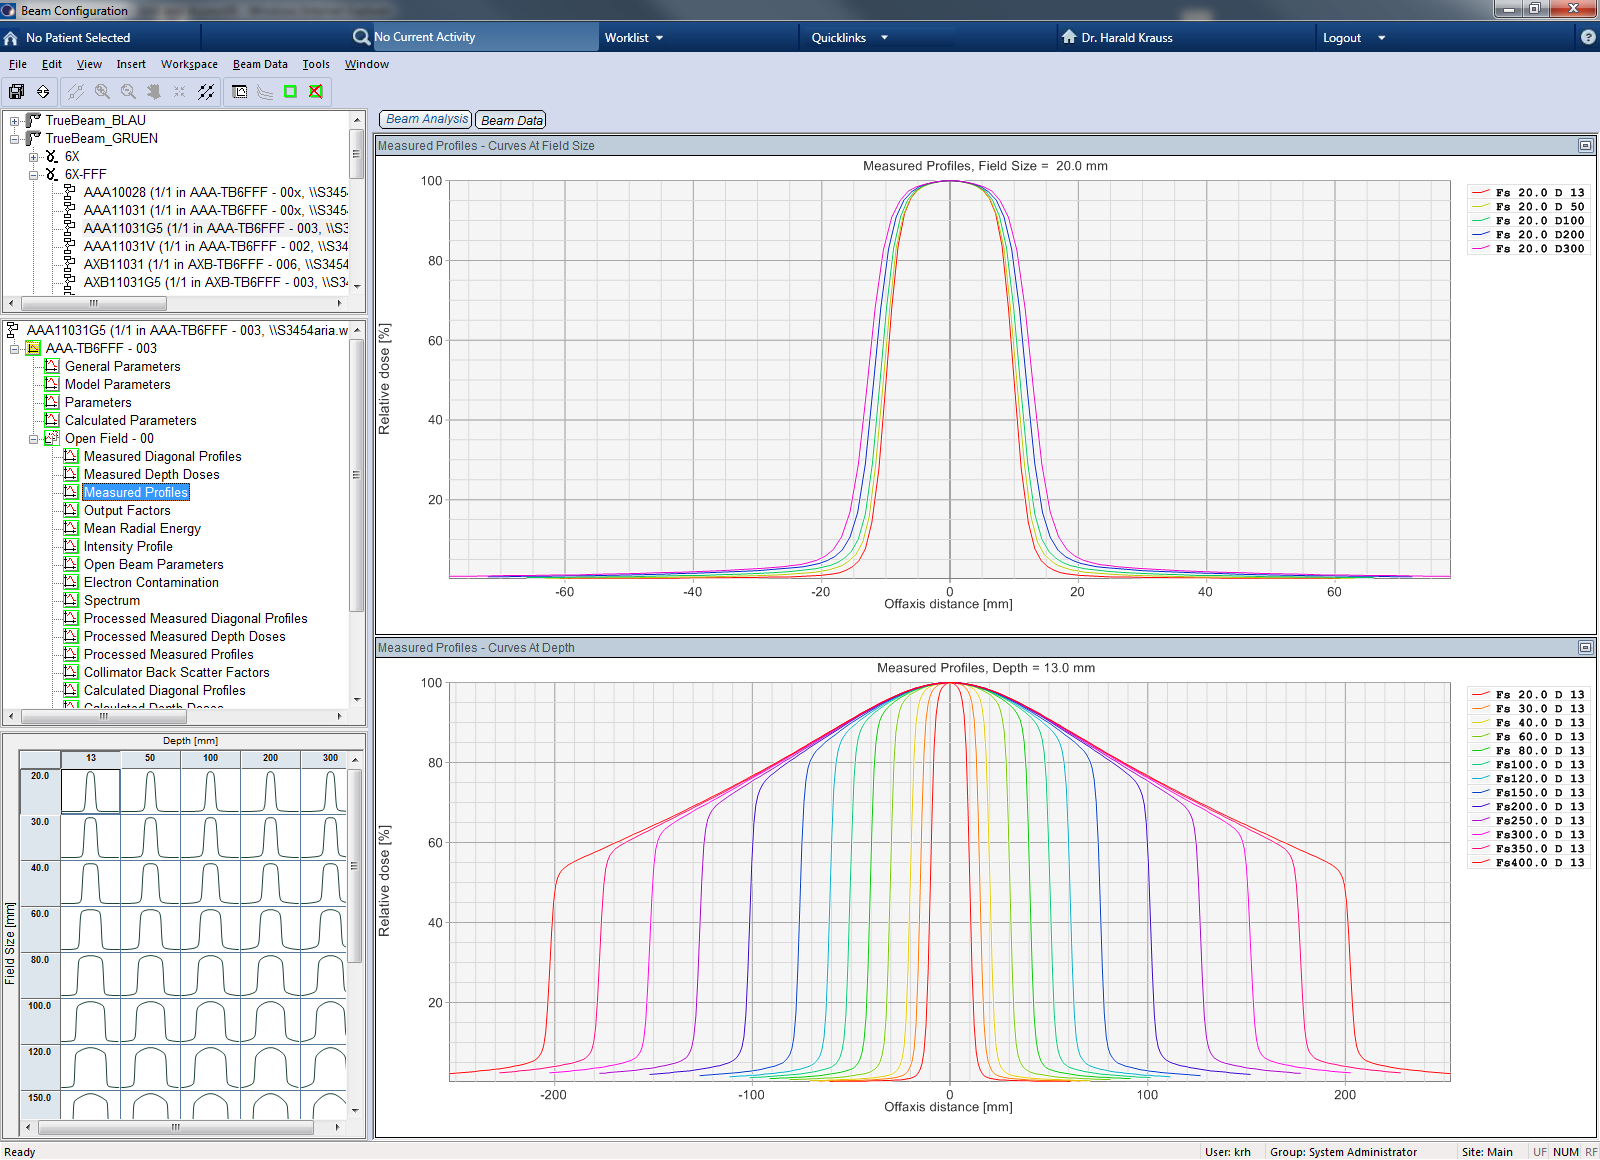
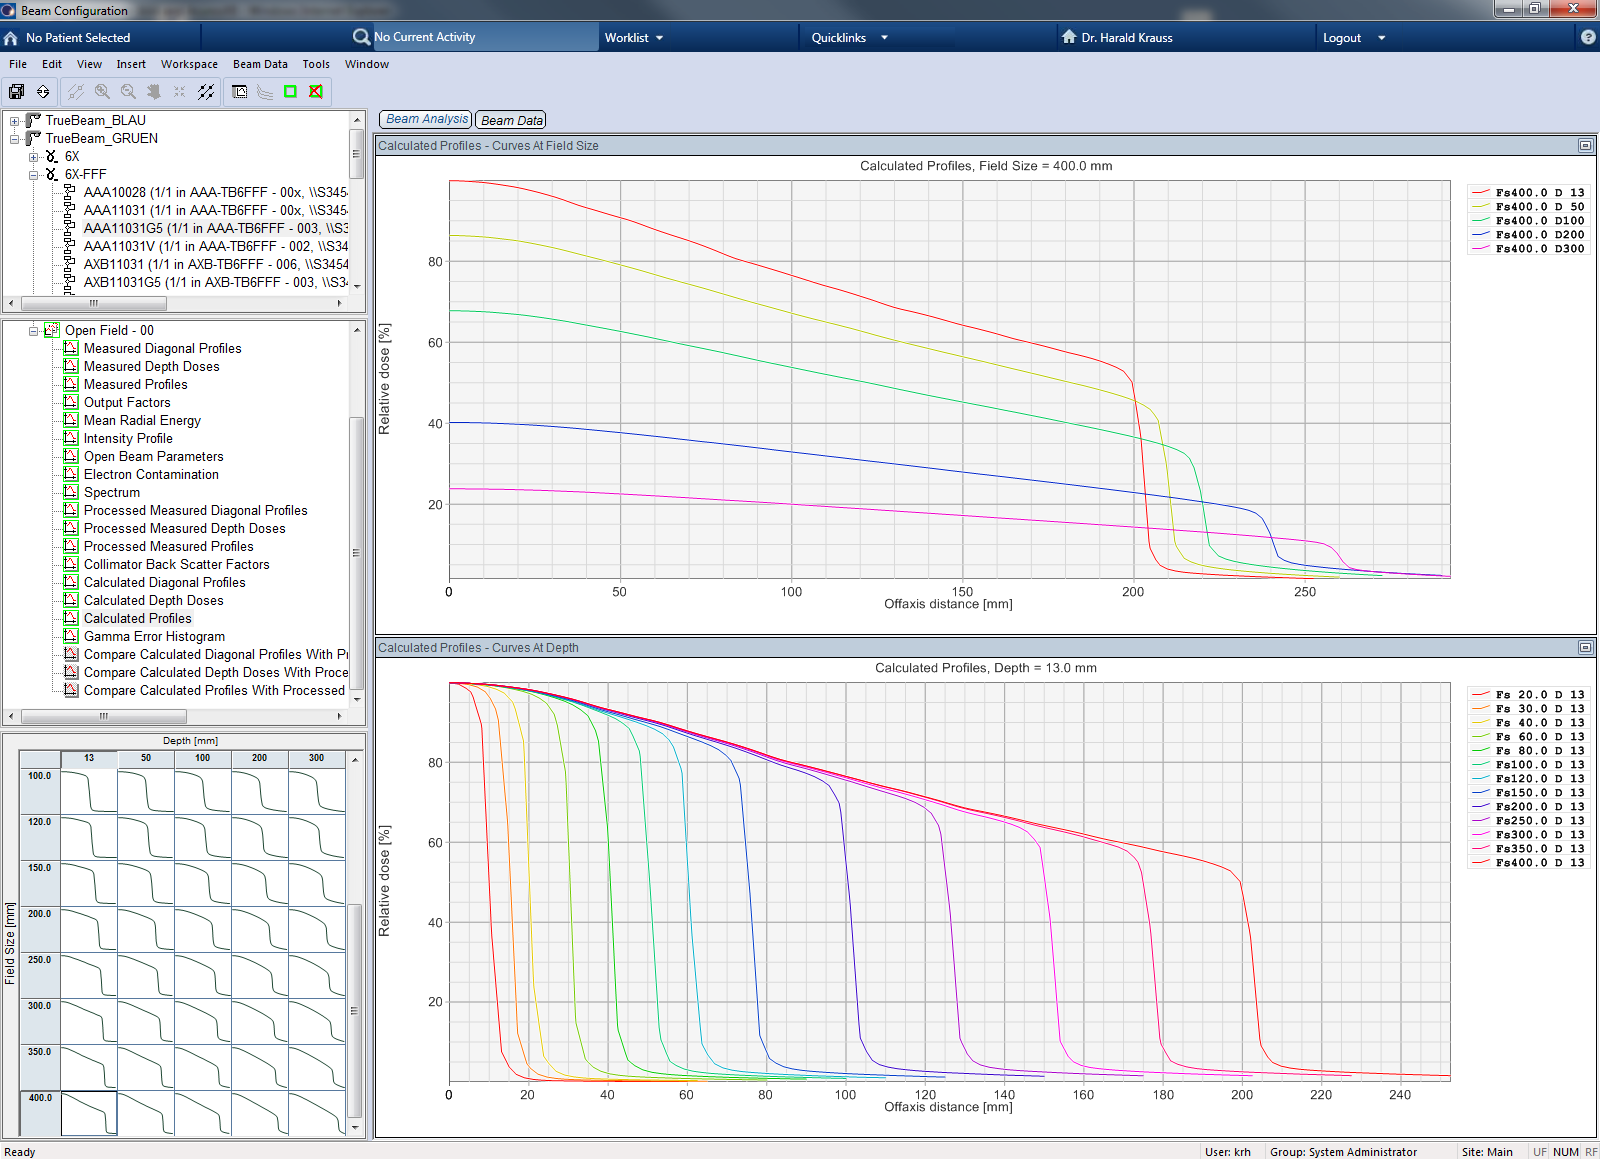
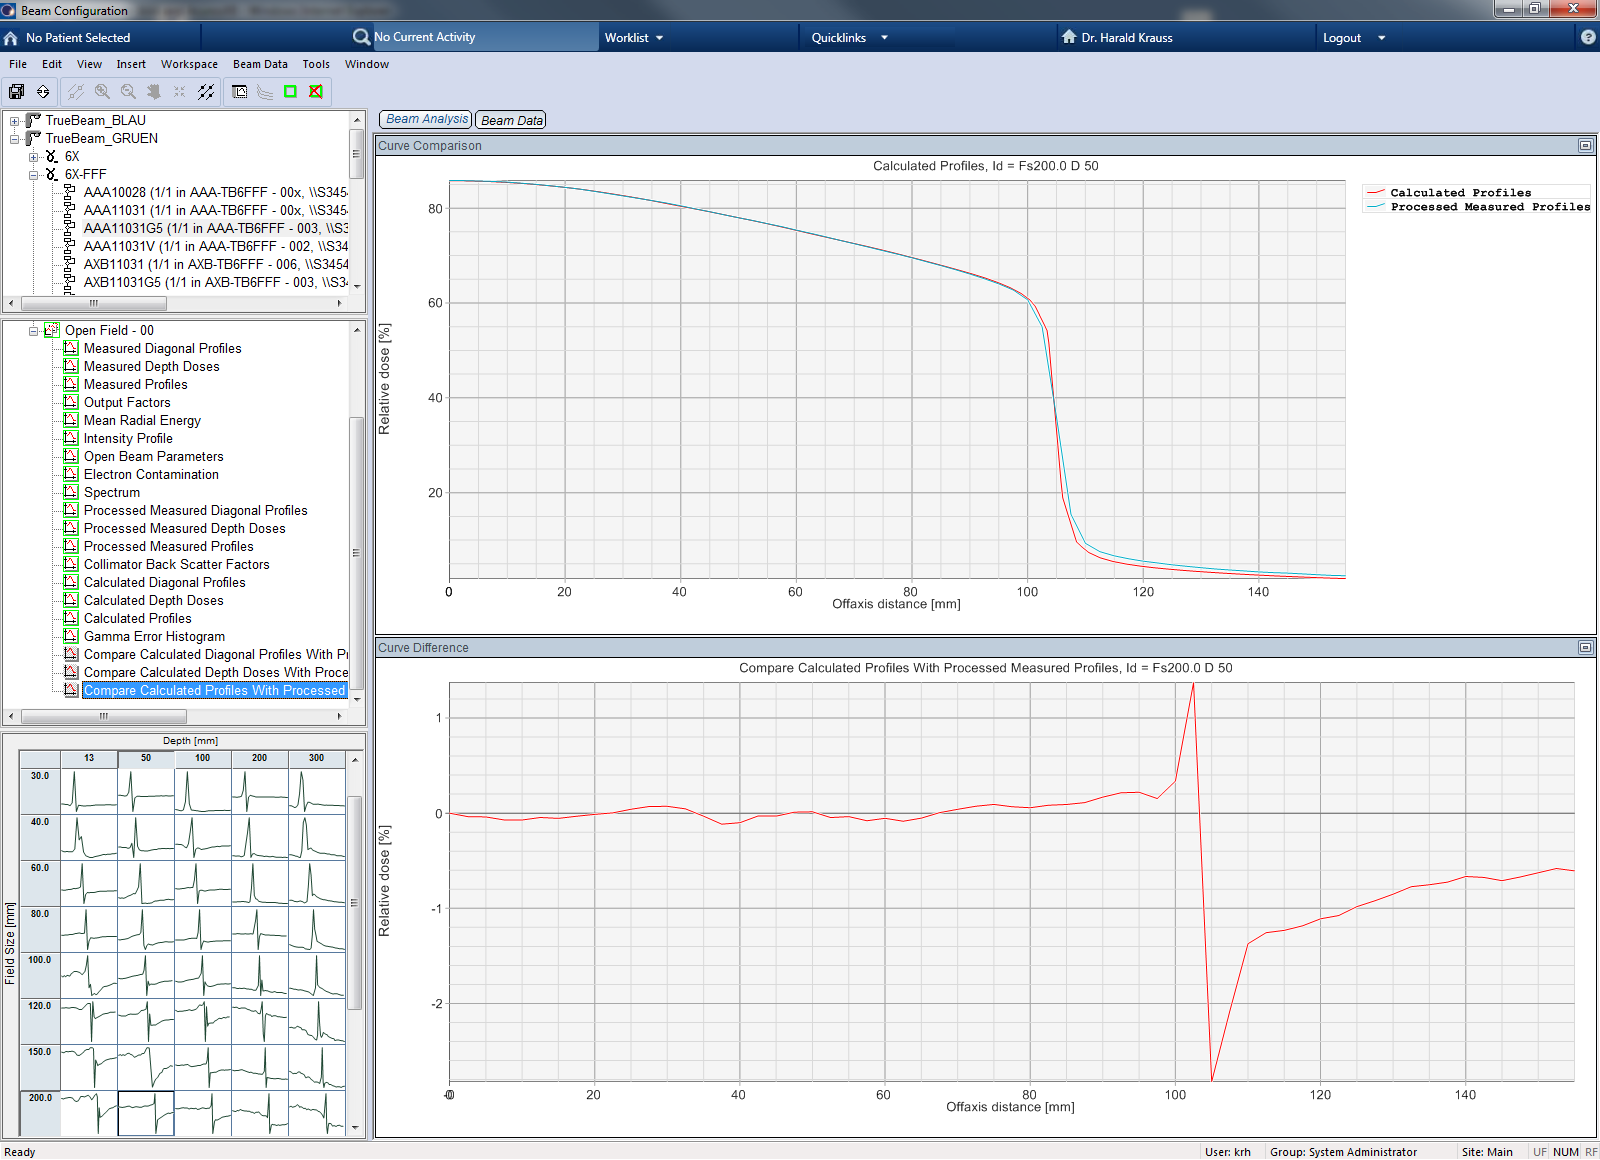
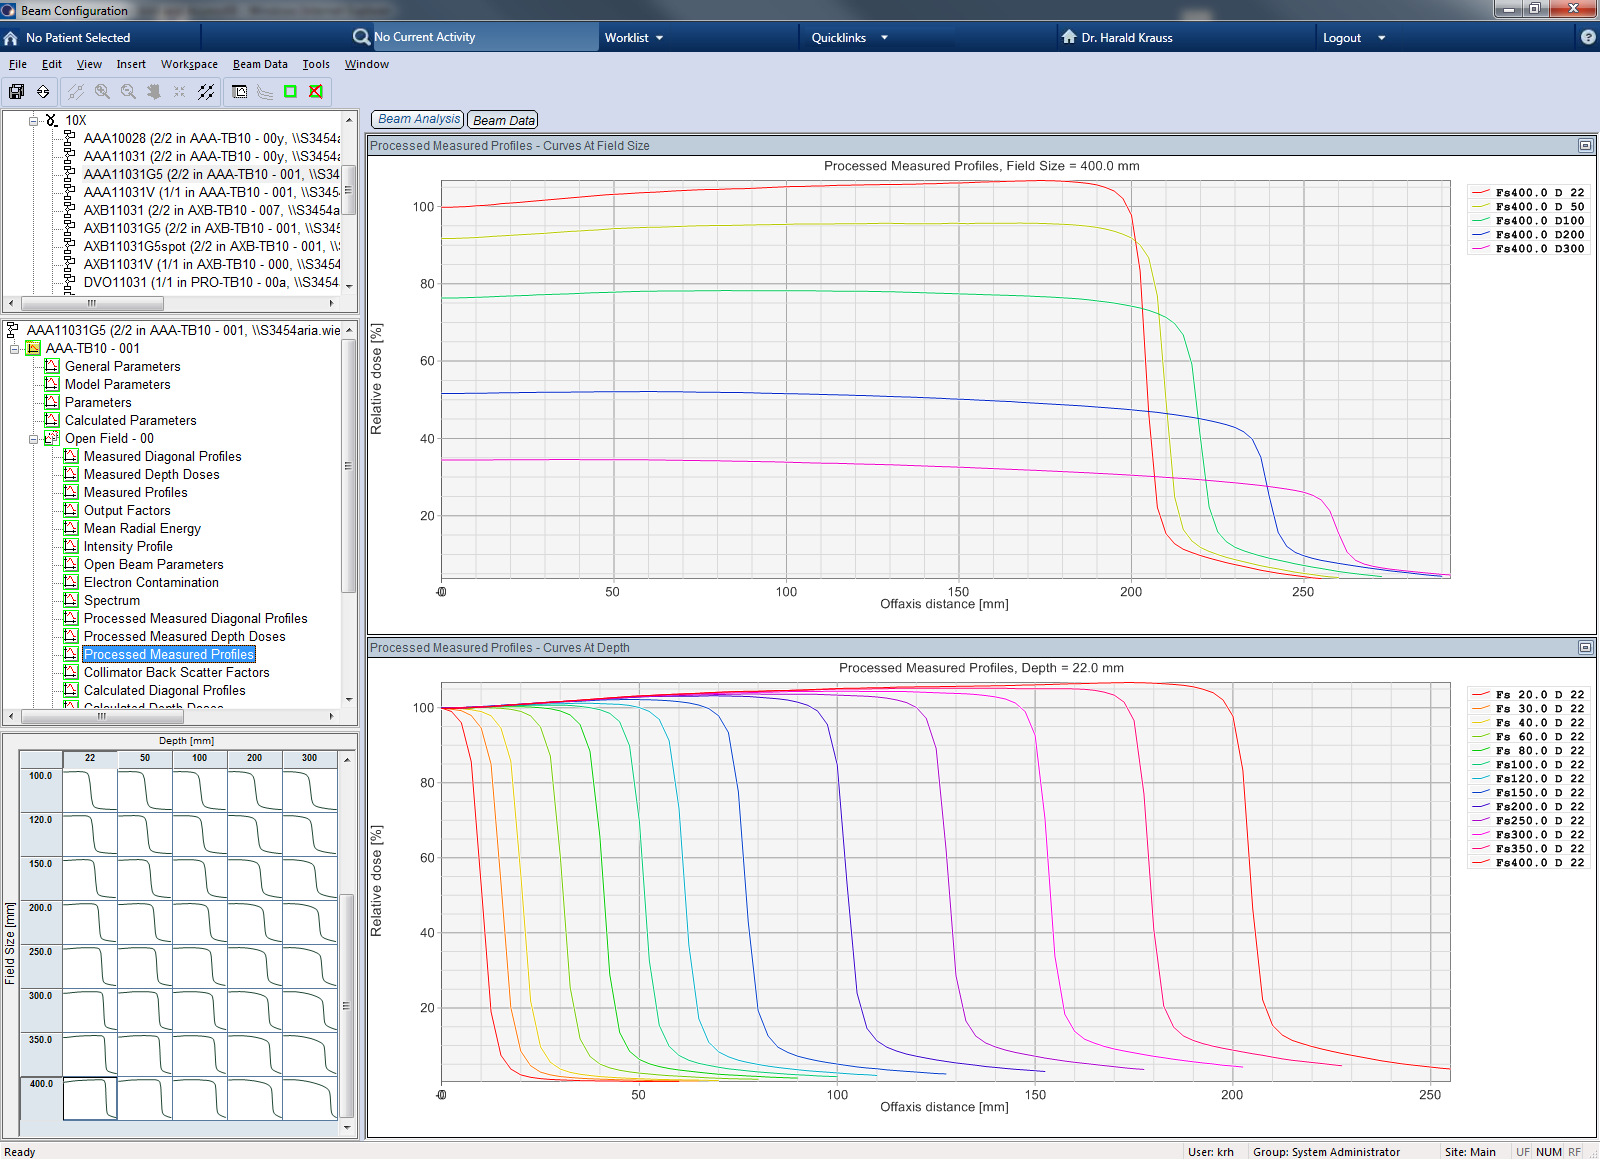
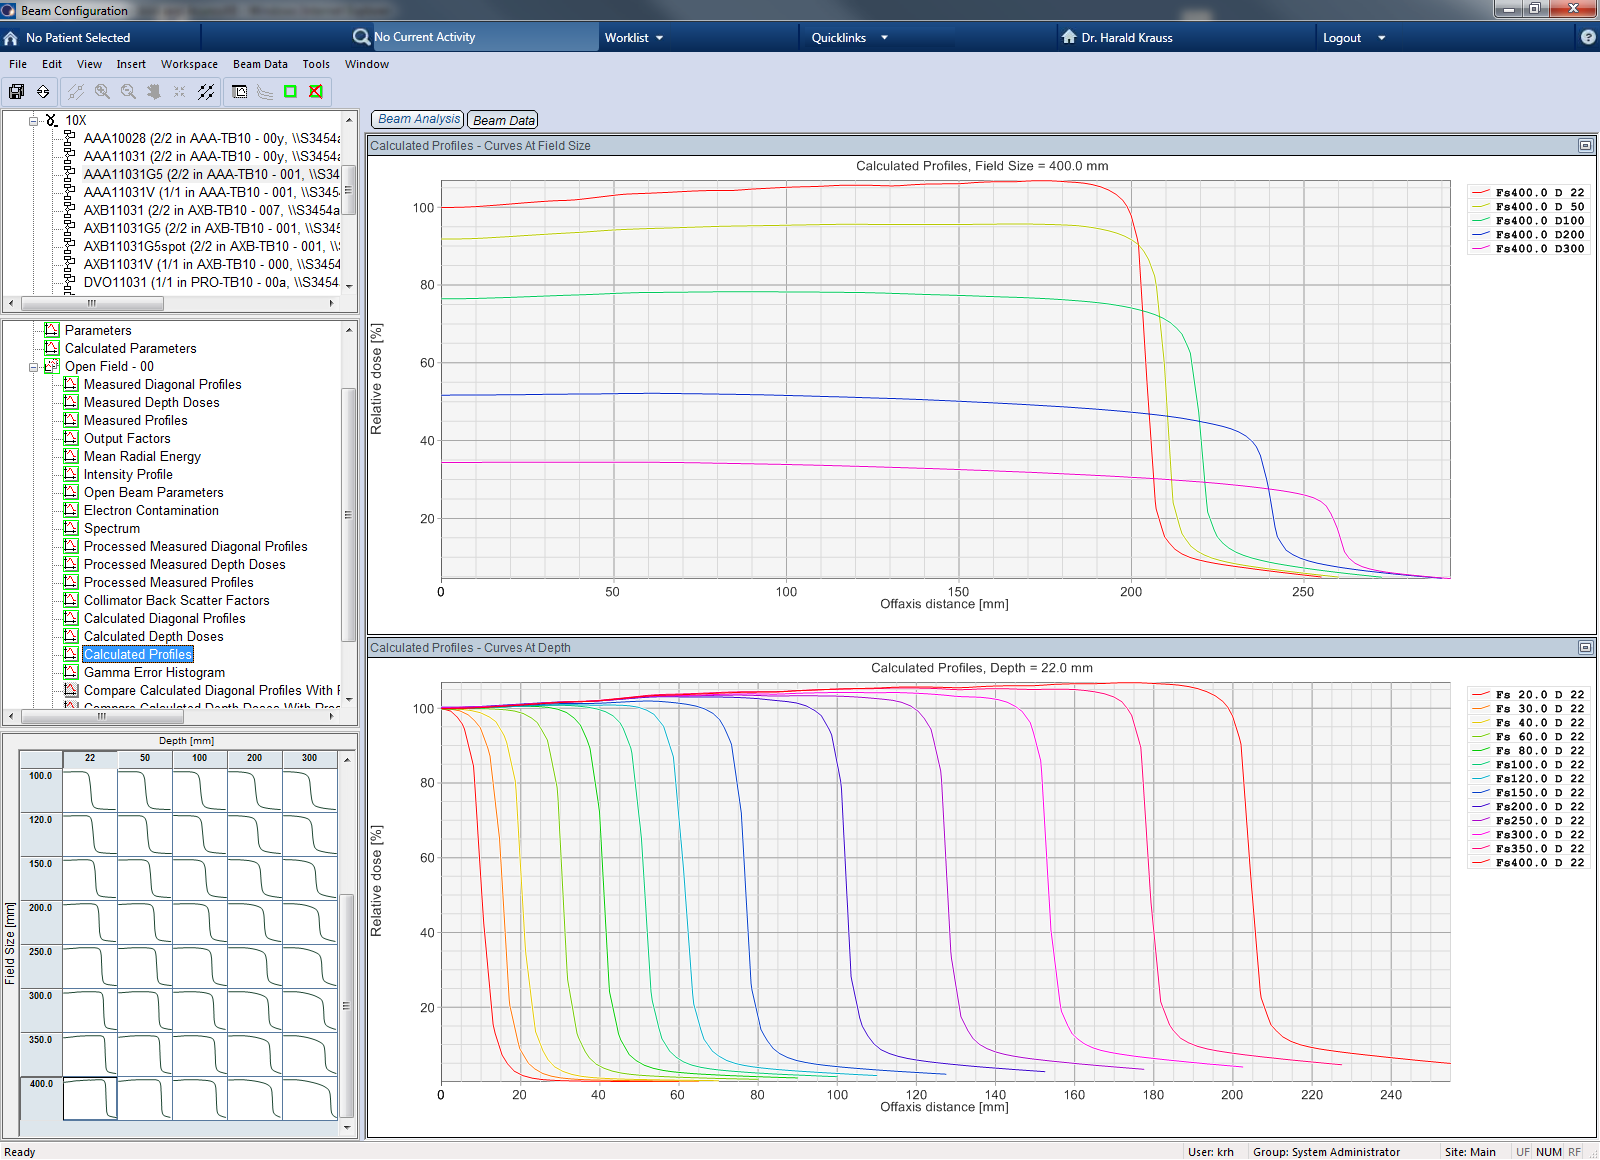
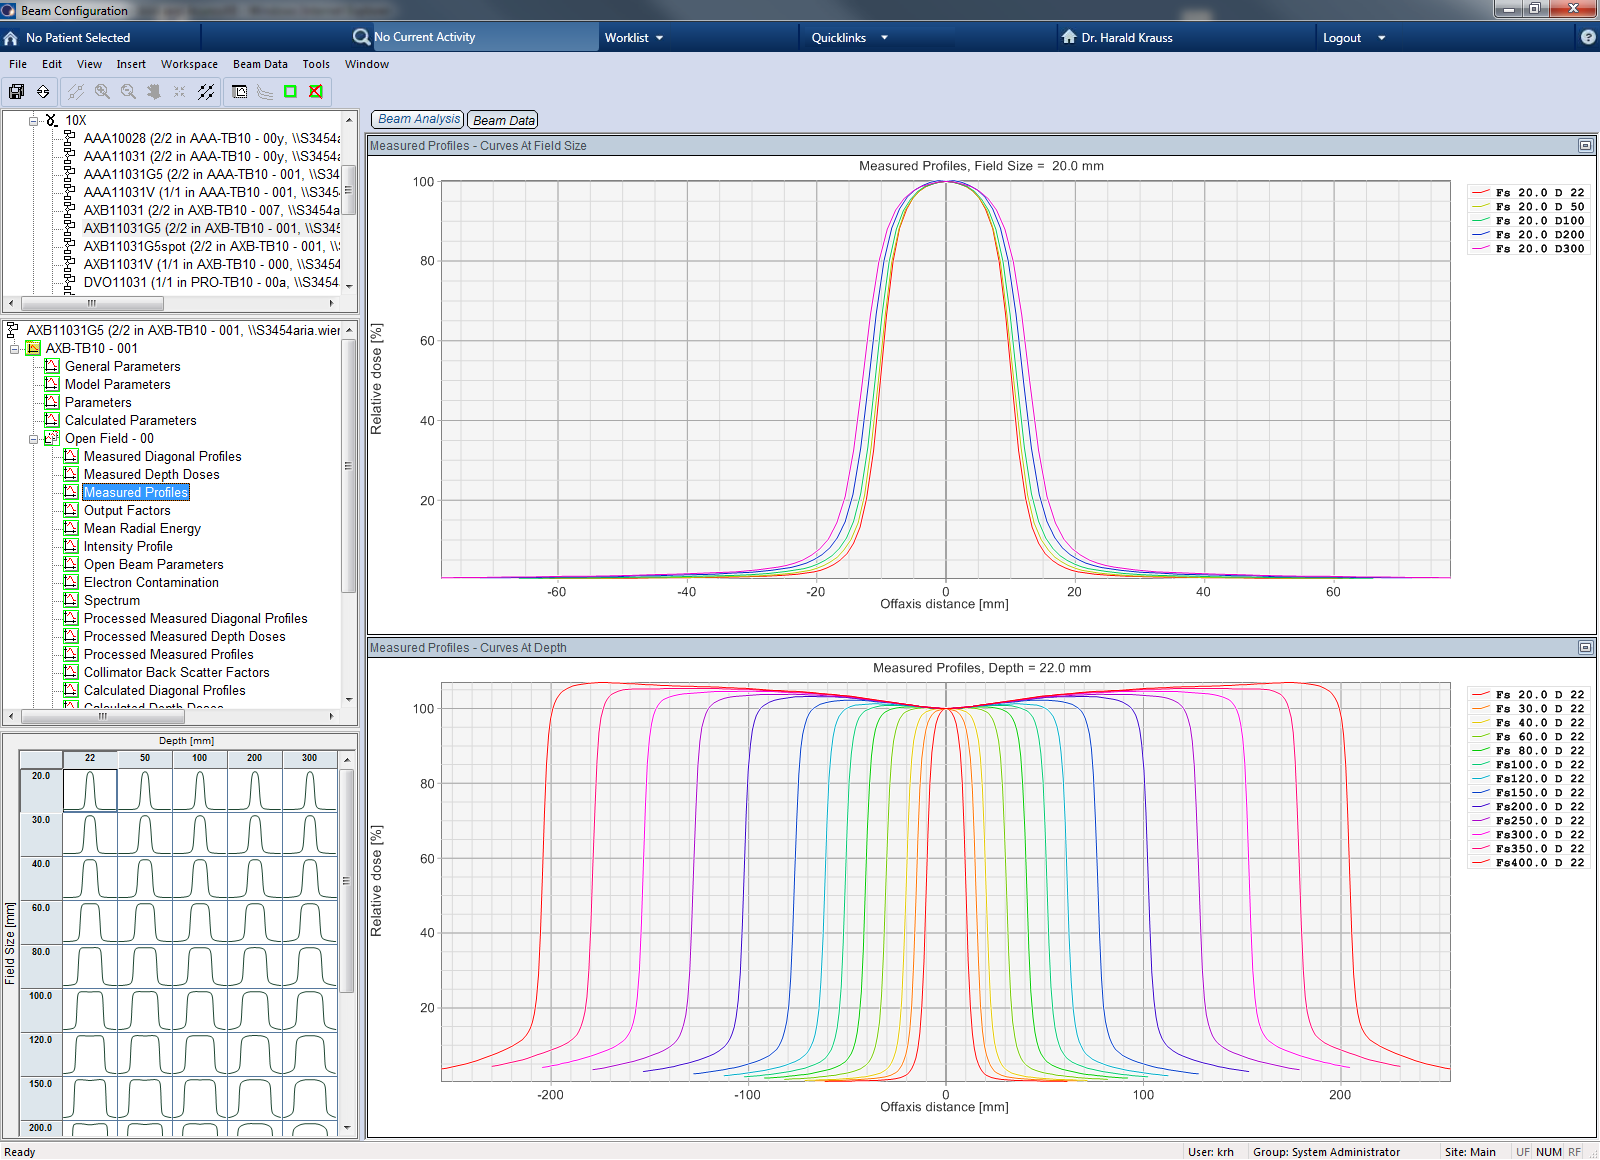
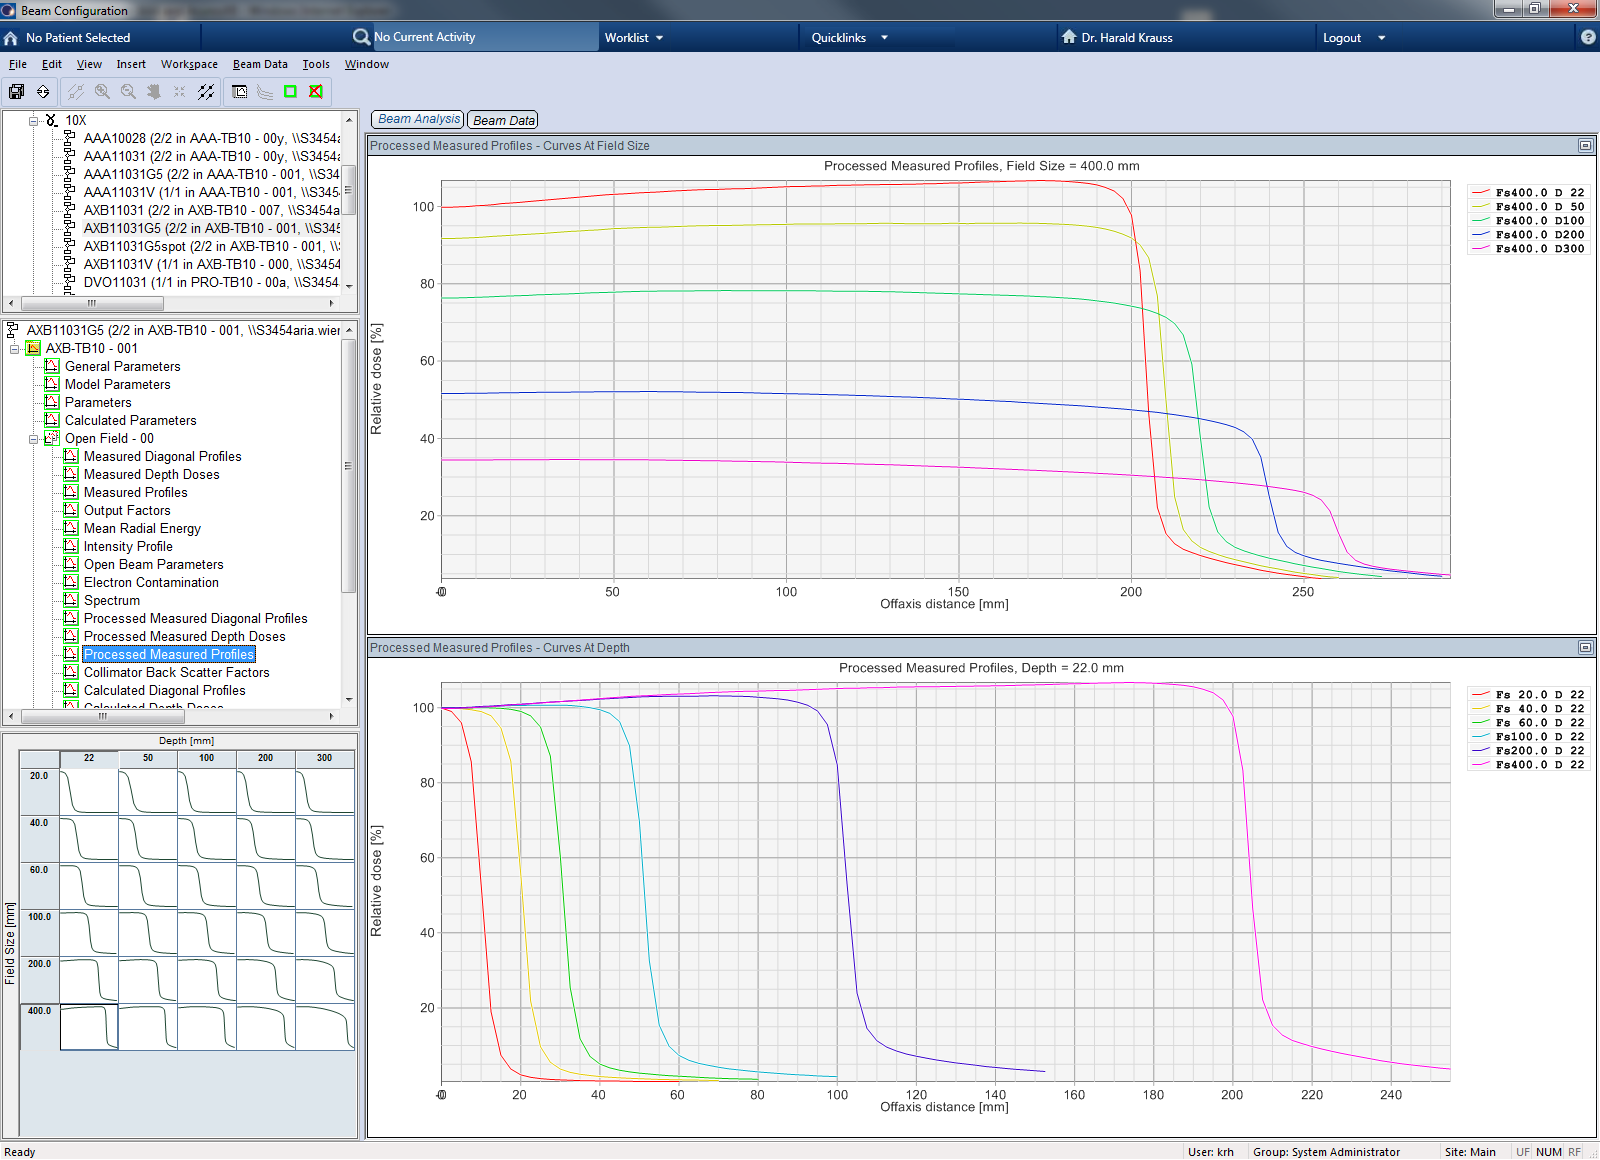
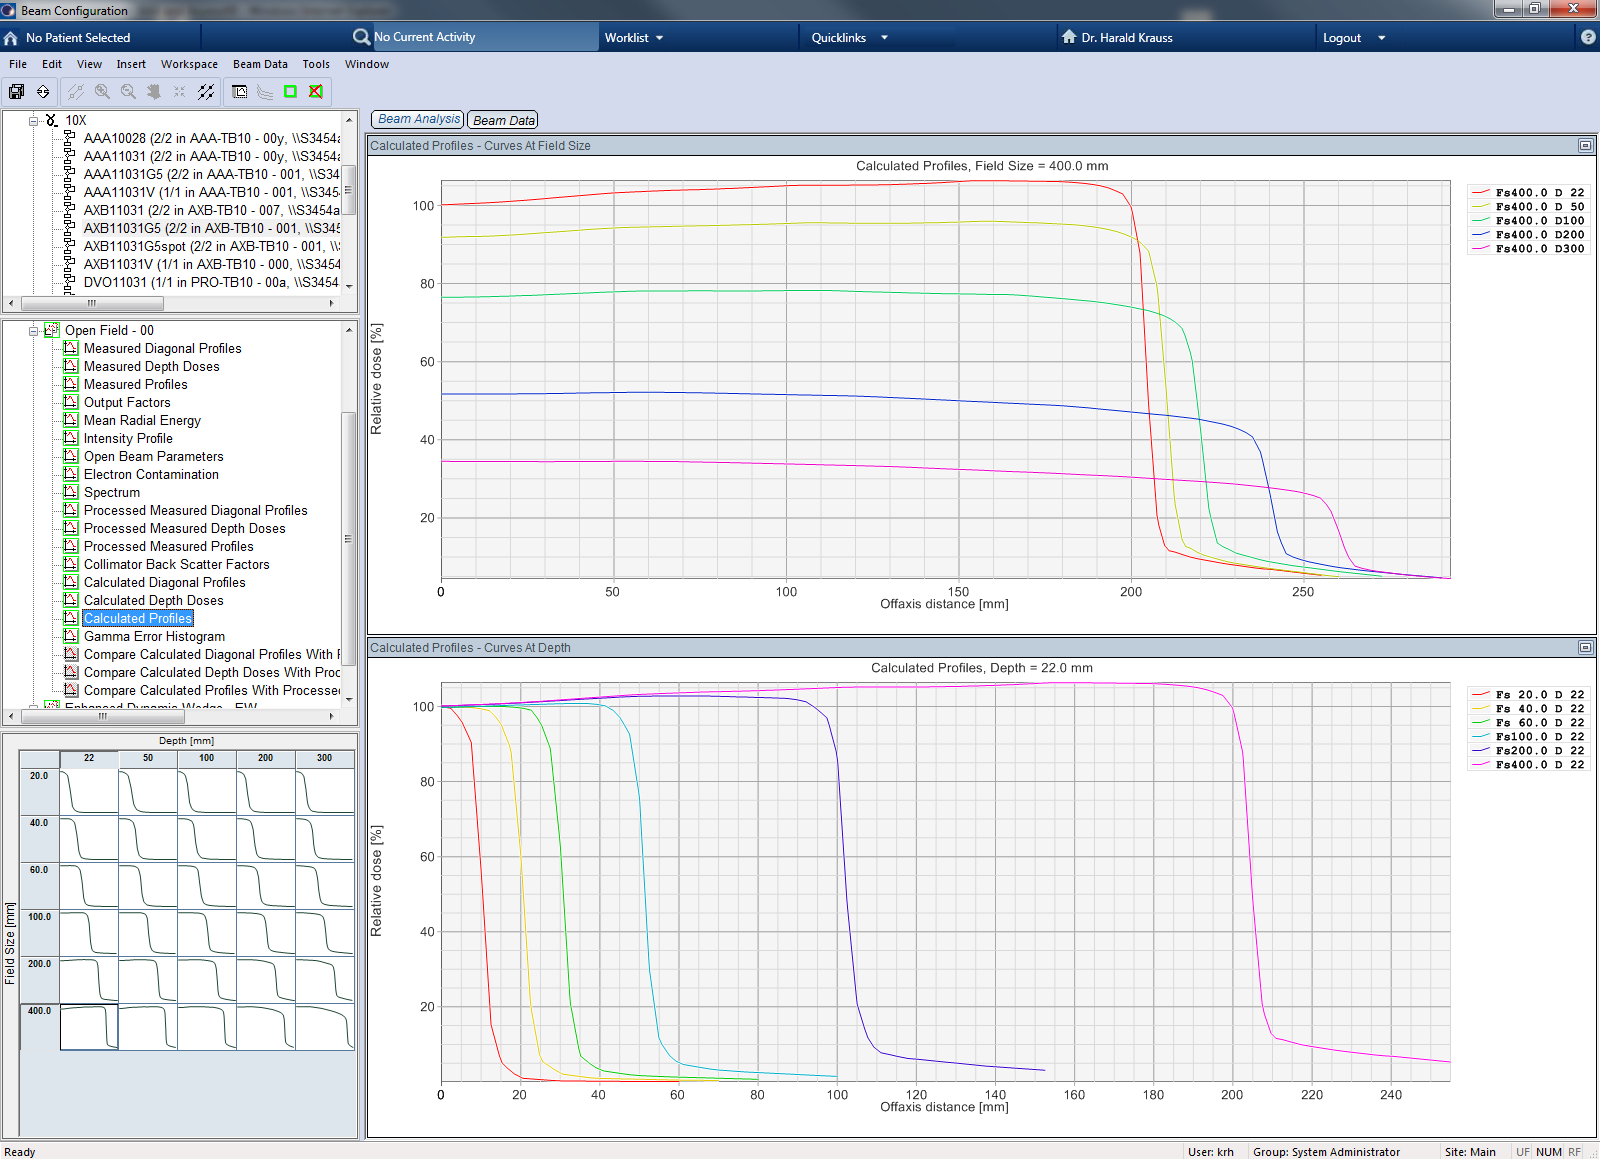
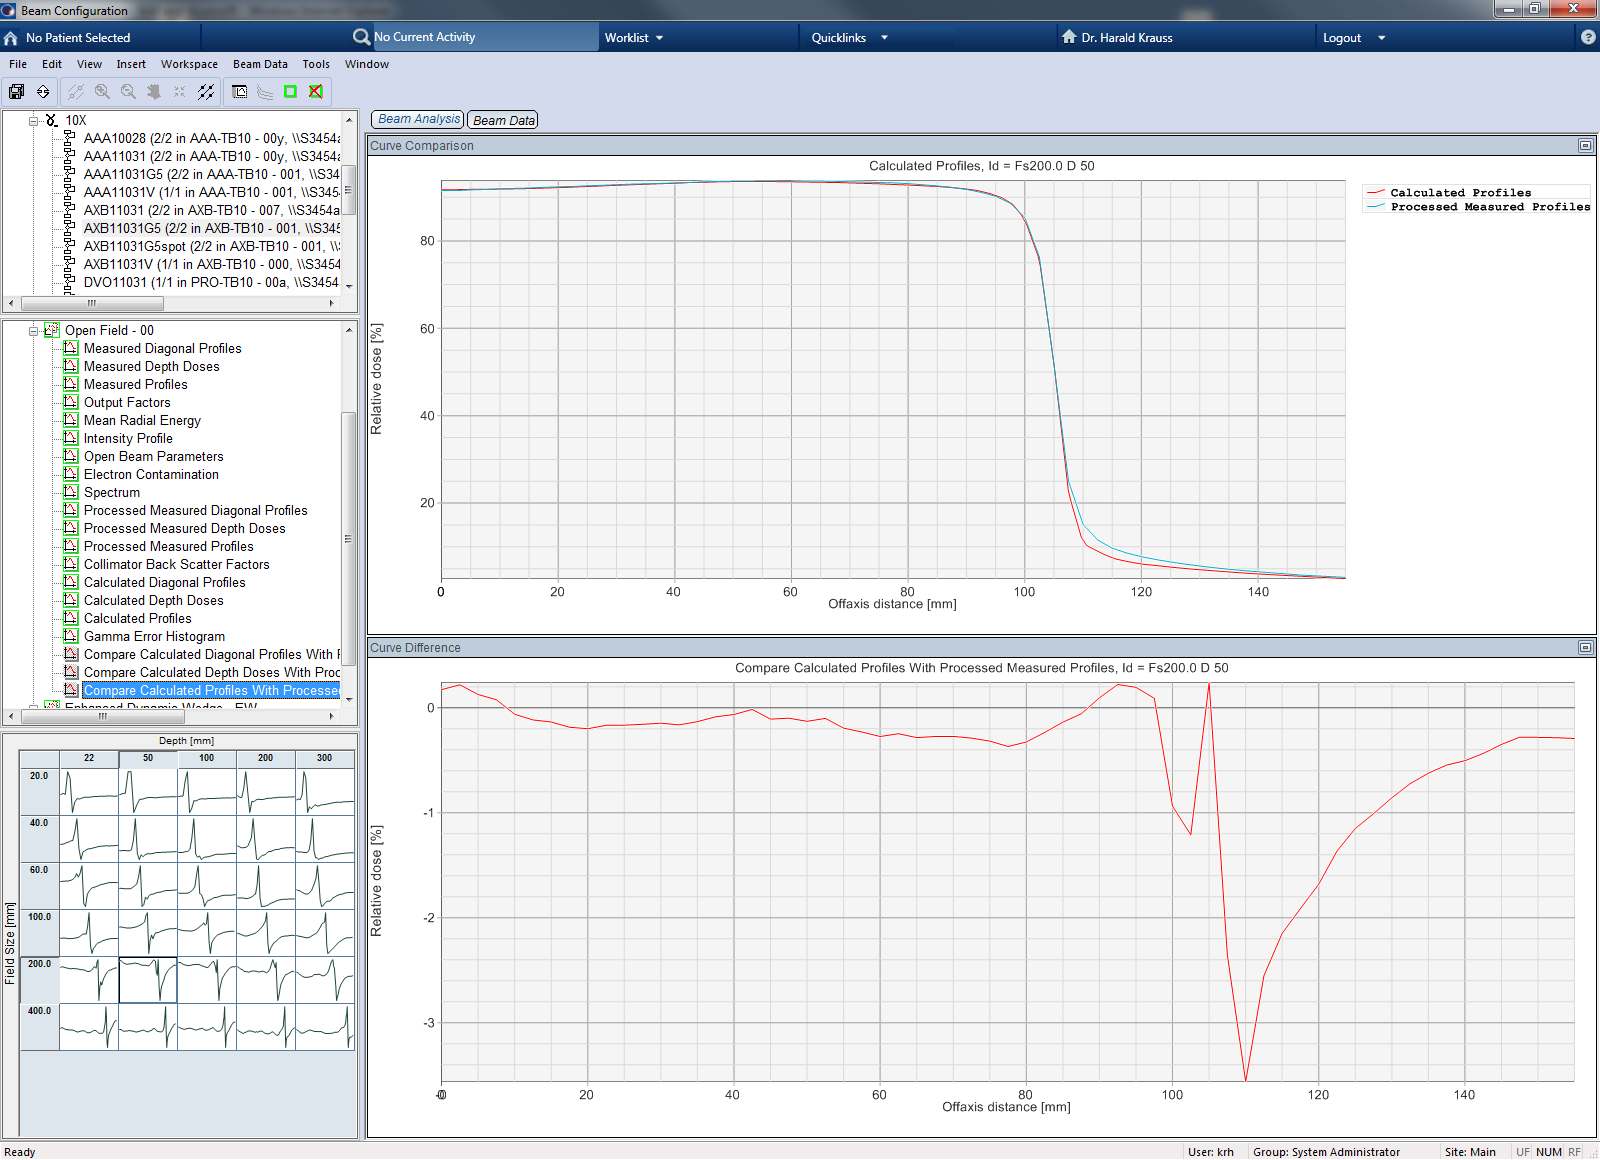
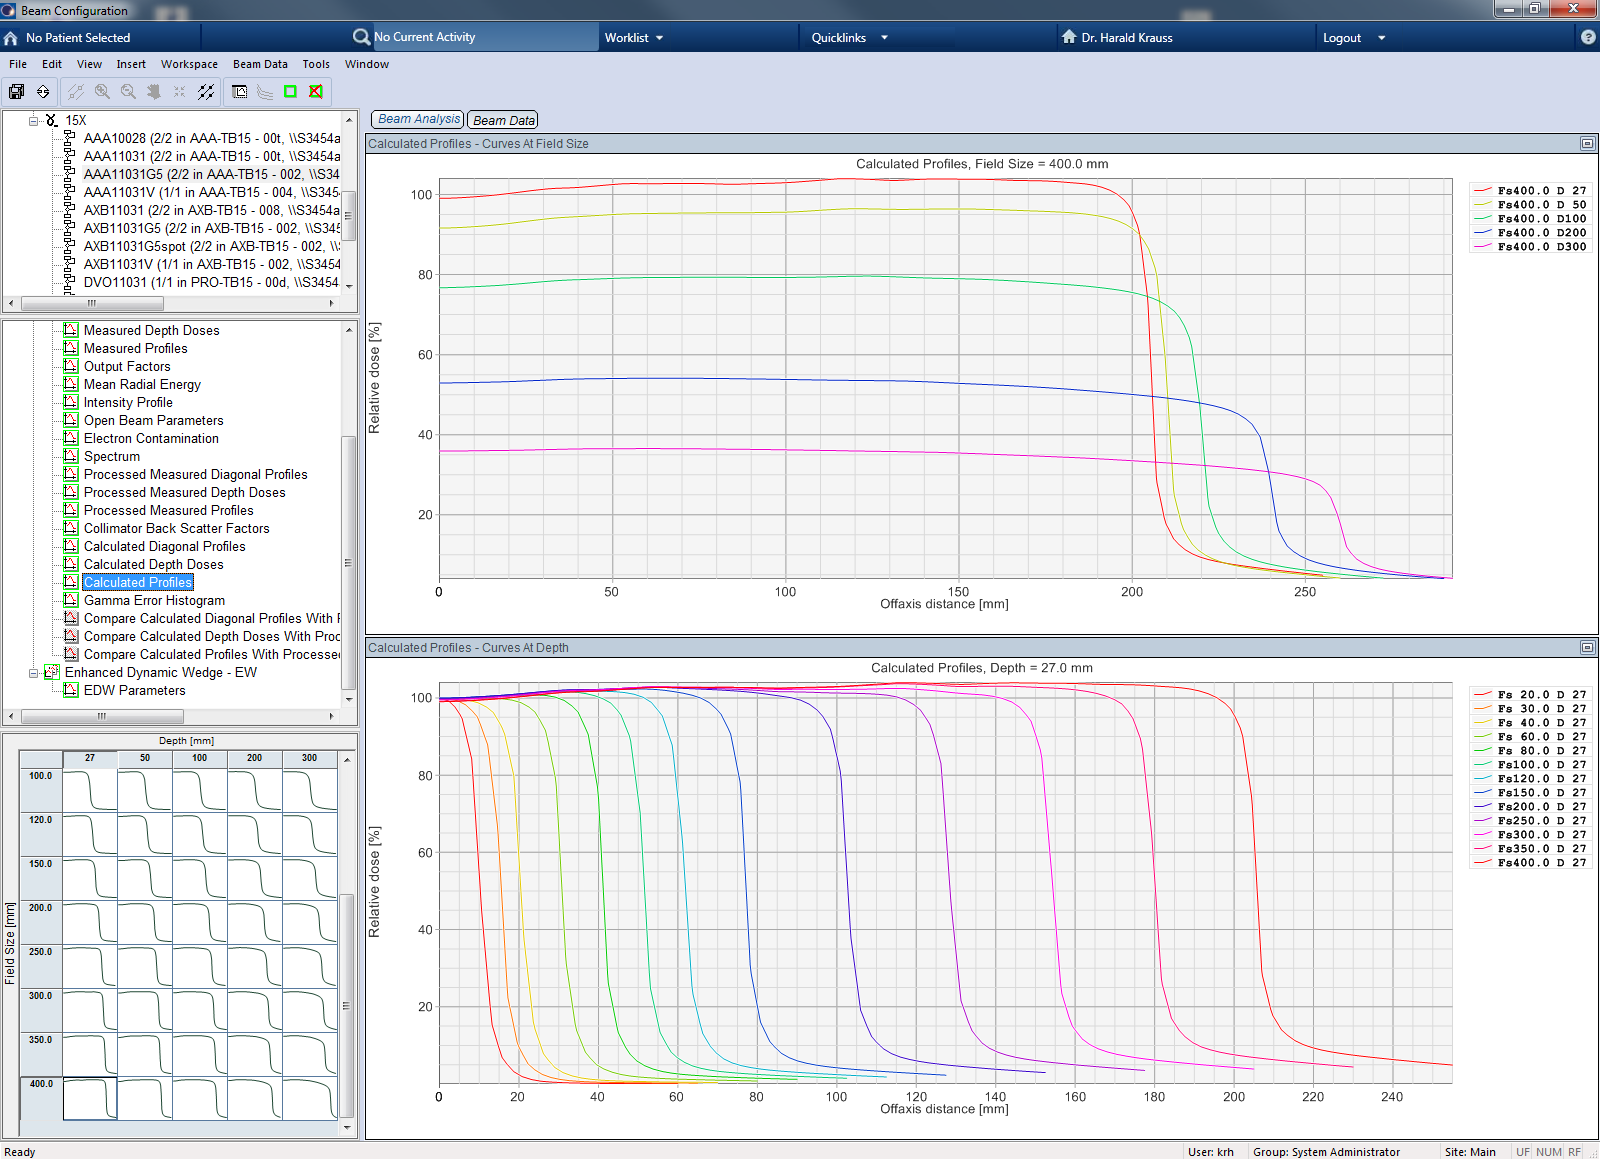
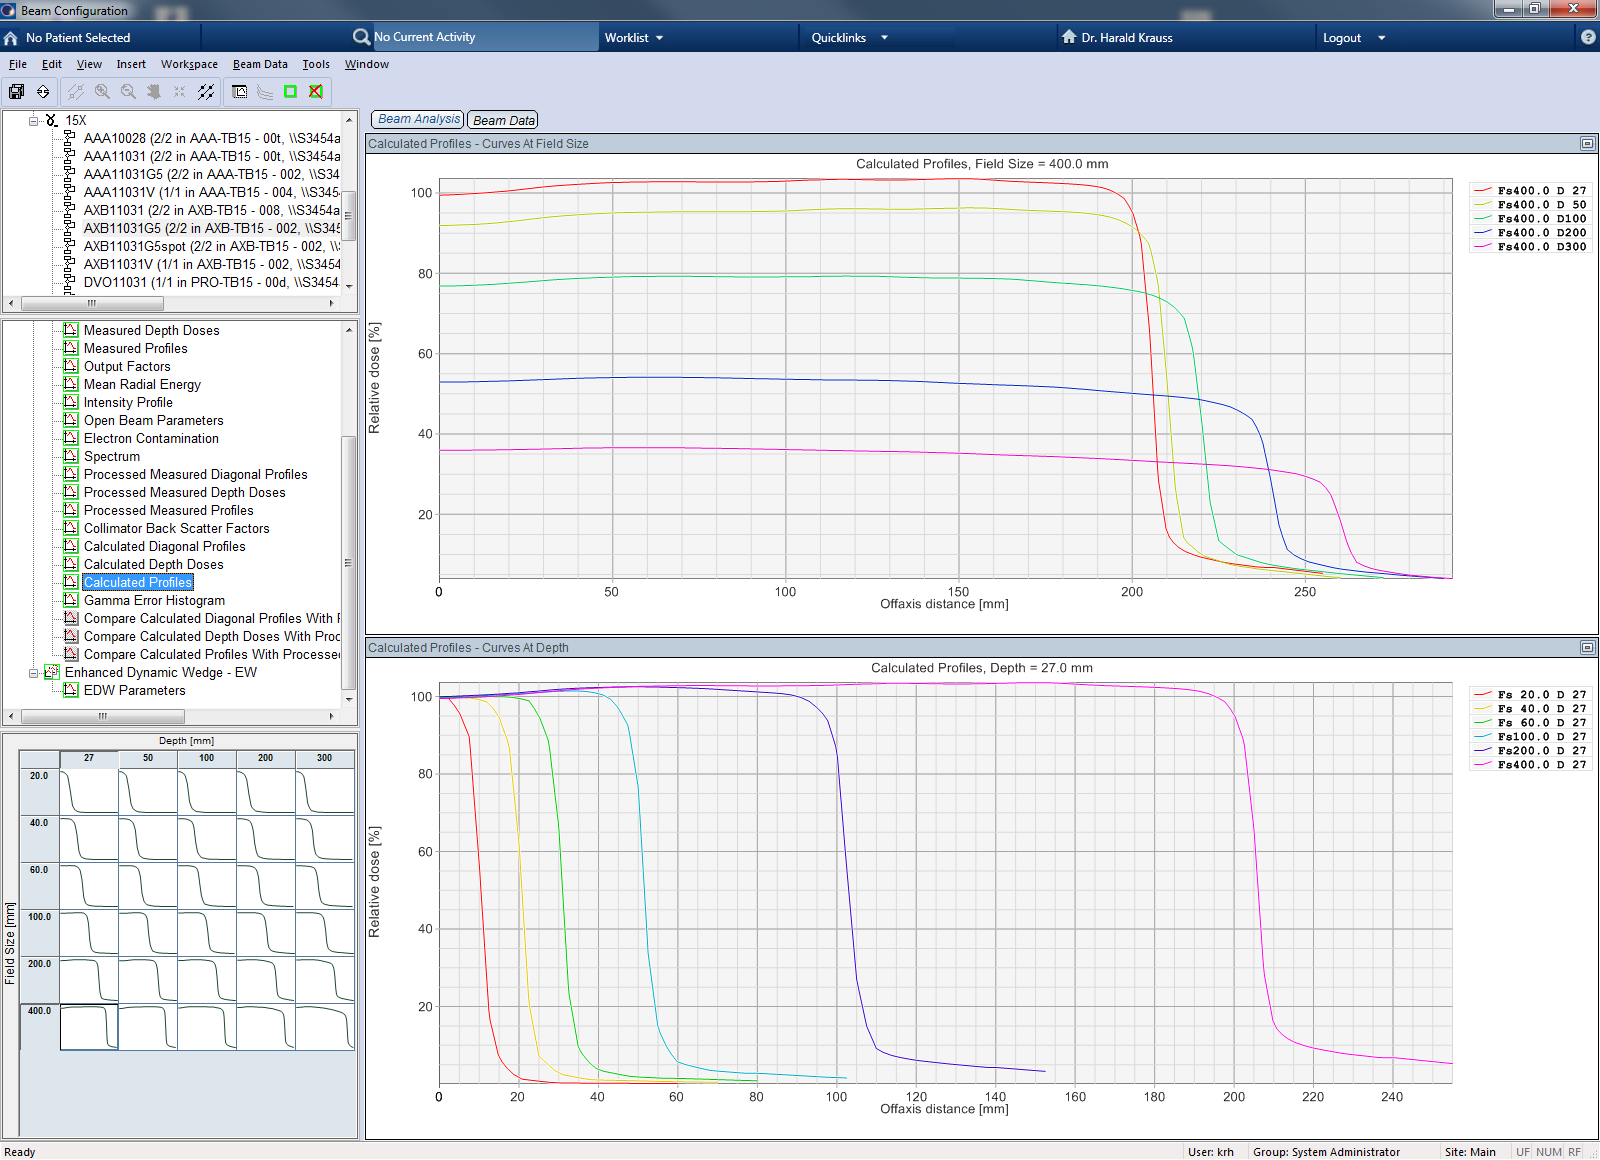
Transverse Profiles
Transverse profiles were measured in the crossplane direction using PP15, S/N 491.
Chamber and Phantom Setup
In contrast to the PDD measurements, the PP15 was mounted in the upright orientation ("axial chamber irradiation"), to minimize stem and cable effect. To drag the cable down at all times, the same weight on the cable was used as during PDD measurements.
EPOM shift data are usually not available if the chamber is irradiated axially. By matching X6, 10 x 10 cm PDD curves with the chamber in horizontal and vertical orientation, a shift of 1.9 mm was determined experimentally, measured from the tip of the chamber.
The chamber was therefore first aligned with its tip on the water surface, and then moved upstream by 1.9 mm. Detector alignment was performed as described in the PDD section above.
Scan Settings
Step size was 2.5 mm in the plateau region and outside of the field, and 1 mm in the penumbra region. Profiles were measured to at least 50 mm beyond the 50% point (field edge). For the largest field size (40 x 40 cm), this is not possible anymore at the 300 mm depth. Depending on the software set limits, our maximum scan length was 584 mm (or 292 mm on one side, with perfectly centered tank). At SSD 100 cm, the deepest profile would require a scan length of 50 + (400 * 1.3) + 50 mm = 620 mm (310 mm on one side). However, after adding one data point at the end of the tails manually, Eclipse accepted even the 40 x 40 cm @ 300 mm profile.
To avoid any hysteresis in the MP3 mechanics (was measured to be in the order of 0.3 mm), all profiles were measured from left to right.
As for PDD, curves were measured in absolute mode, without using a reference detector.
Session Log
Due to concurrent construction work in the linac room, the measurement session had to be divided into three days. Crossplane beam profiles were measured on TDS1469 in five depths,
- 14, 50, 100, 200, 300 mm (X6, measured on July 16, 2013),
- 13, 50, 100, 200, 300 mm (6FFF, measured on July 16, 2013),
- 22, 50, 100, 200, 300 mm (X10, measured on July 18, 2013),
- 22, 50, 100, 200, 300 mm (10FFF, measured on July 19, 2013),
- 27, 50, 100, 200, 300 mm (X15, measured on July 18/19, 2013),
for the square field sizes 1, 2, 3, 4, 6, 8, 10, 12, 15, 20, 25, 30, 35 and 40 cm. The 1 x 1 cm field was included for reference only (not for Eclipse beam modelling).
The choice of the first profile depth ("dmax depth") was based on the PP15 PDD curves which had been measured on July 10 (setup with Trufix). Relative to this data, the curves of Aug 2 were shifted downstream by about 0.4 mm due to the manual setup. Therefore, also the dmax depths found on Aug 2 were slightly deeper. However, after this "dmax update" of Aug 2, the crossprofile scans of July 18/19 were not repeated.
A note on CAX deviation: after each completed field size, the CAX deviation of the five curves was analyzed. If there was a correctable shift of > 0.1 mm in all five profiles, this shift was corrected for the next field size (by updating the lateral zero point of the MP3). This minimized the overall CAX deviations for the whole data set.
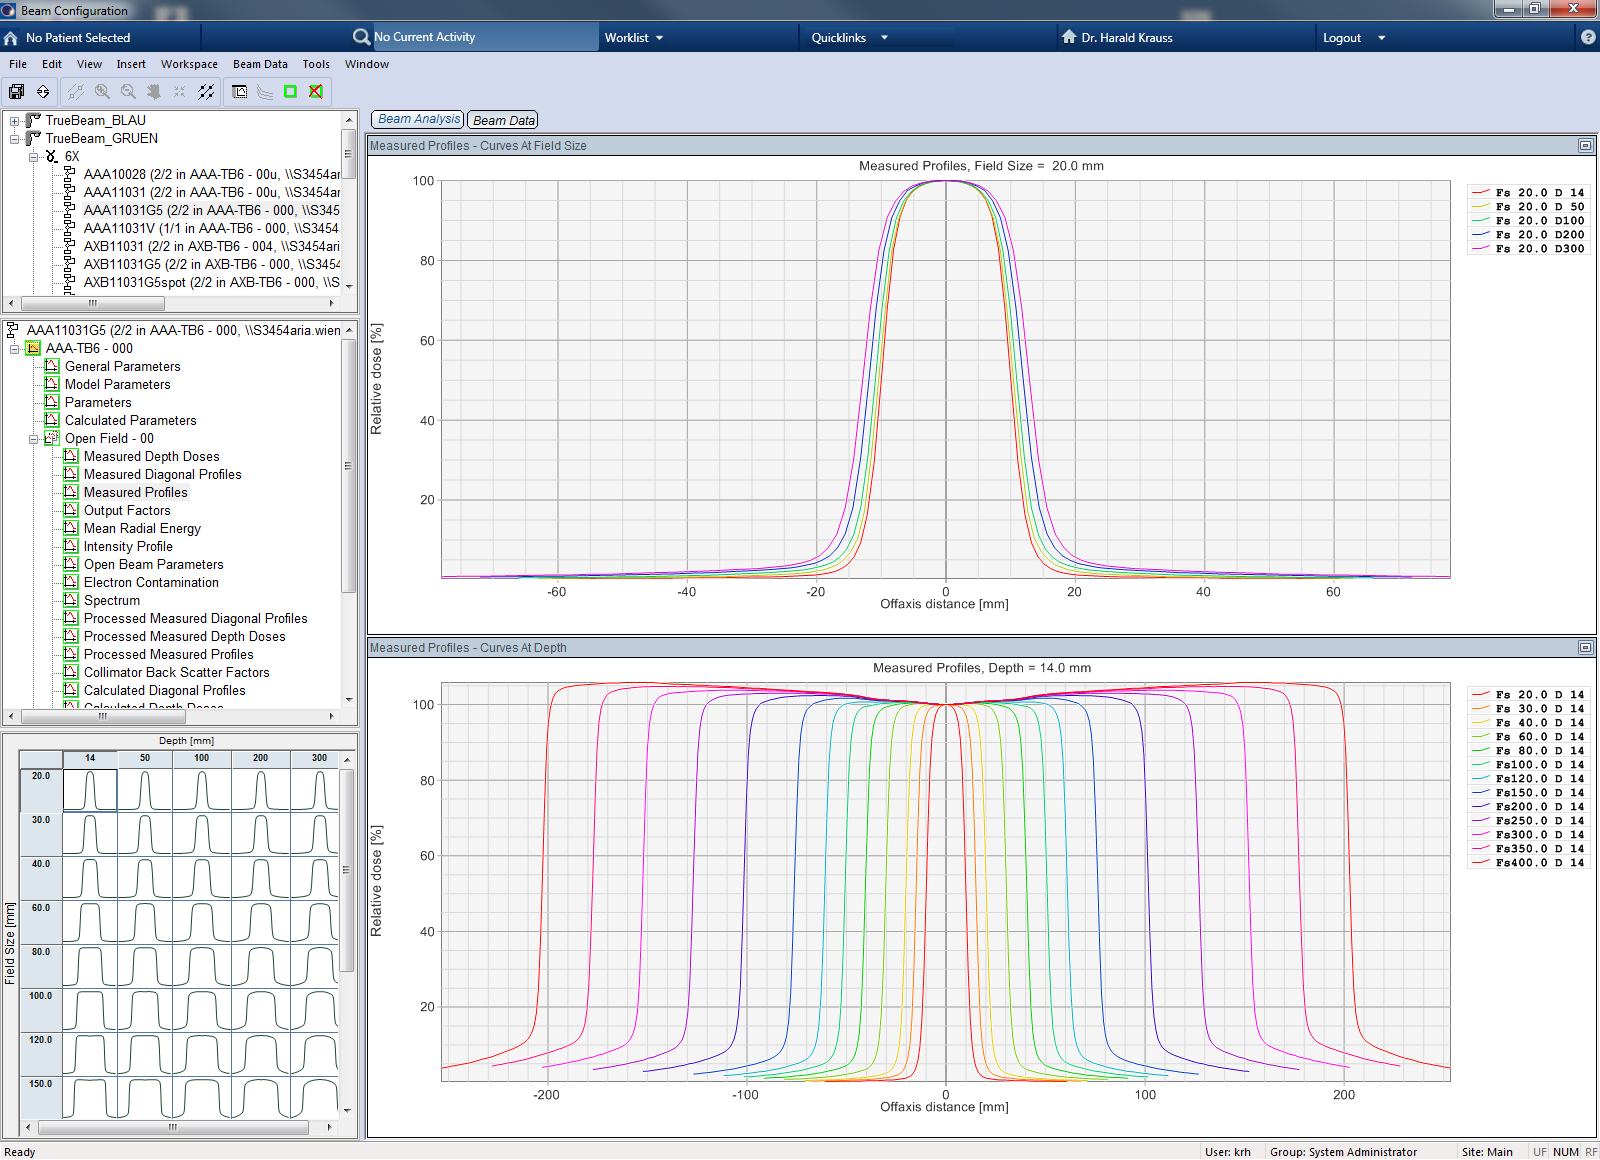
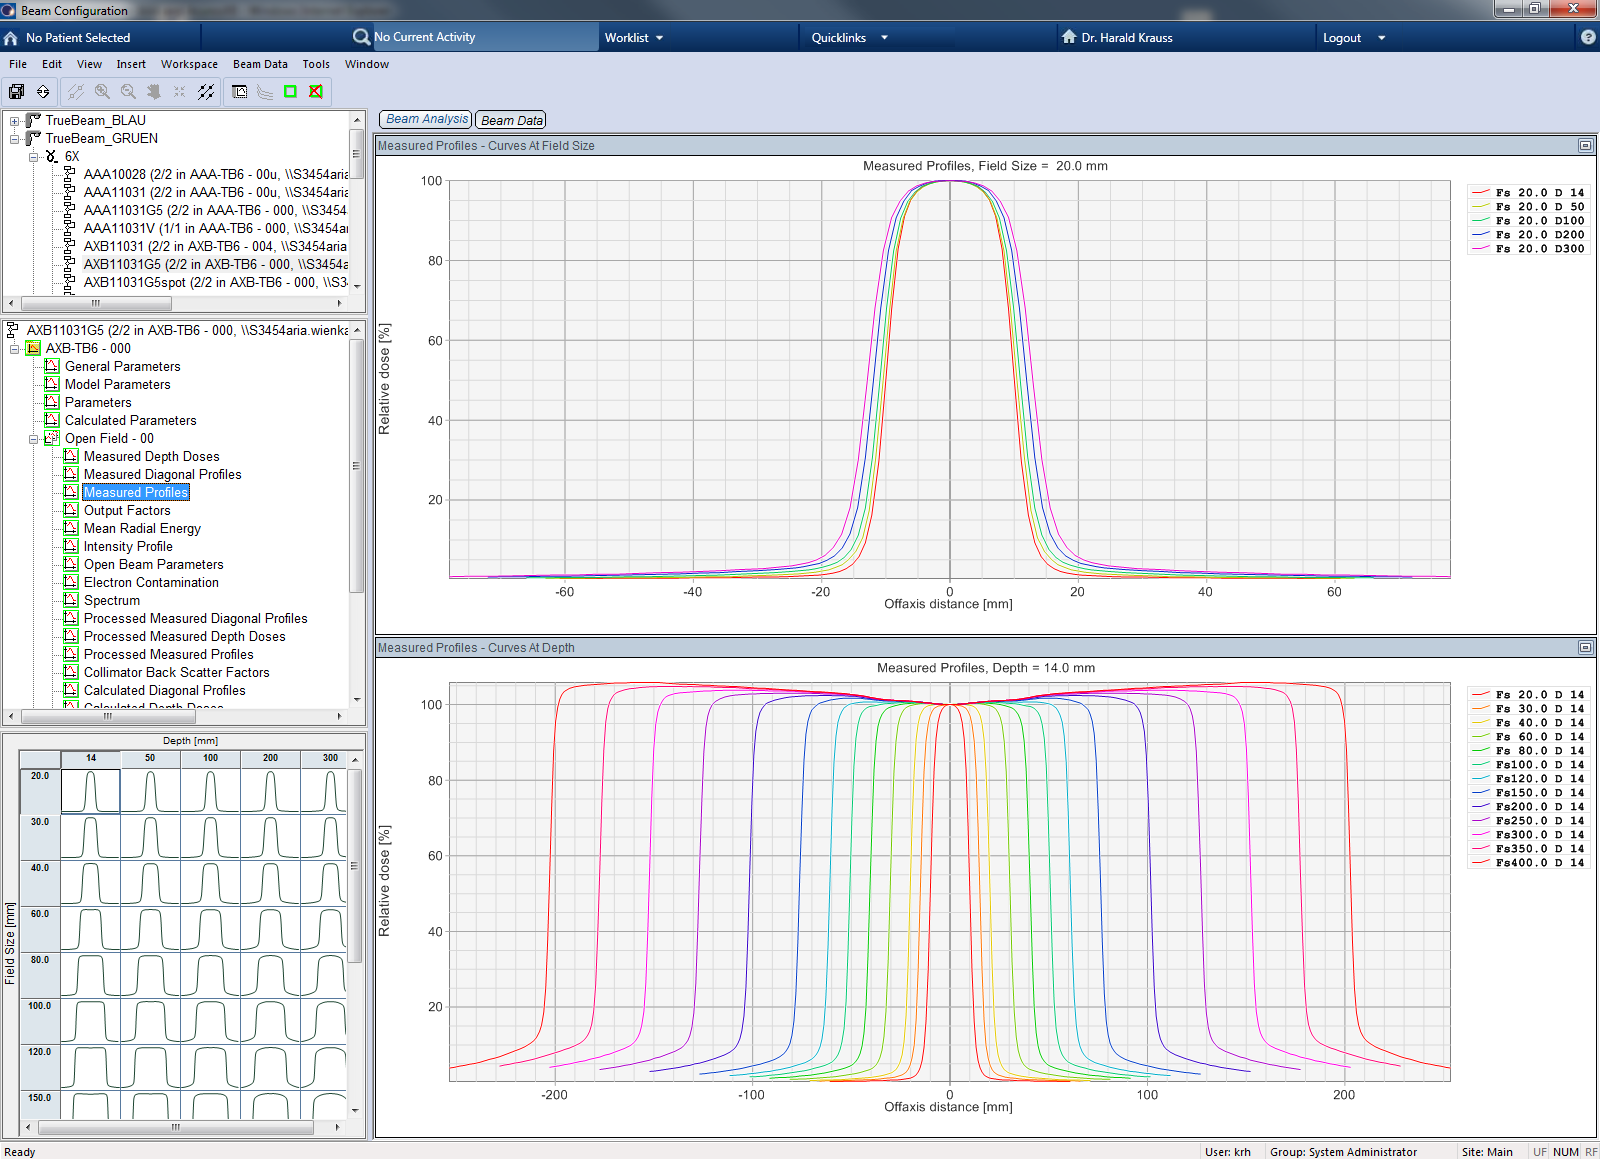
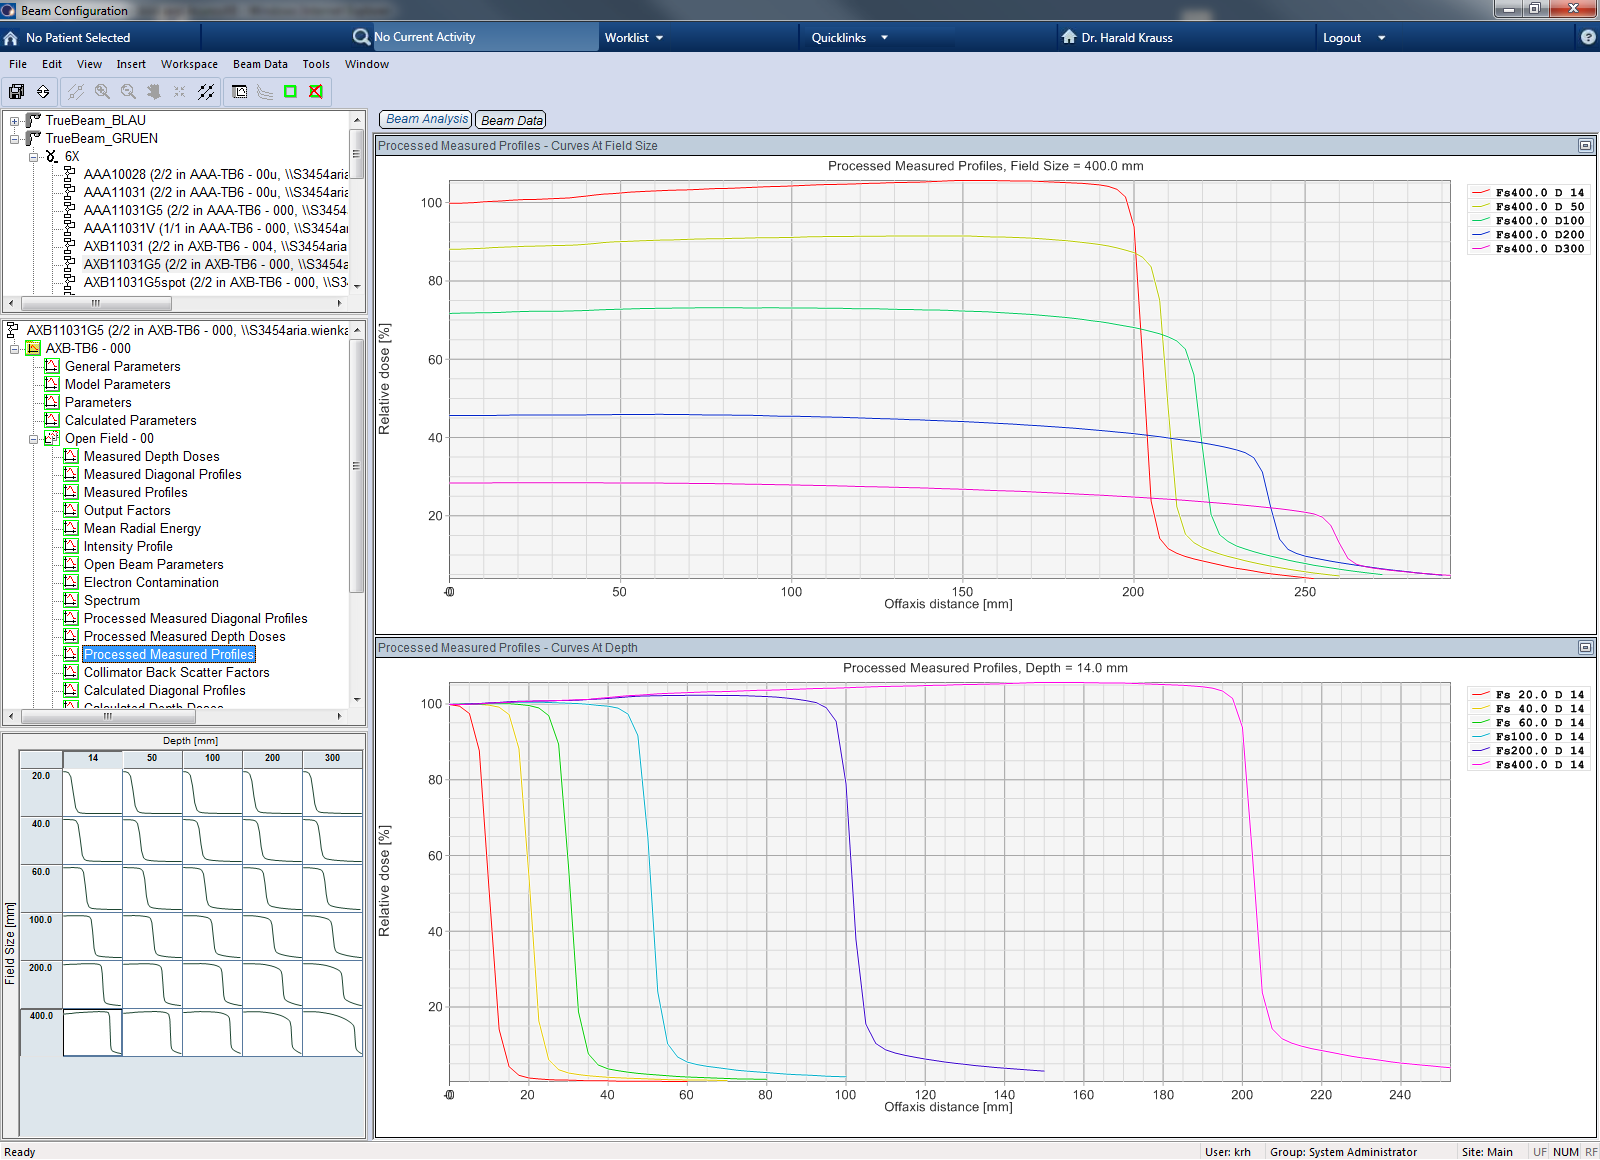
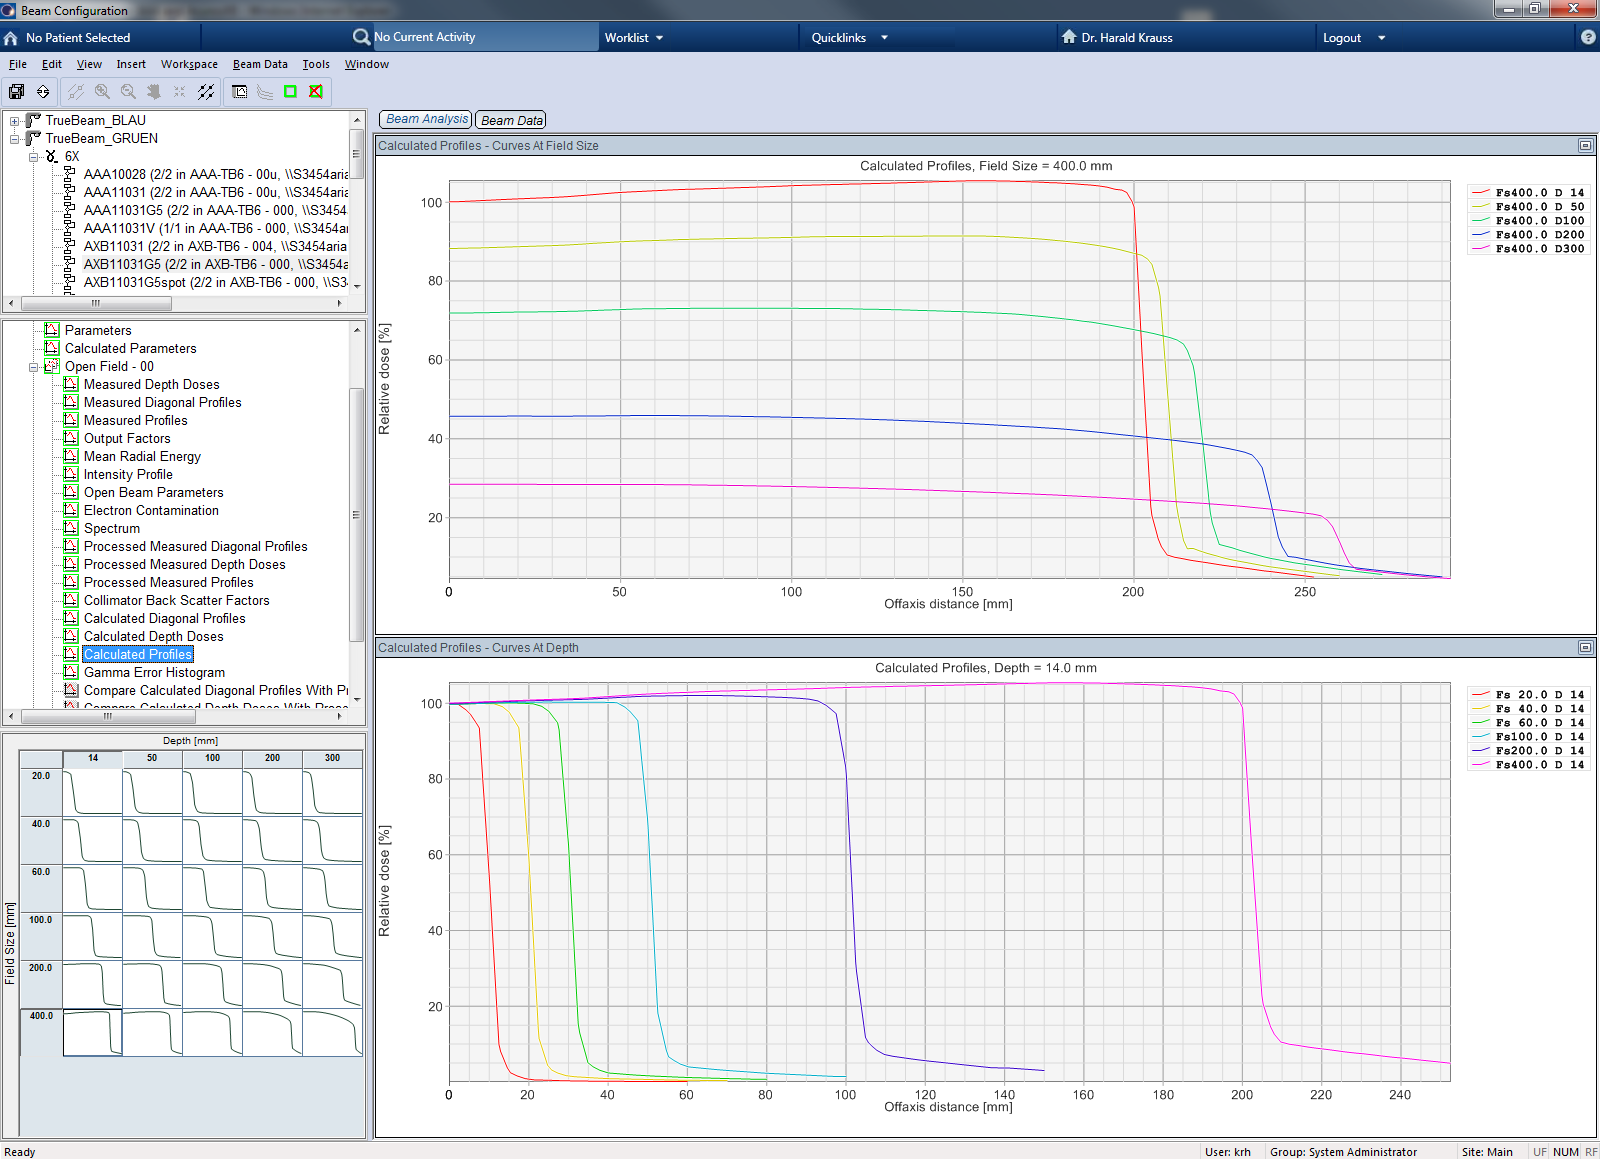
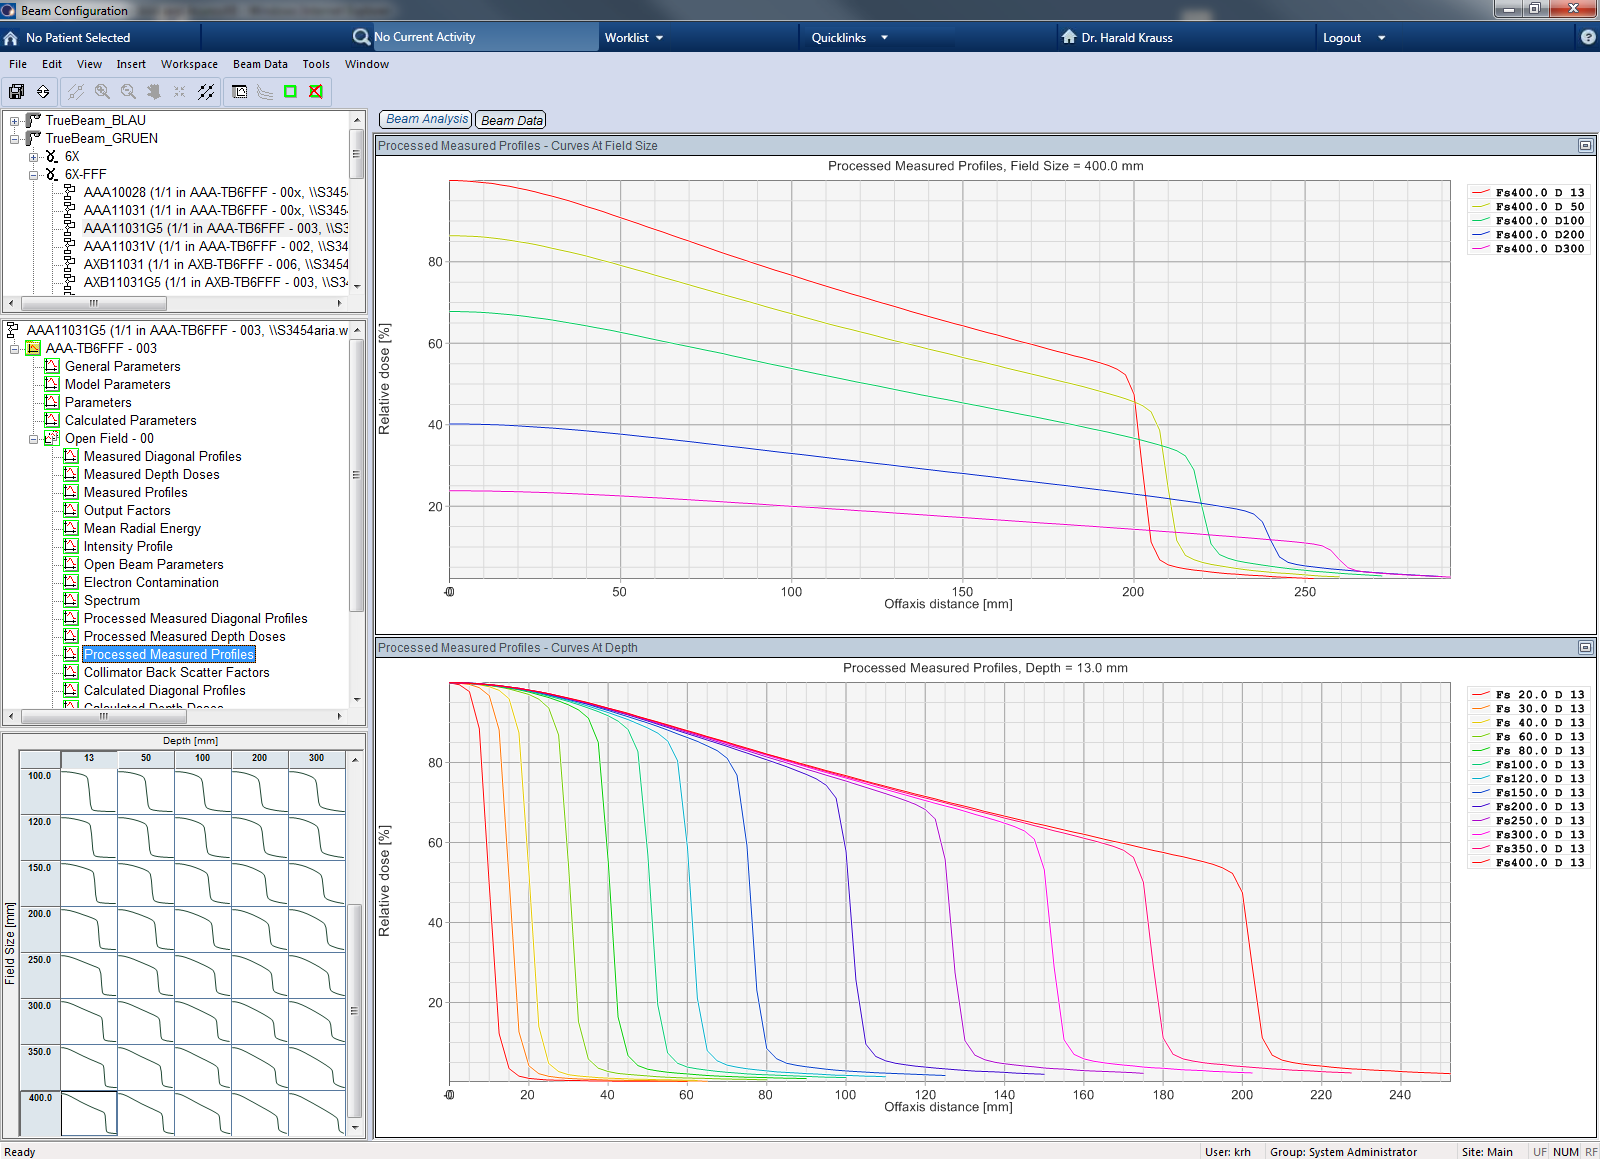
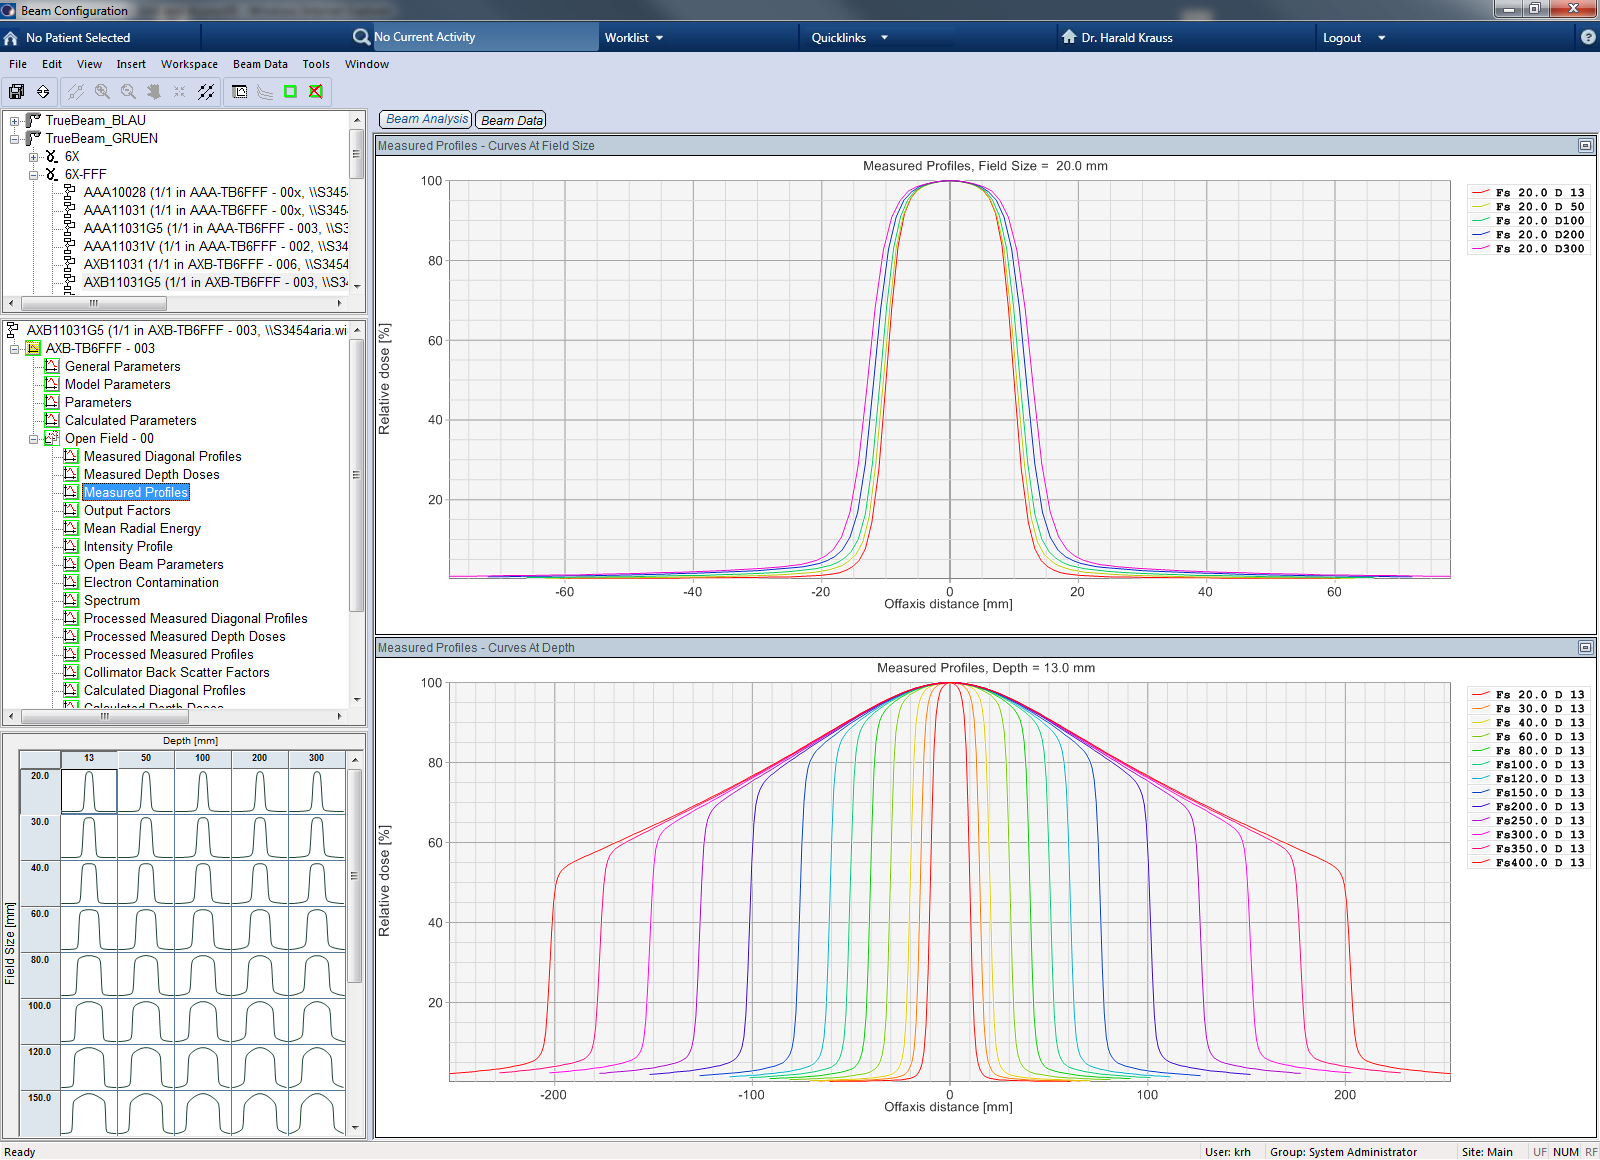
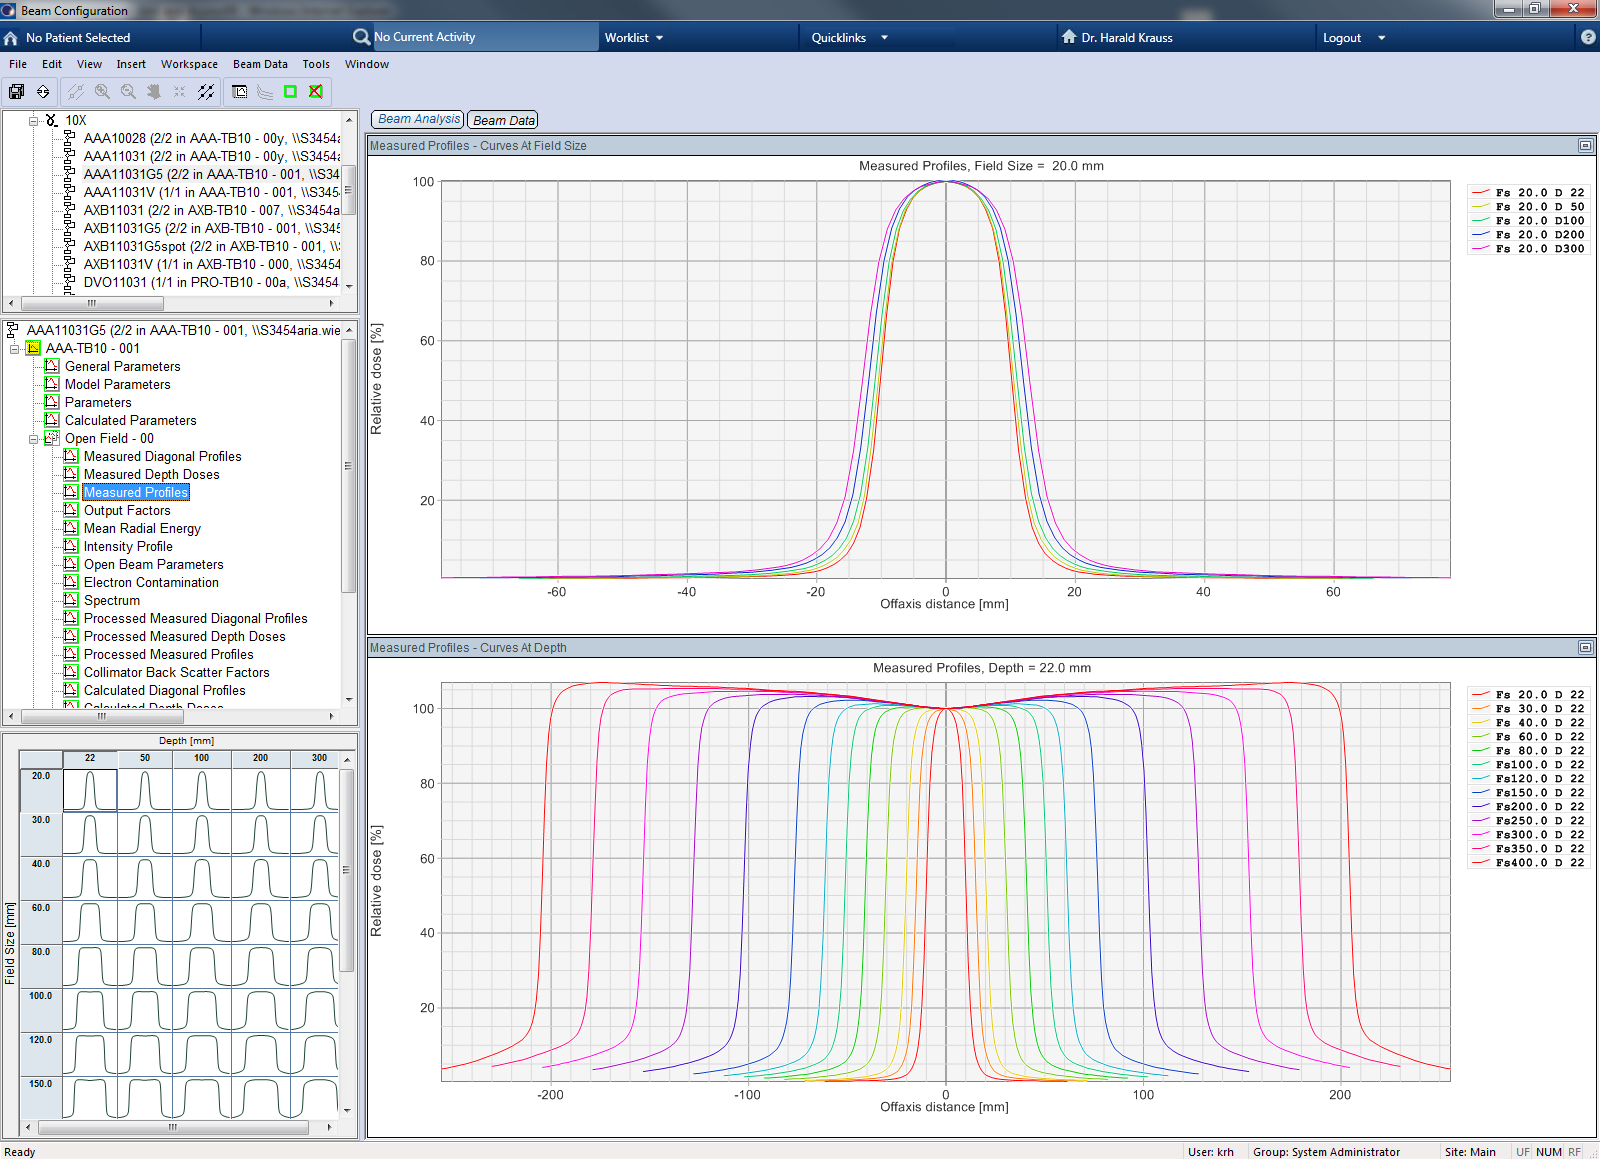
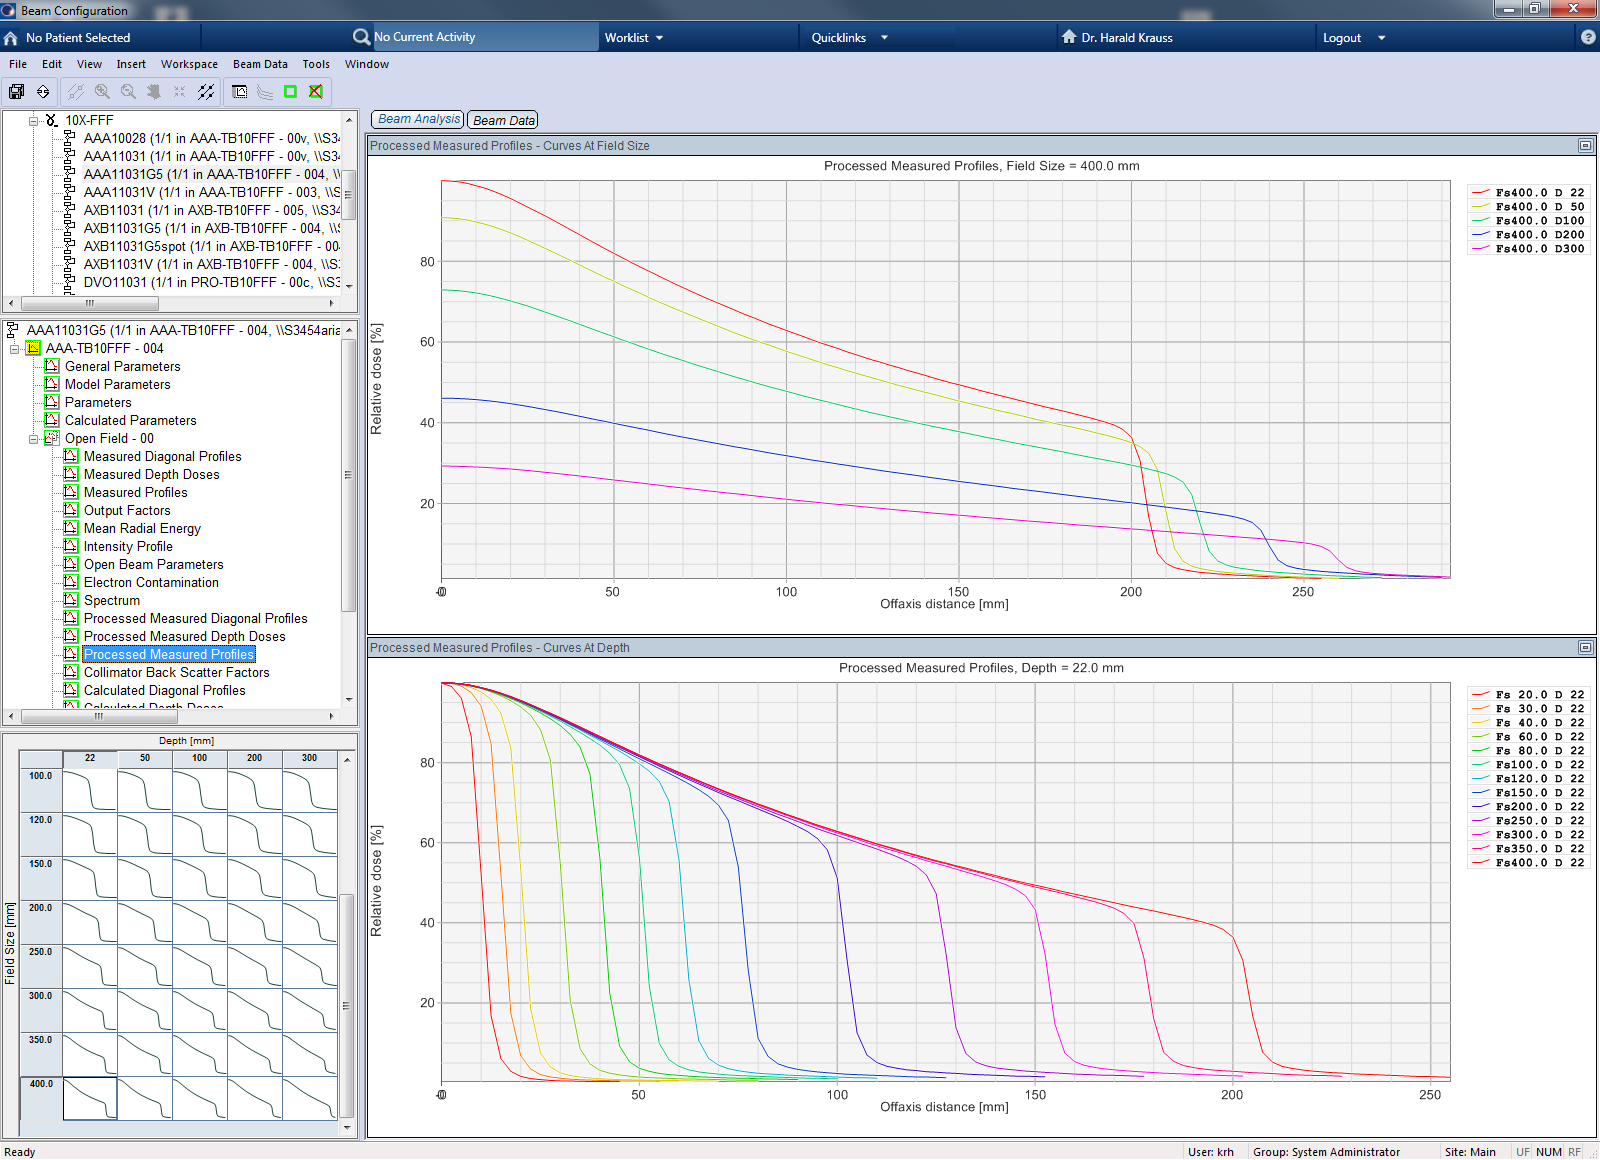
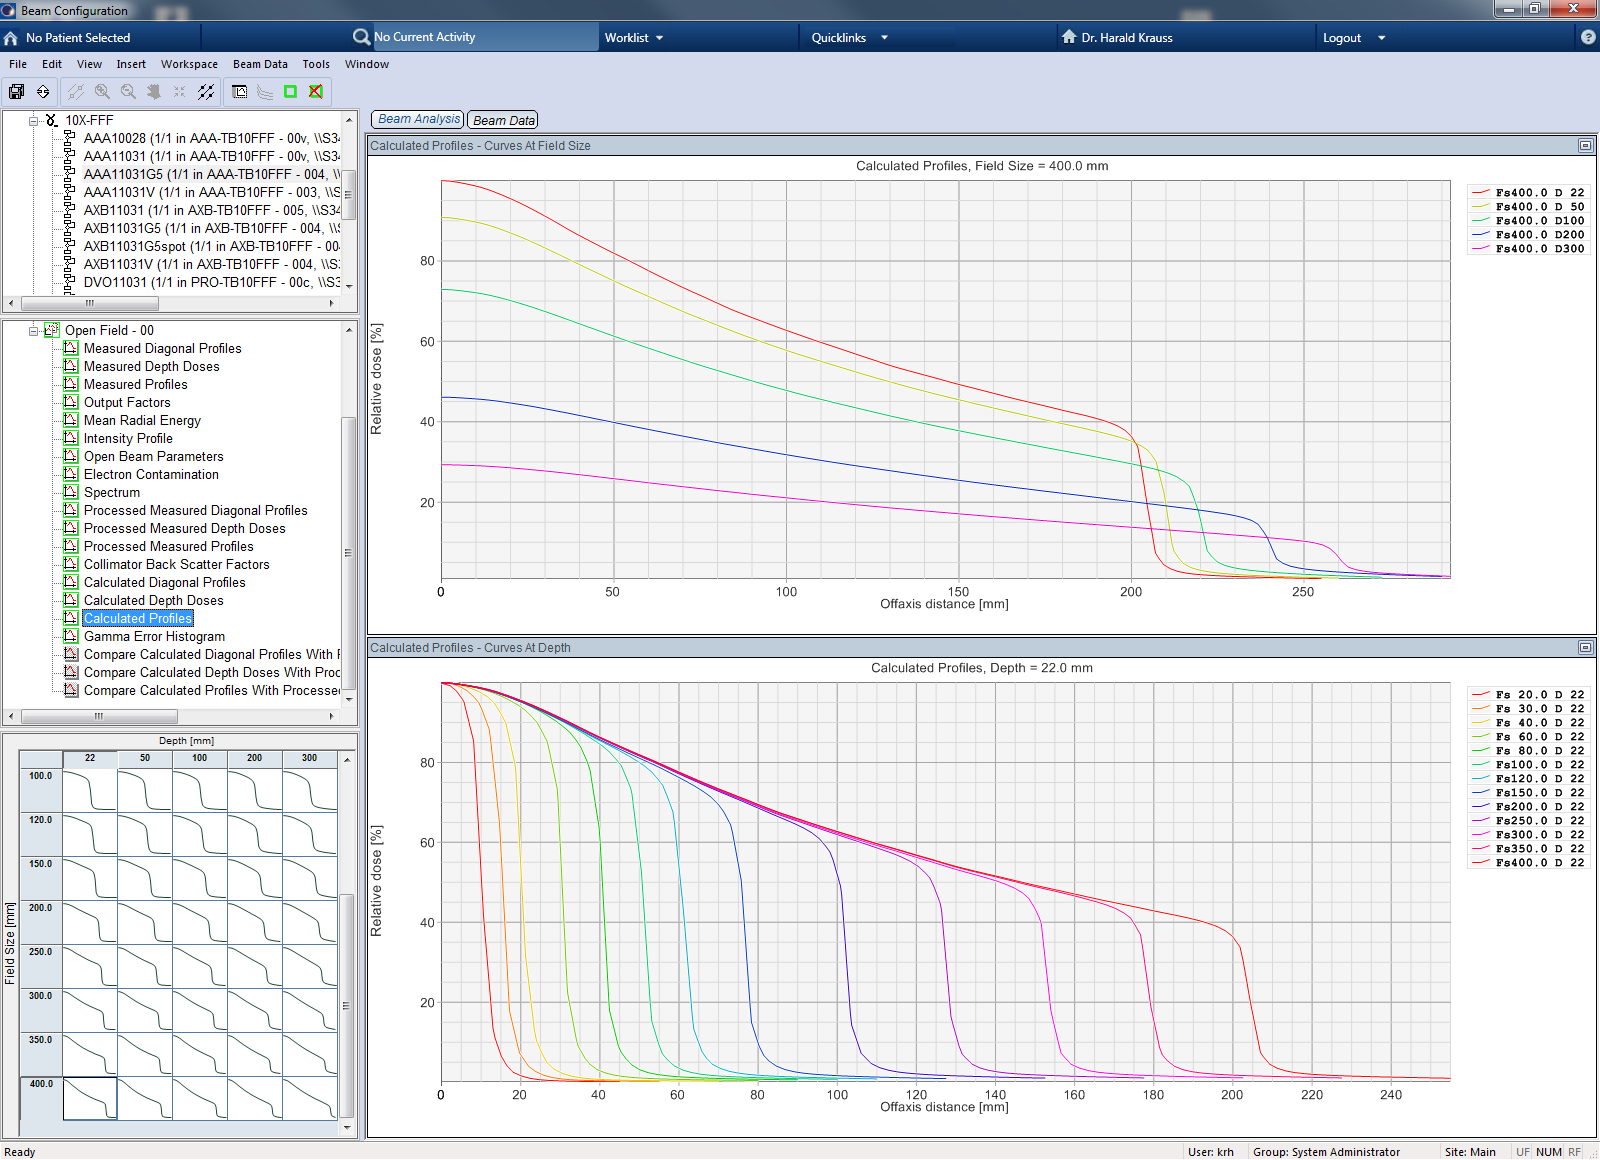
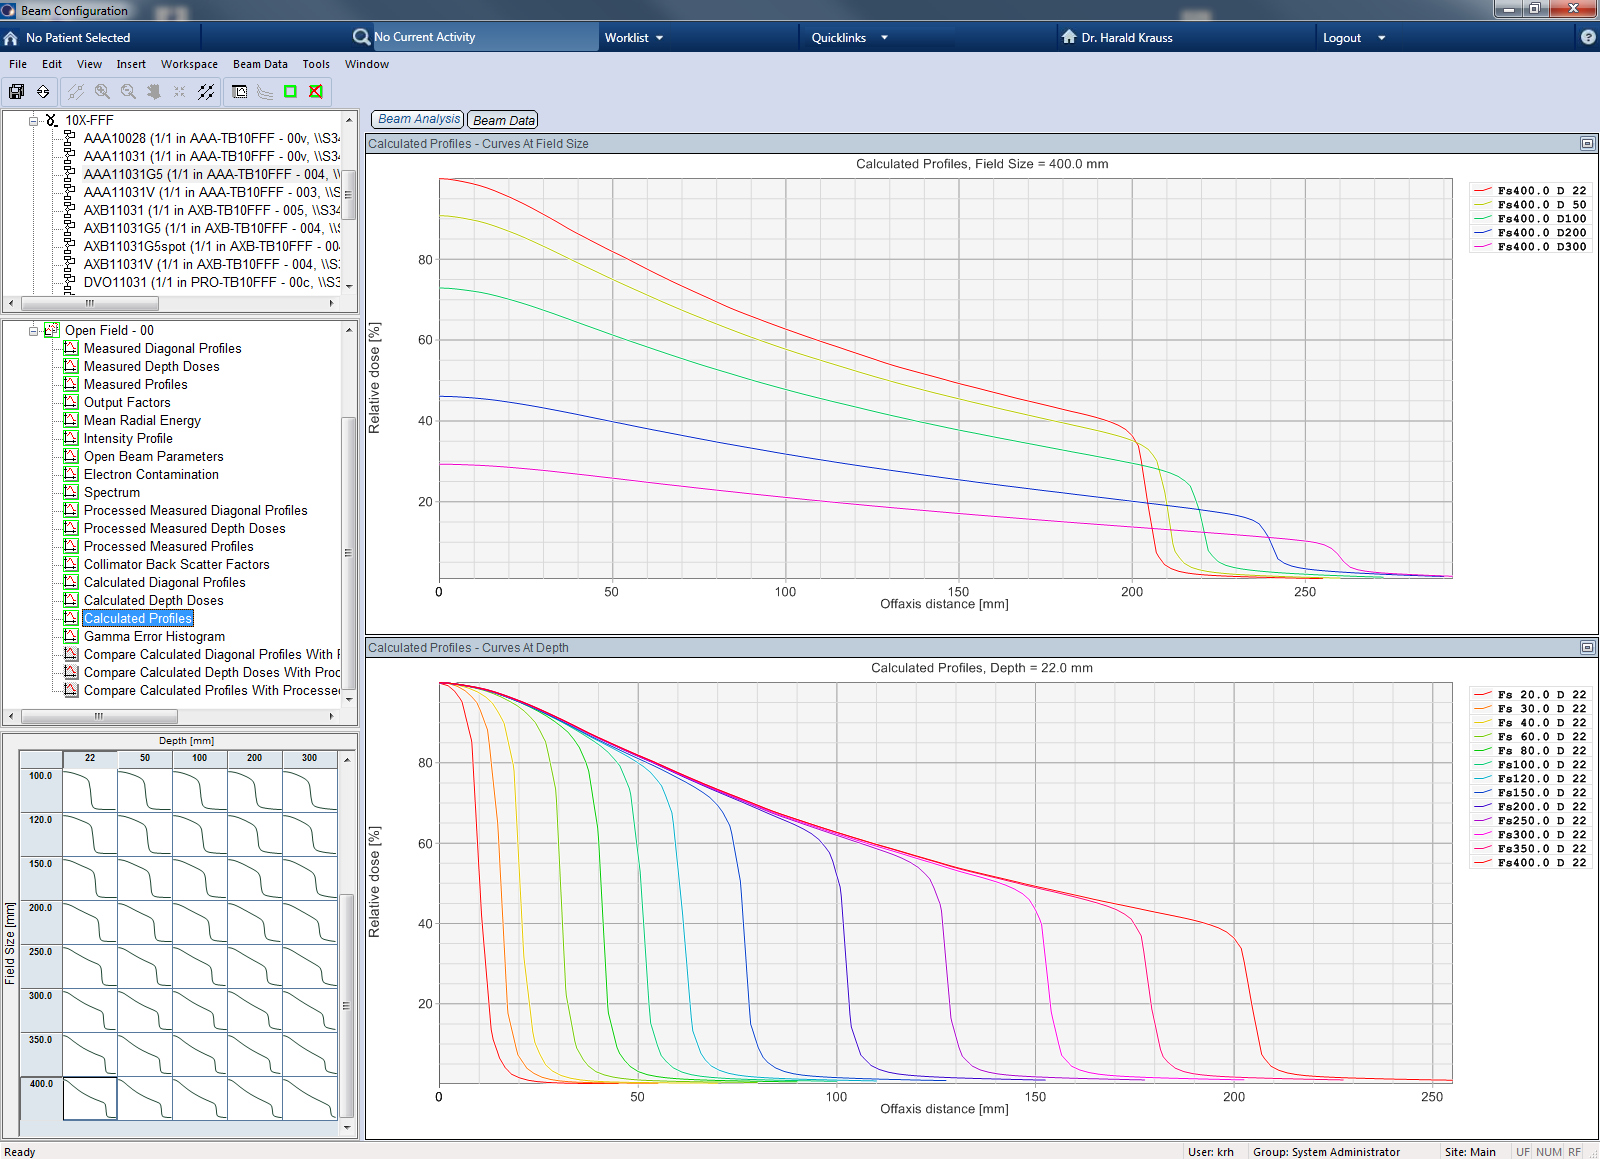
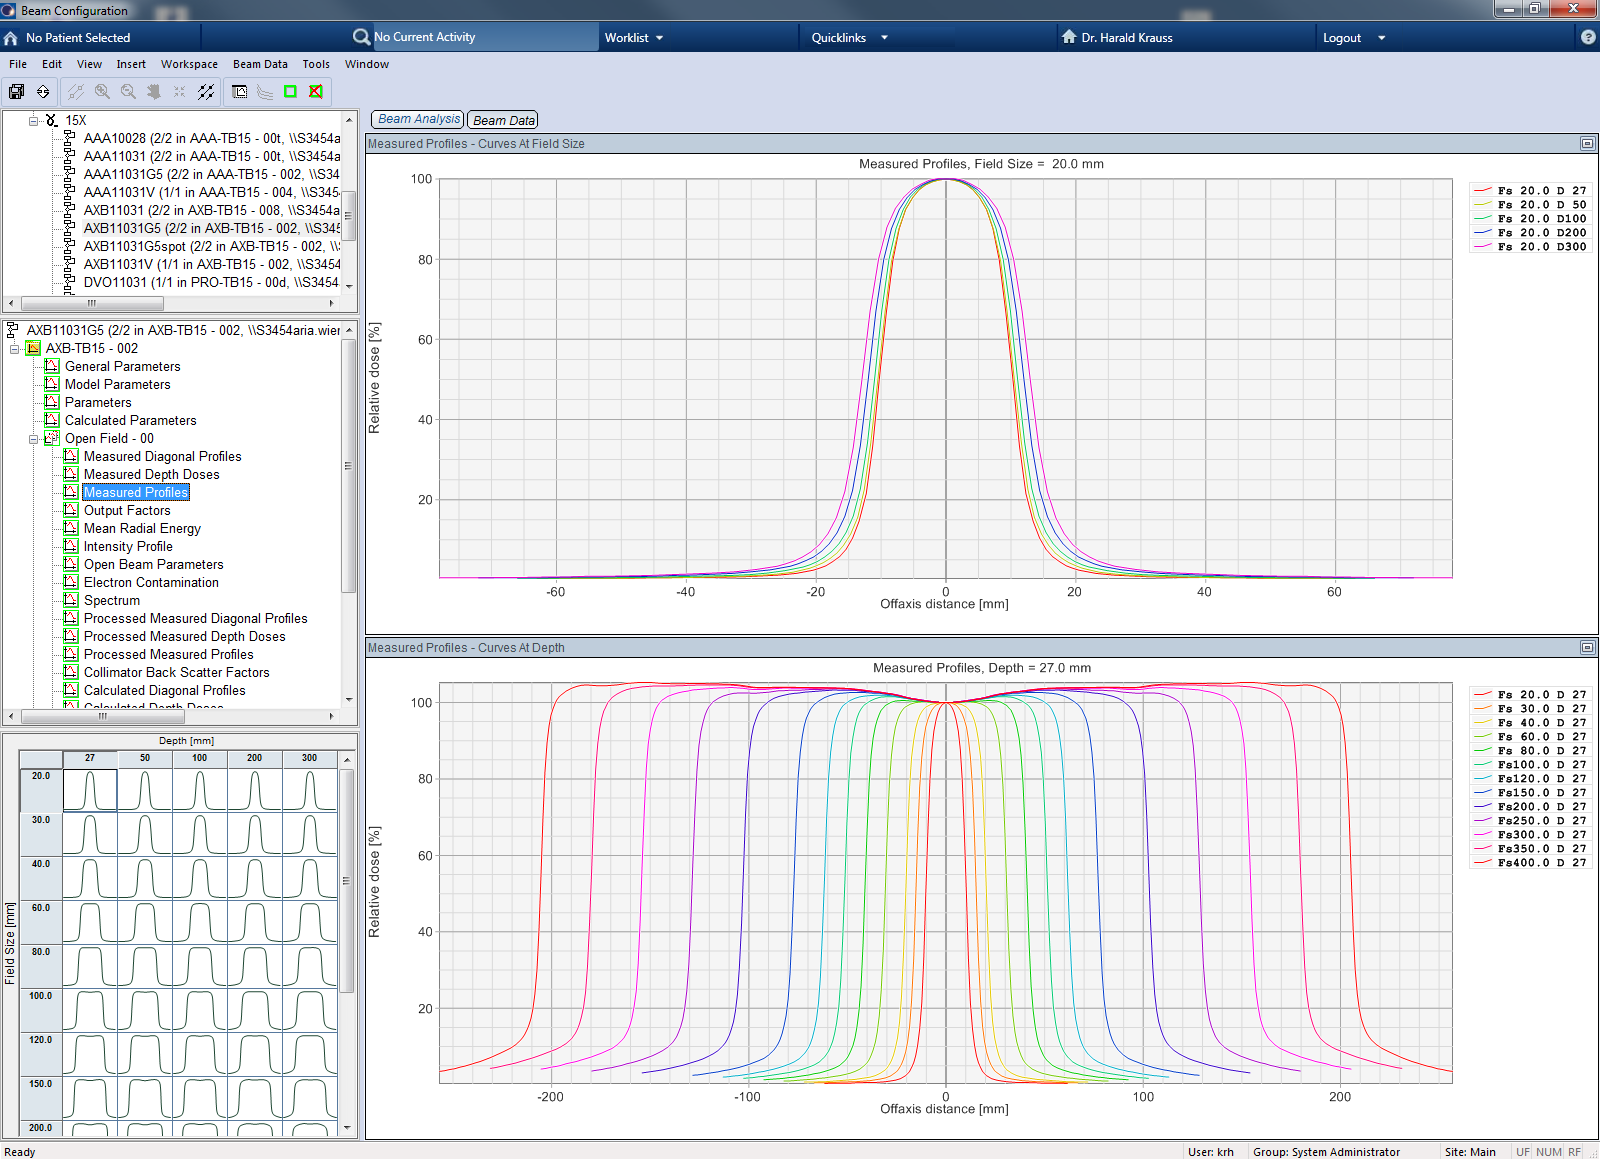
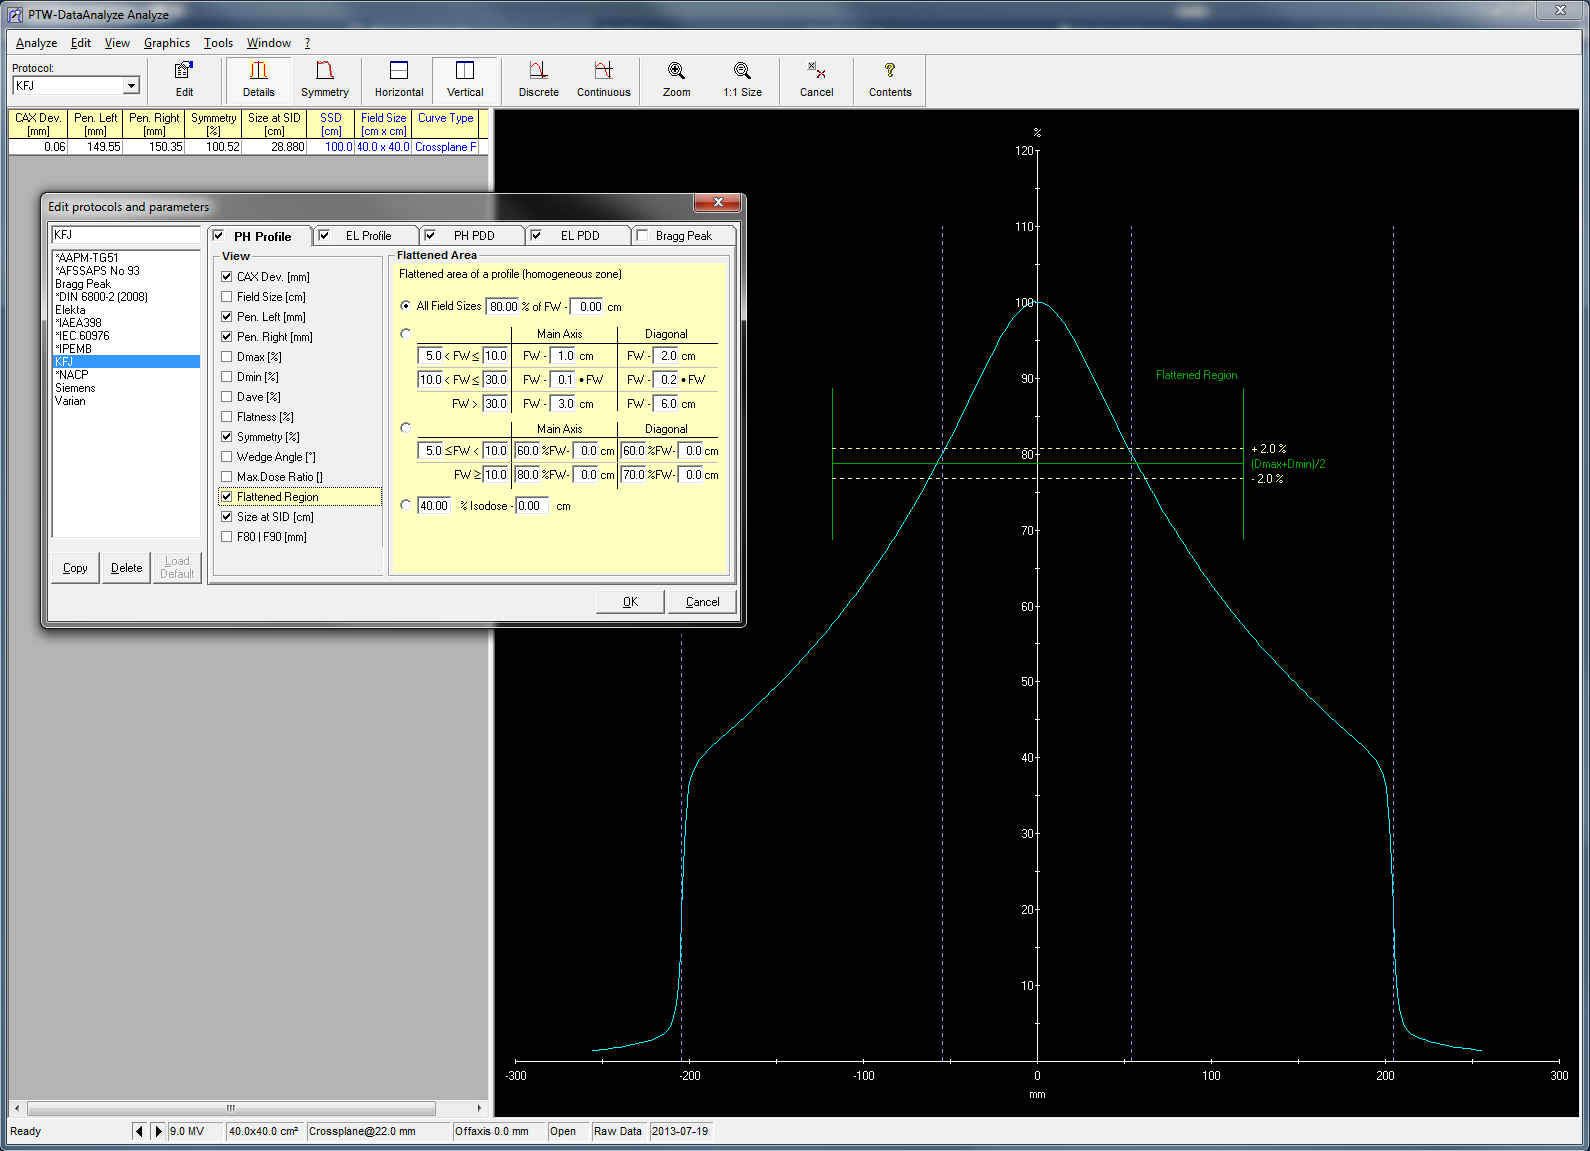
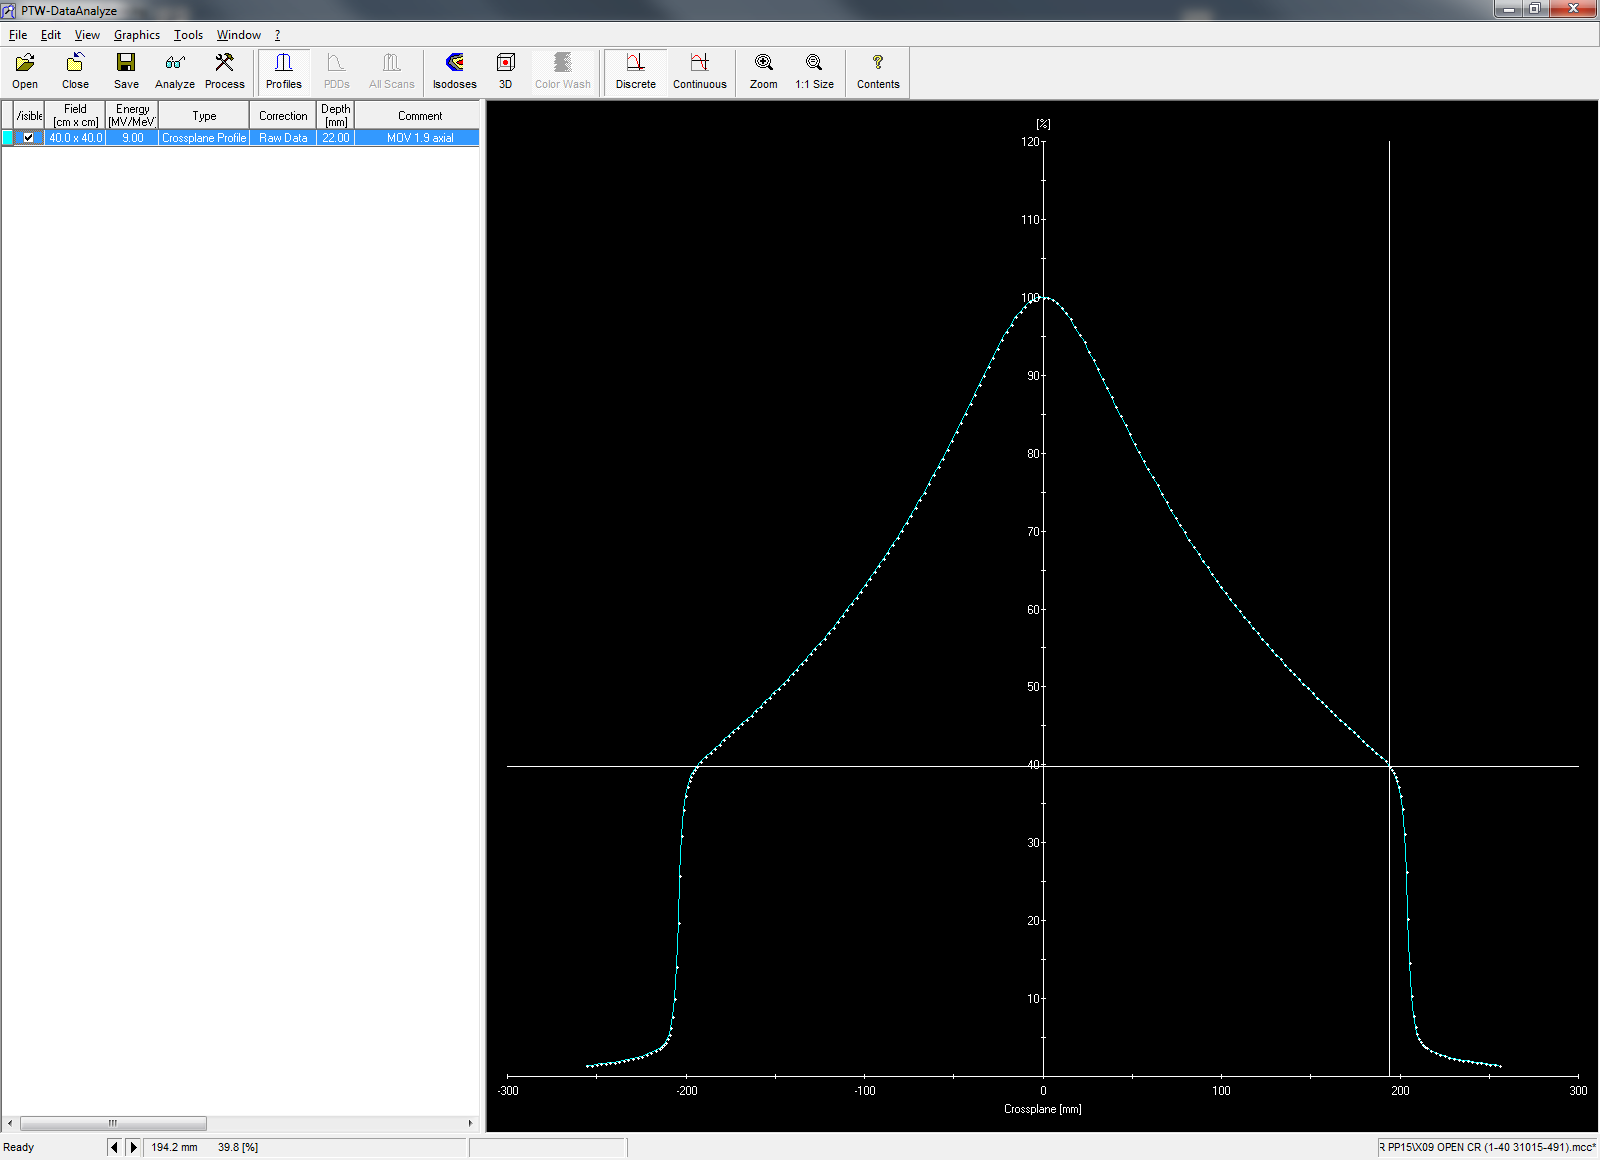
The following plot shows all 10FFF transverse profiles, as measured:
Analysis of Raw Data
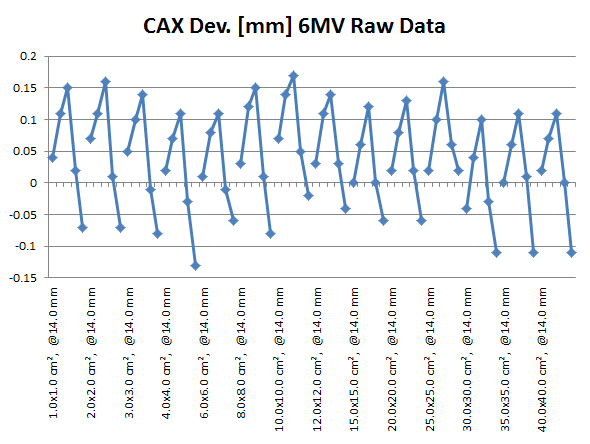
The raw CAX deviations of the X6 crossplane profiles in five depths are shown in the next graph. The values of each group of five are connected with lines. After field size 25, the lateral zero point was shifted by 0.1 mm, bringing the deviations of field 30 "back in line":
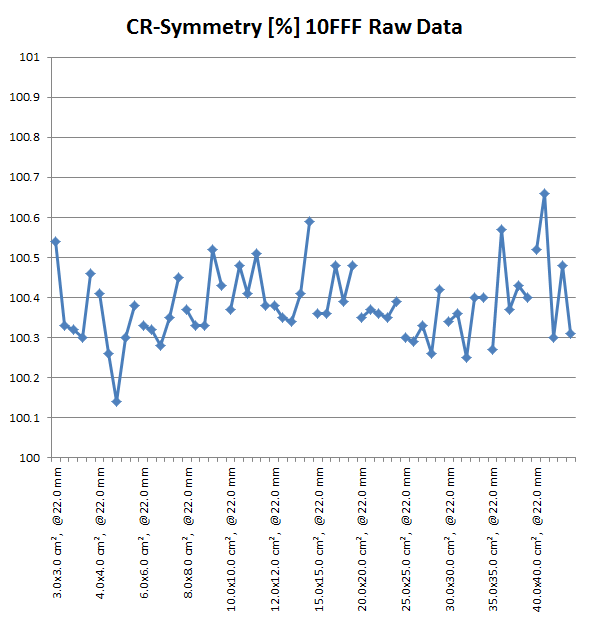
A similar plot can be made for the crossplane symmetry values. The plot starts at field size 3, since the computation of symmetry (based on the presence of a "flattened region") is difficult for smaller field sizes:
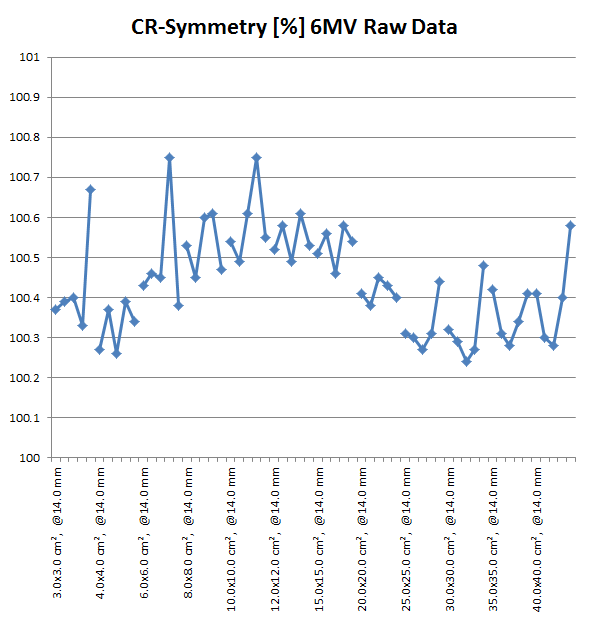
The respective plots for the other four energies look very similar. Here are the two plots for the 10FFF energy:
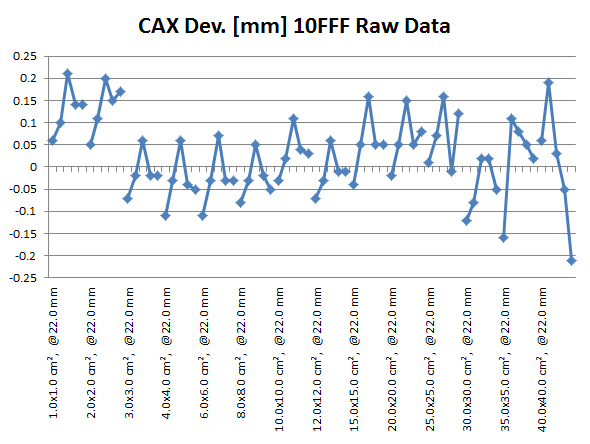
The lateral zero point was adjusted by 0.1 mm twice in the series: before the 3 x 3 and the 30 x 30 field.
Dose rate during the 10FFF water phantom scans was 2400 MU/min.
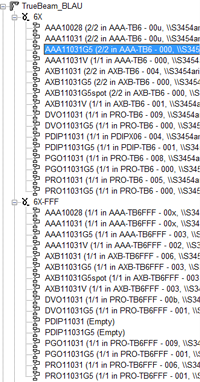
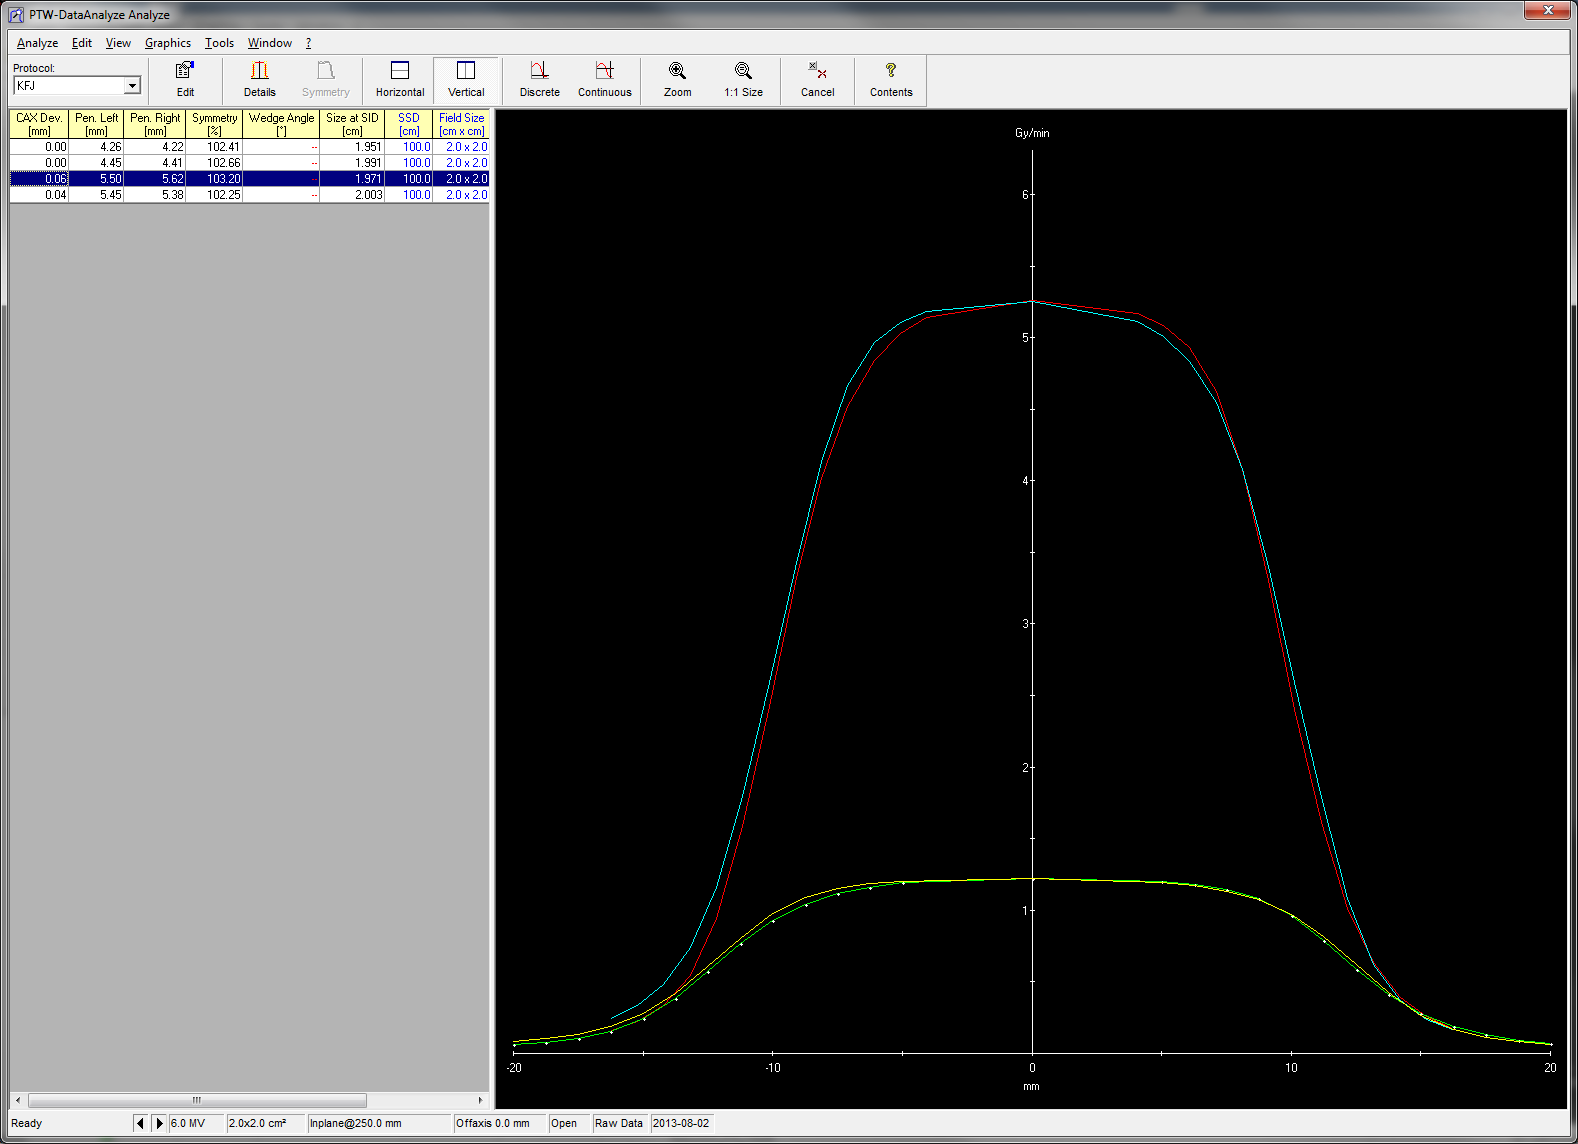
Note that the computation of symmetry for FFF beams has some shortcomings, if it is based on established protocols. Symmetry calculation is restricted to a homogeneous zone, the "flattened region" of the beam. By defining the flattened region as the region within 80% of the FWHM, the penumbra region is excluded from the symmetry computation. Except for very small field sizes, this works well:
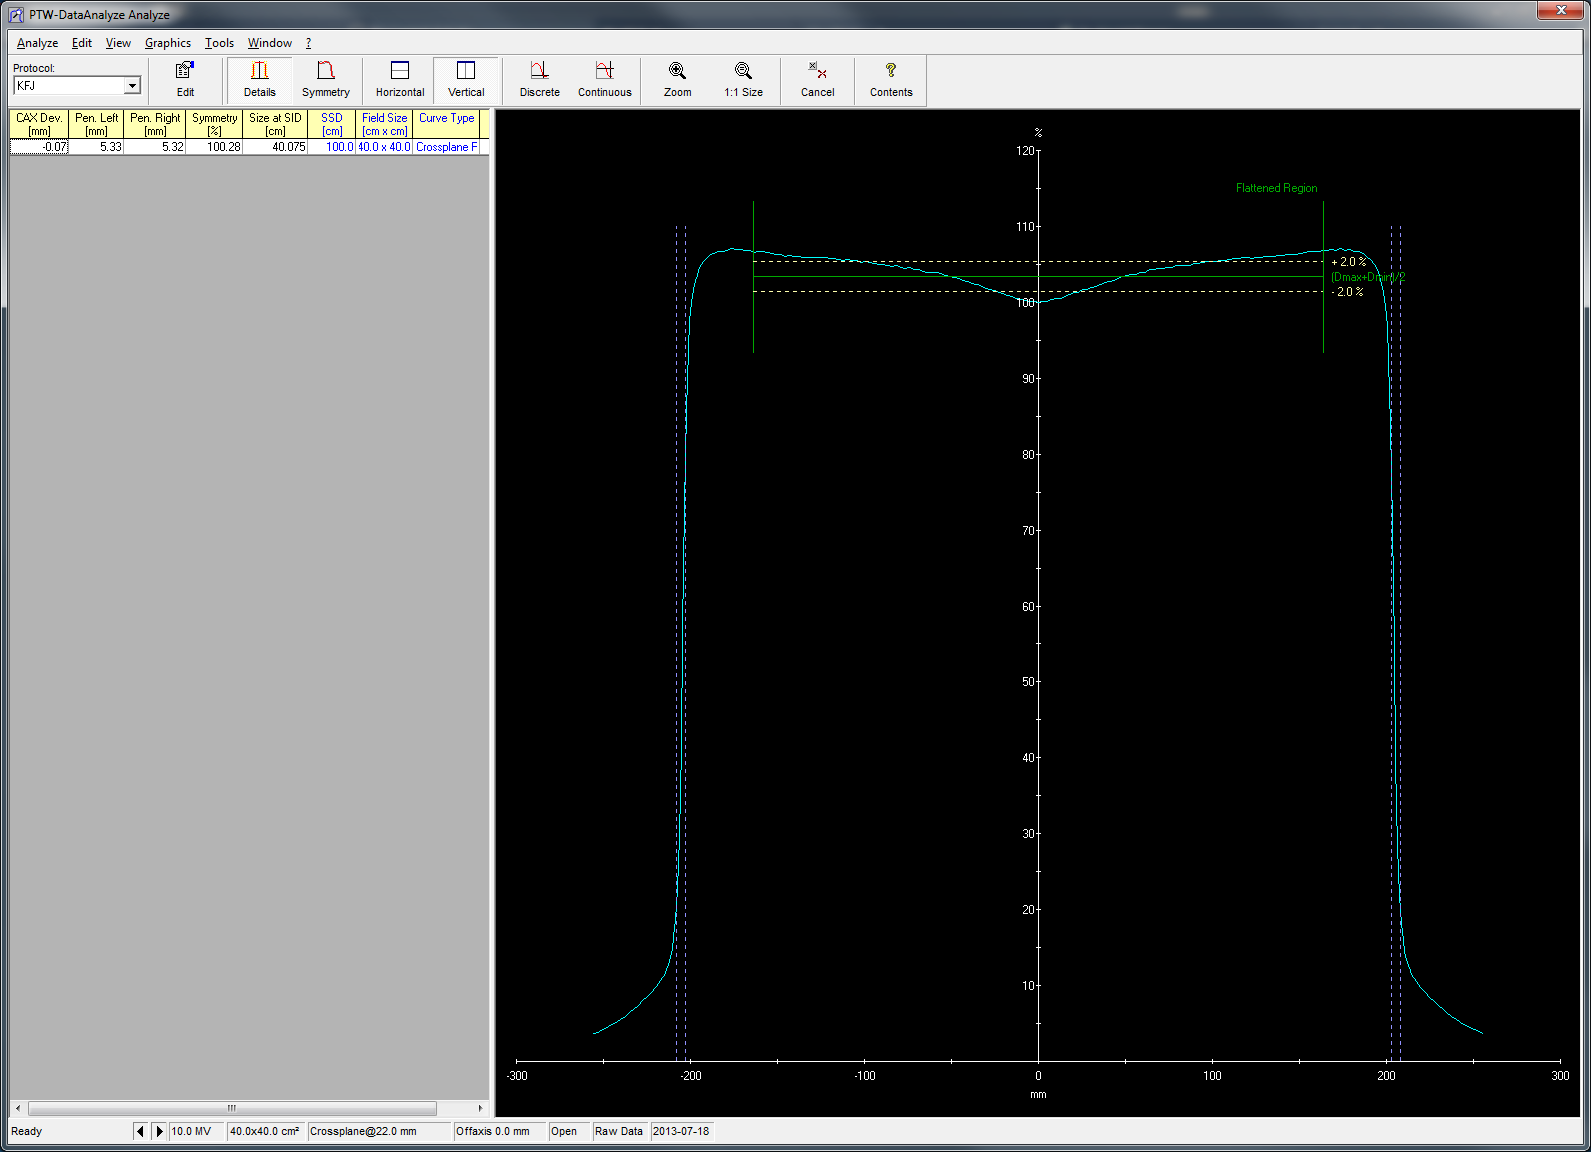
If the same protocol is applied to unflattend beams (where a homogeneous zone or flattened region does not exist), the region for symmetry computation gets too small, especially at larger field sizes:
This is simply because FWHM is the beam width at 50% of the maximum value, and 80% of this width (green bar in the screenshot) is taken (as can be seen on the last screenshot, there are alternative ways to define the flattened region).
New ways of calculating symmetry are under development, but it will take some time until they are implemented in international dosimetry protocols.
Fortunately, all that is irrelevant for the acquisition of beam data for the treatment planning system.
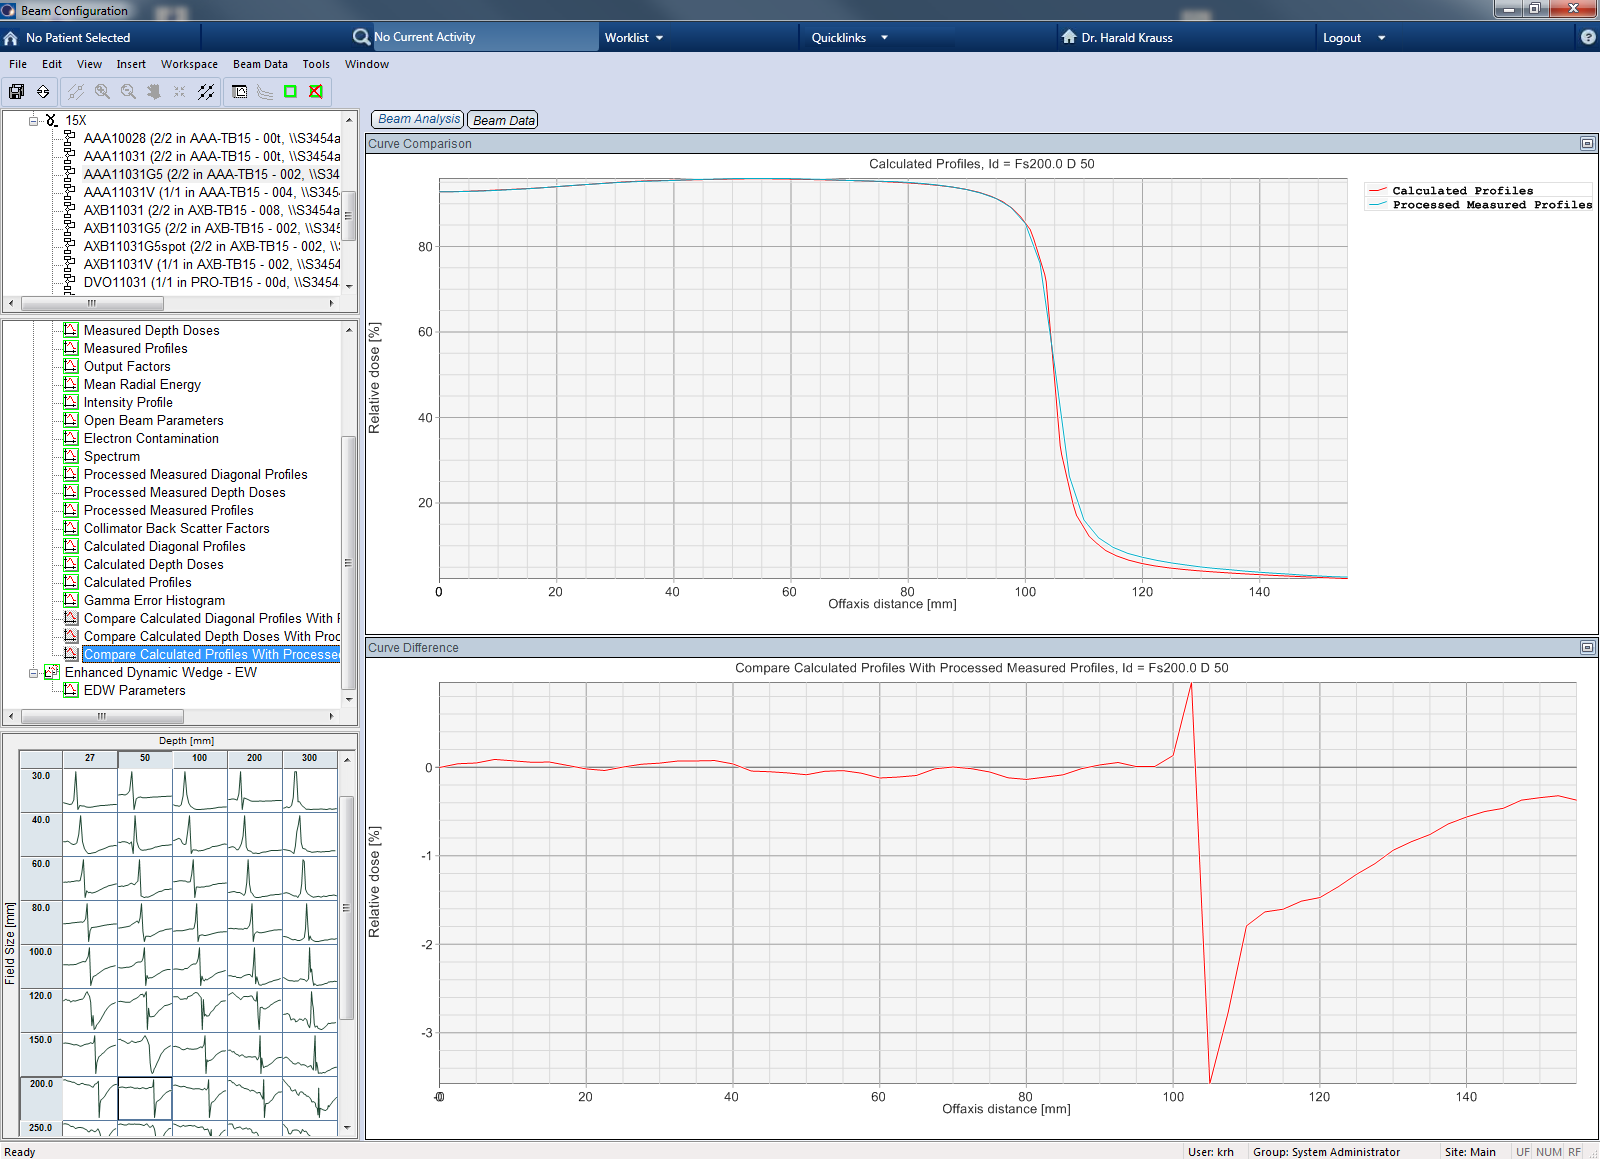
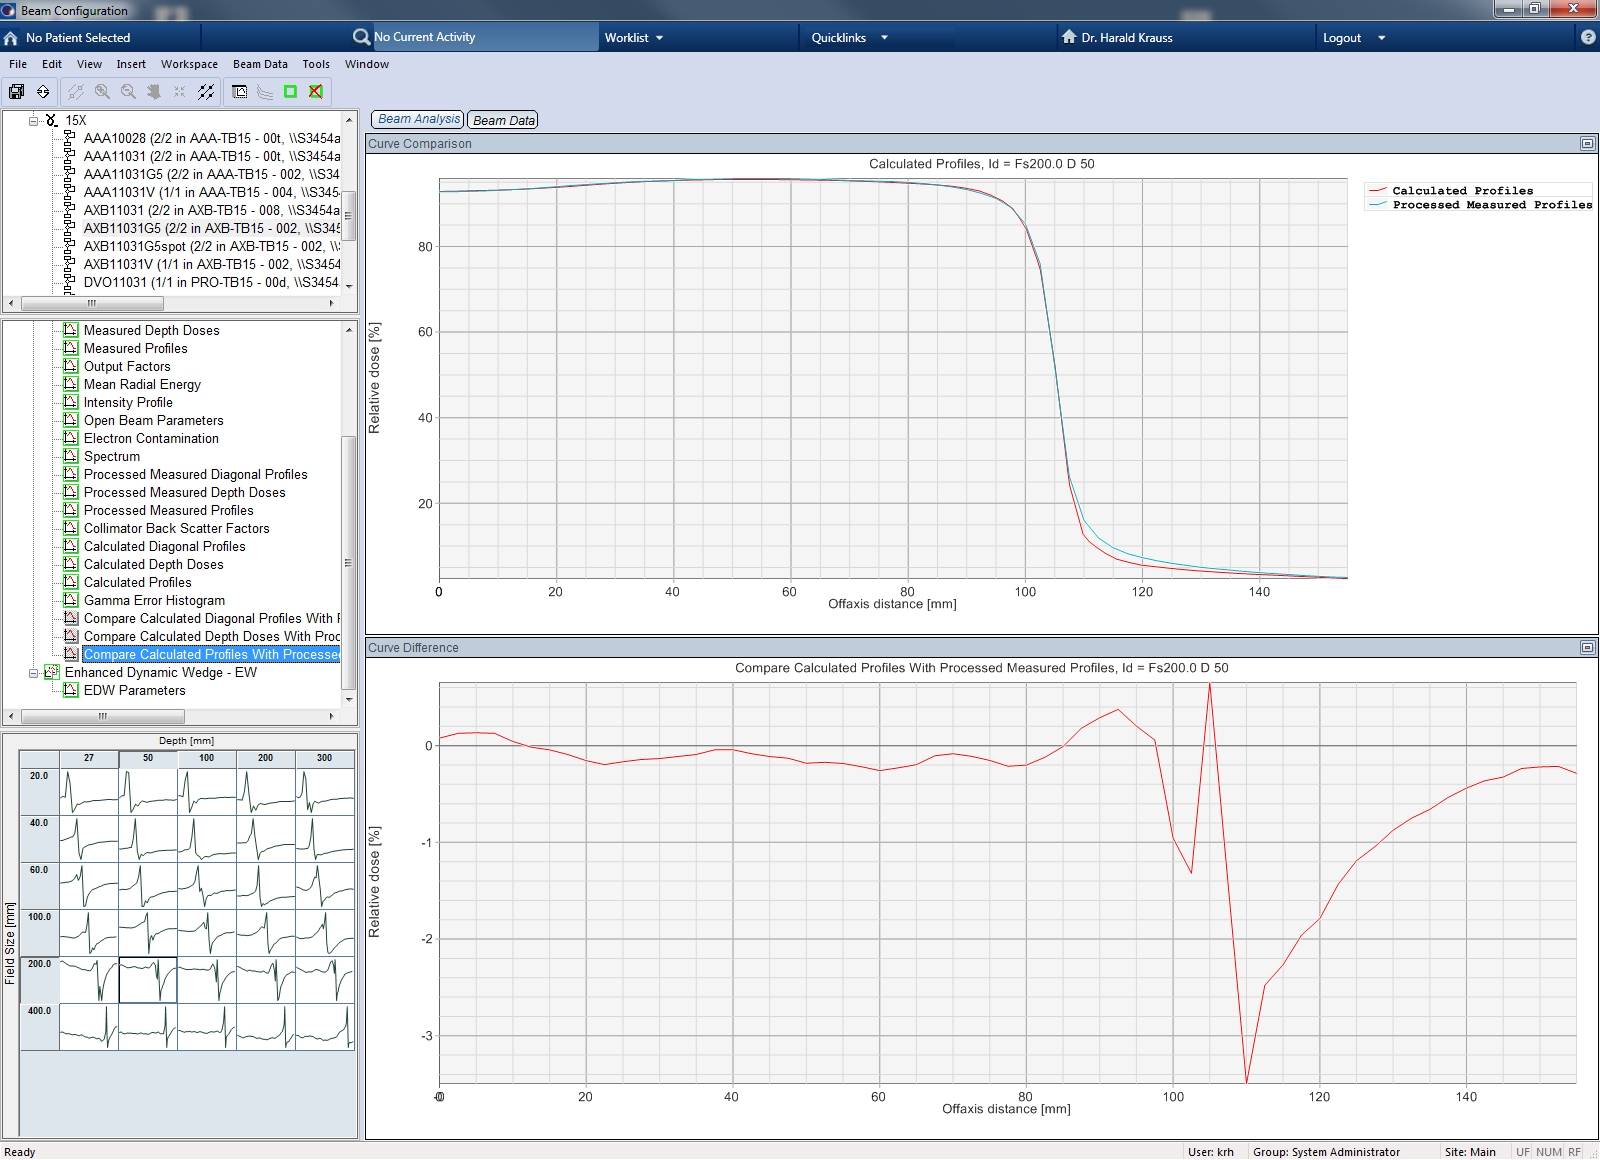
Post-Processing
Three types of post-processing were applied to the raw data, before the curves were formatted for Eclipse:
- sm: in the plateau region, all profiles were smoothed once.
- ed40_300: for the two FFF energies only, a single data point was added to the 40 x 40 cm profile in 300 mm depth, at the location -294.5 mm. The data point value was guessed visually. Otherwise this profile would have been rejected by Eclipse Beam Configuration.
- sym: all profiles were mirrored (symmetrized).
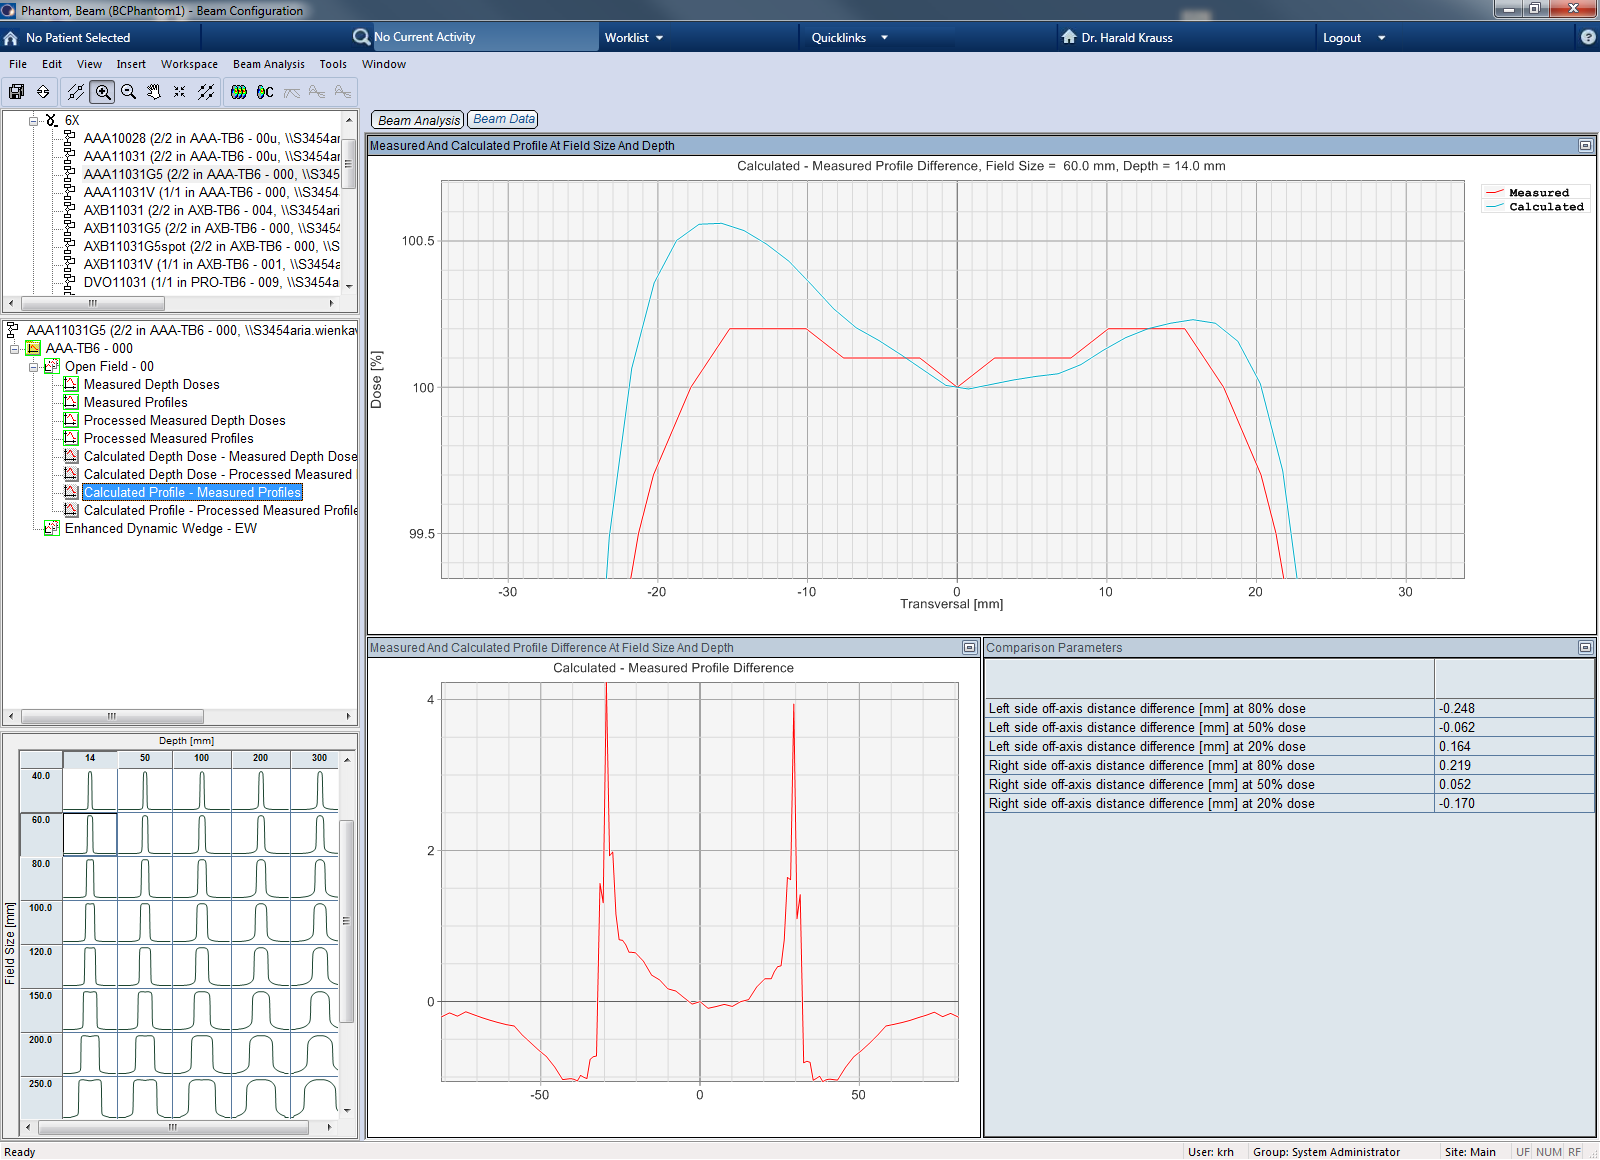
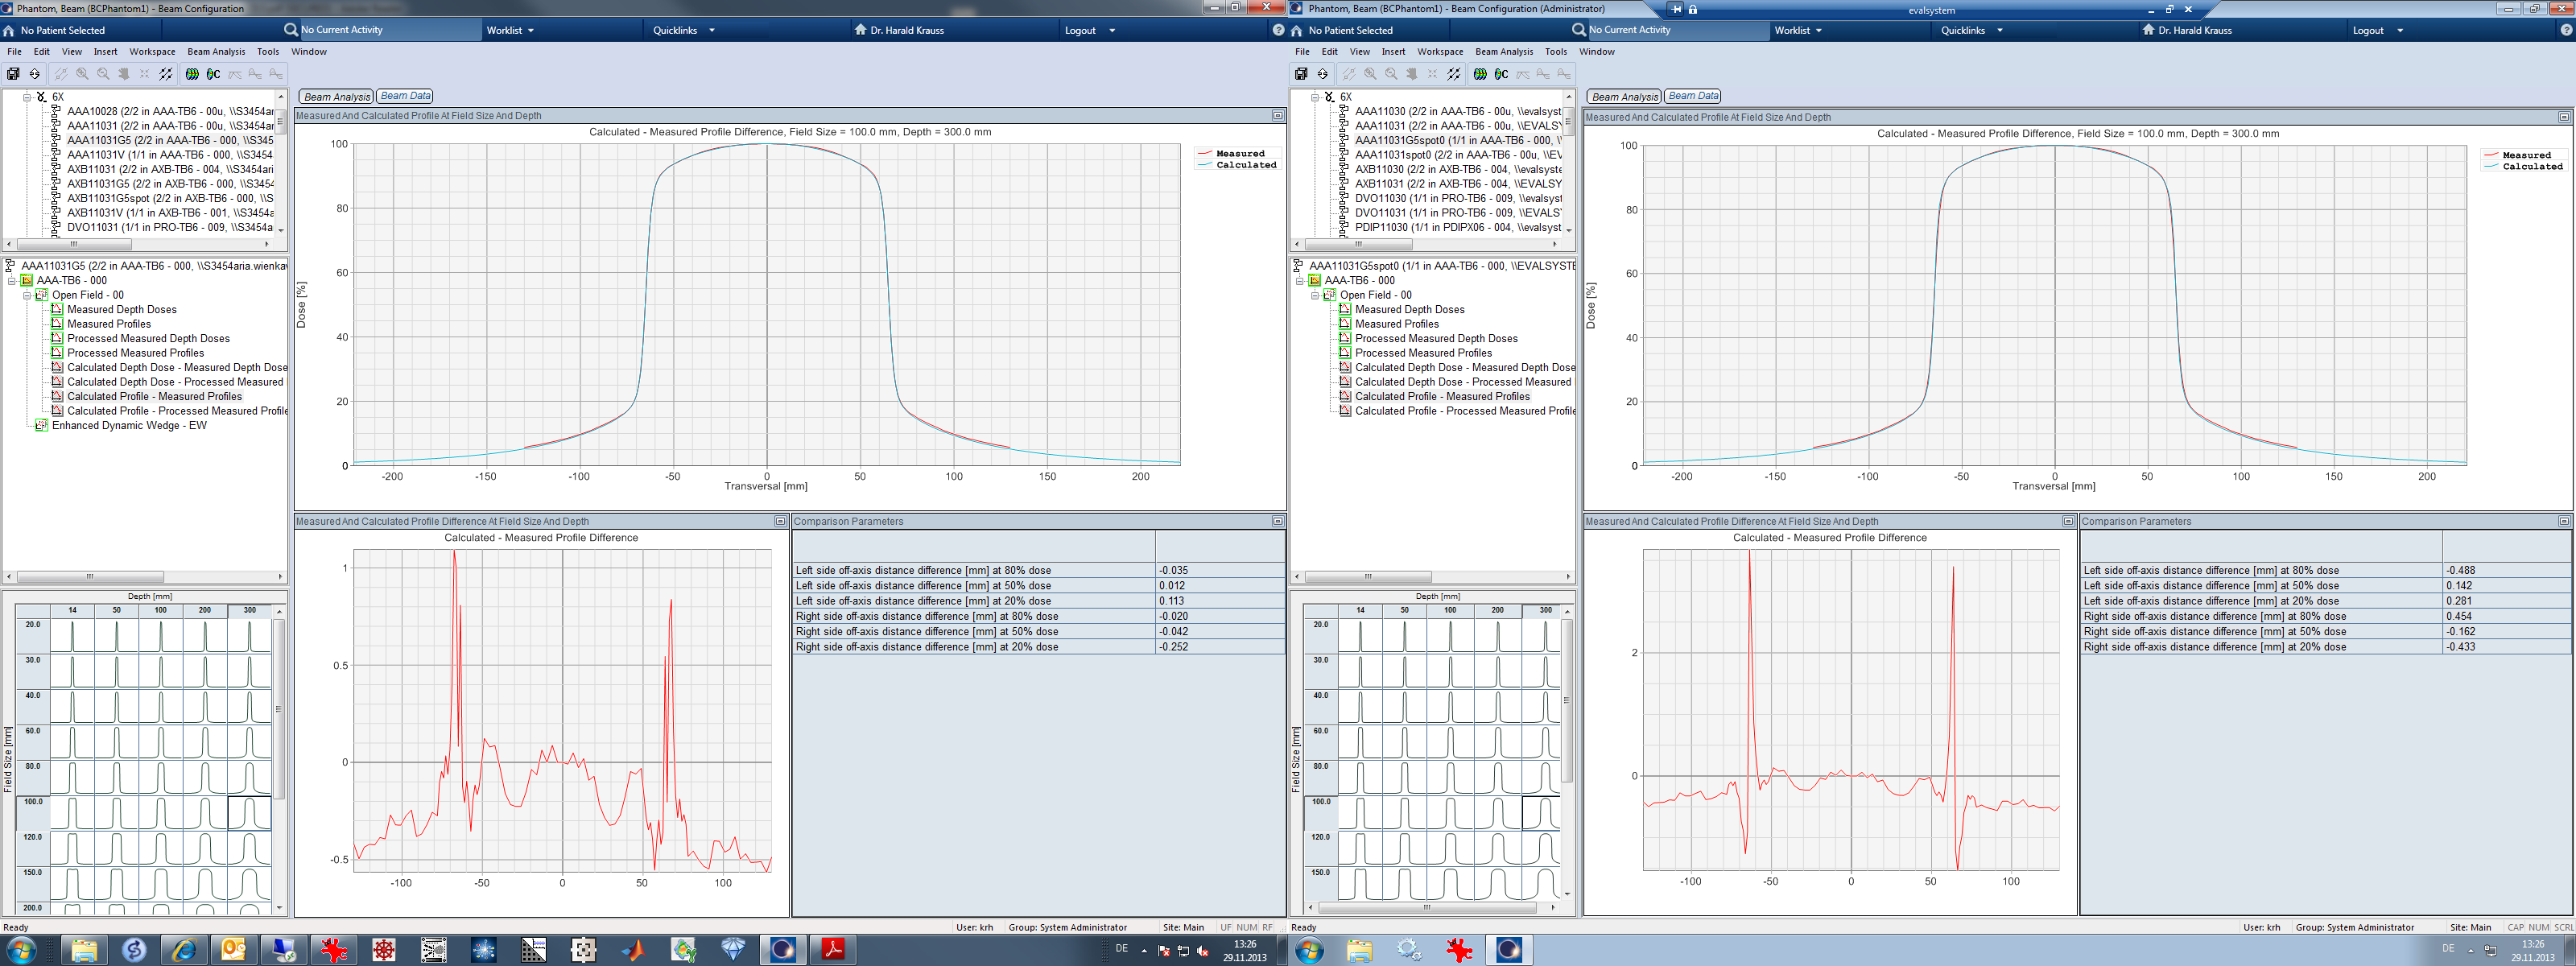
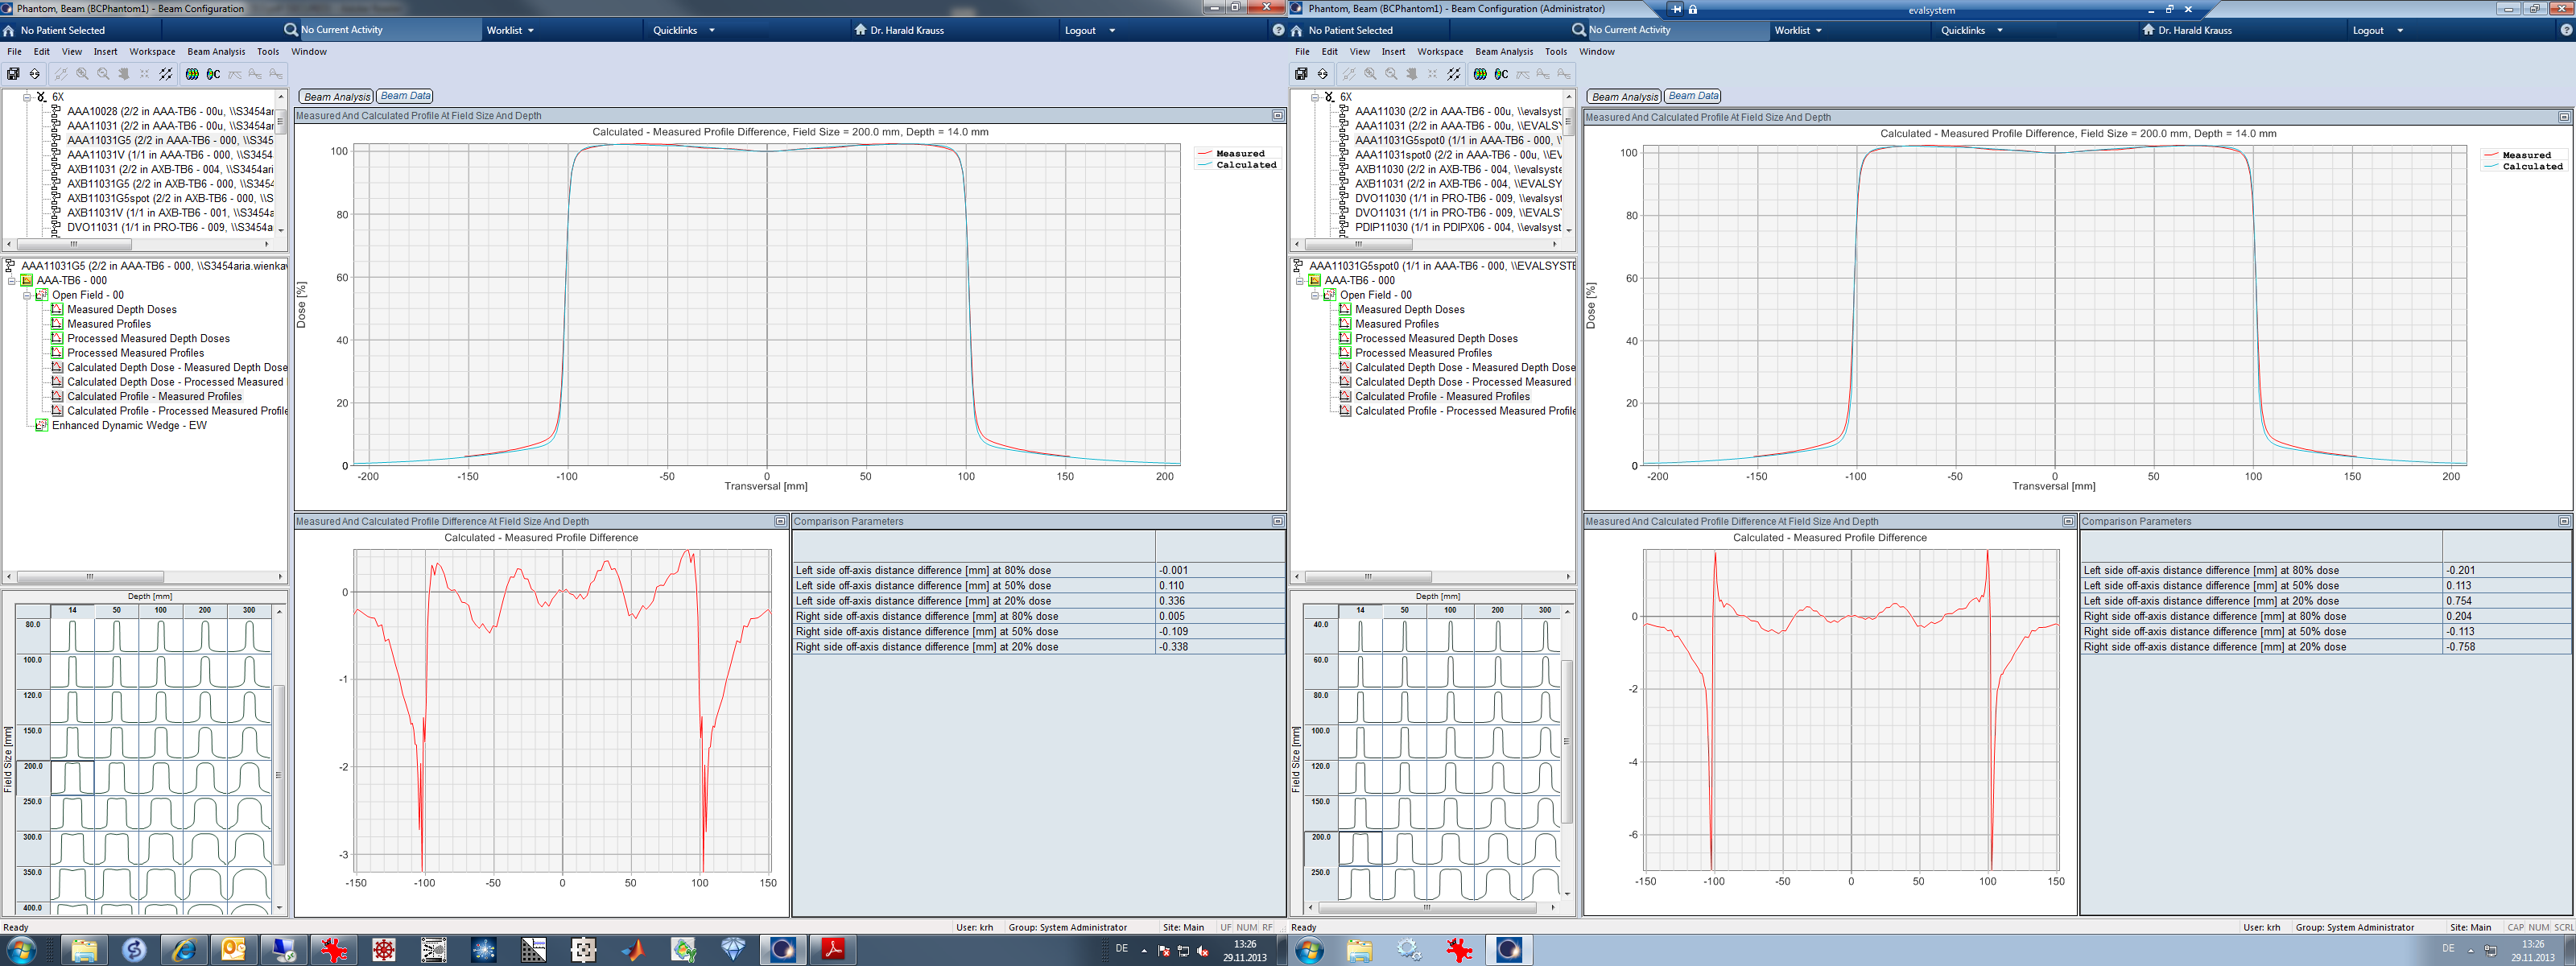
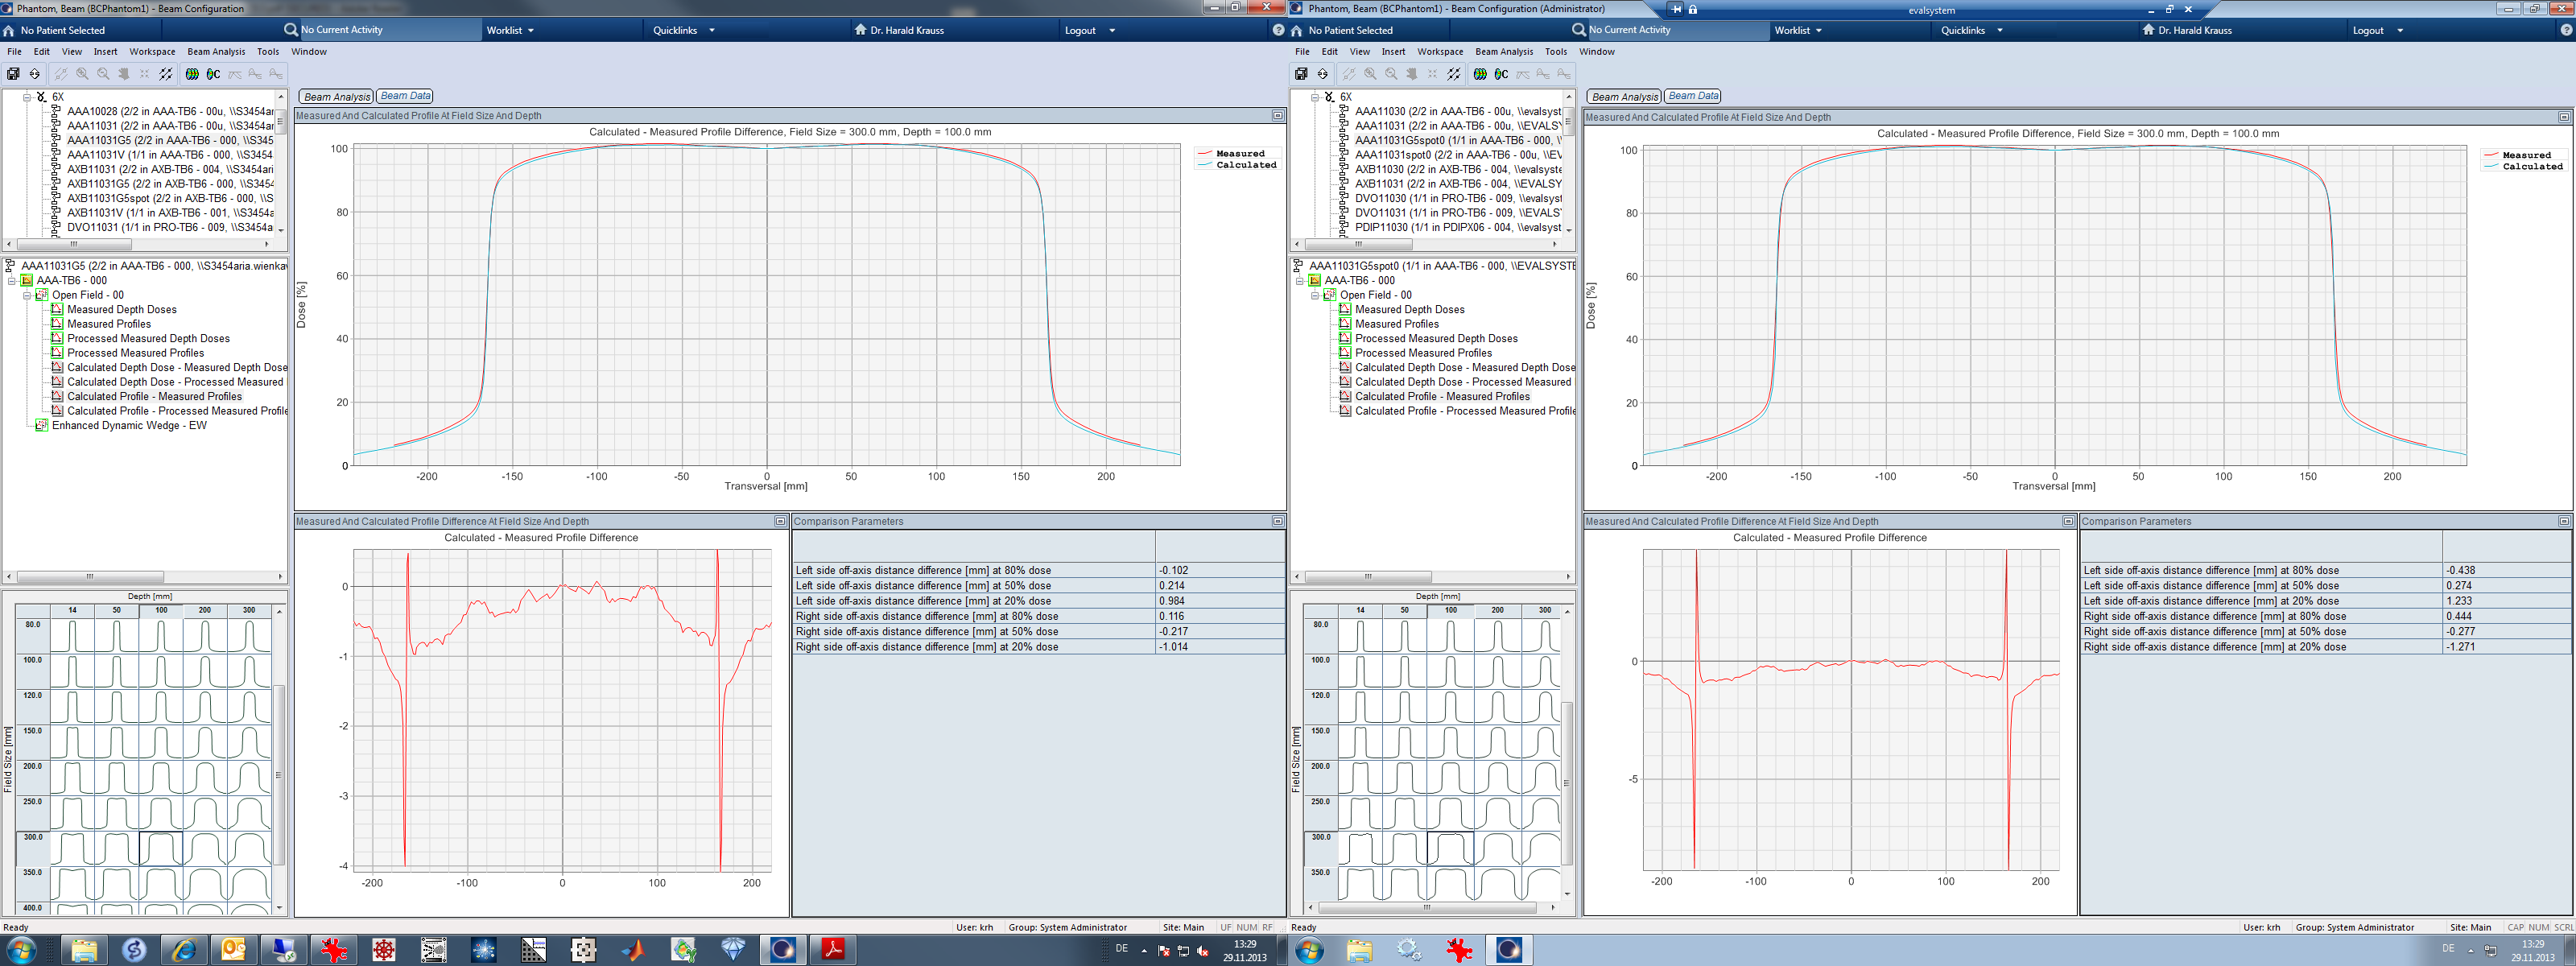
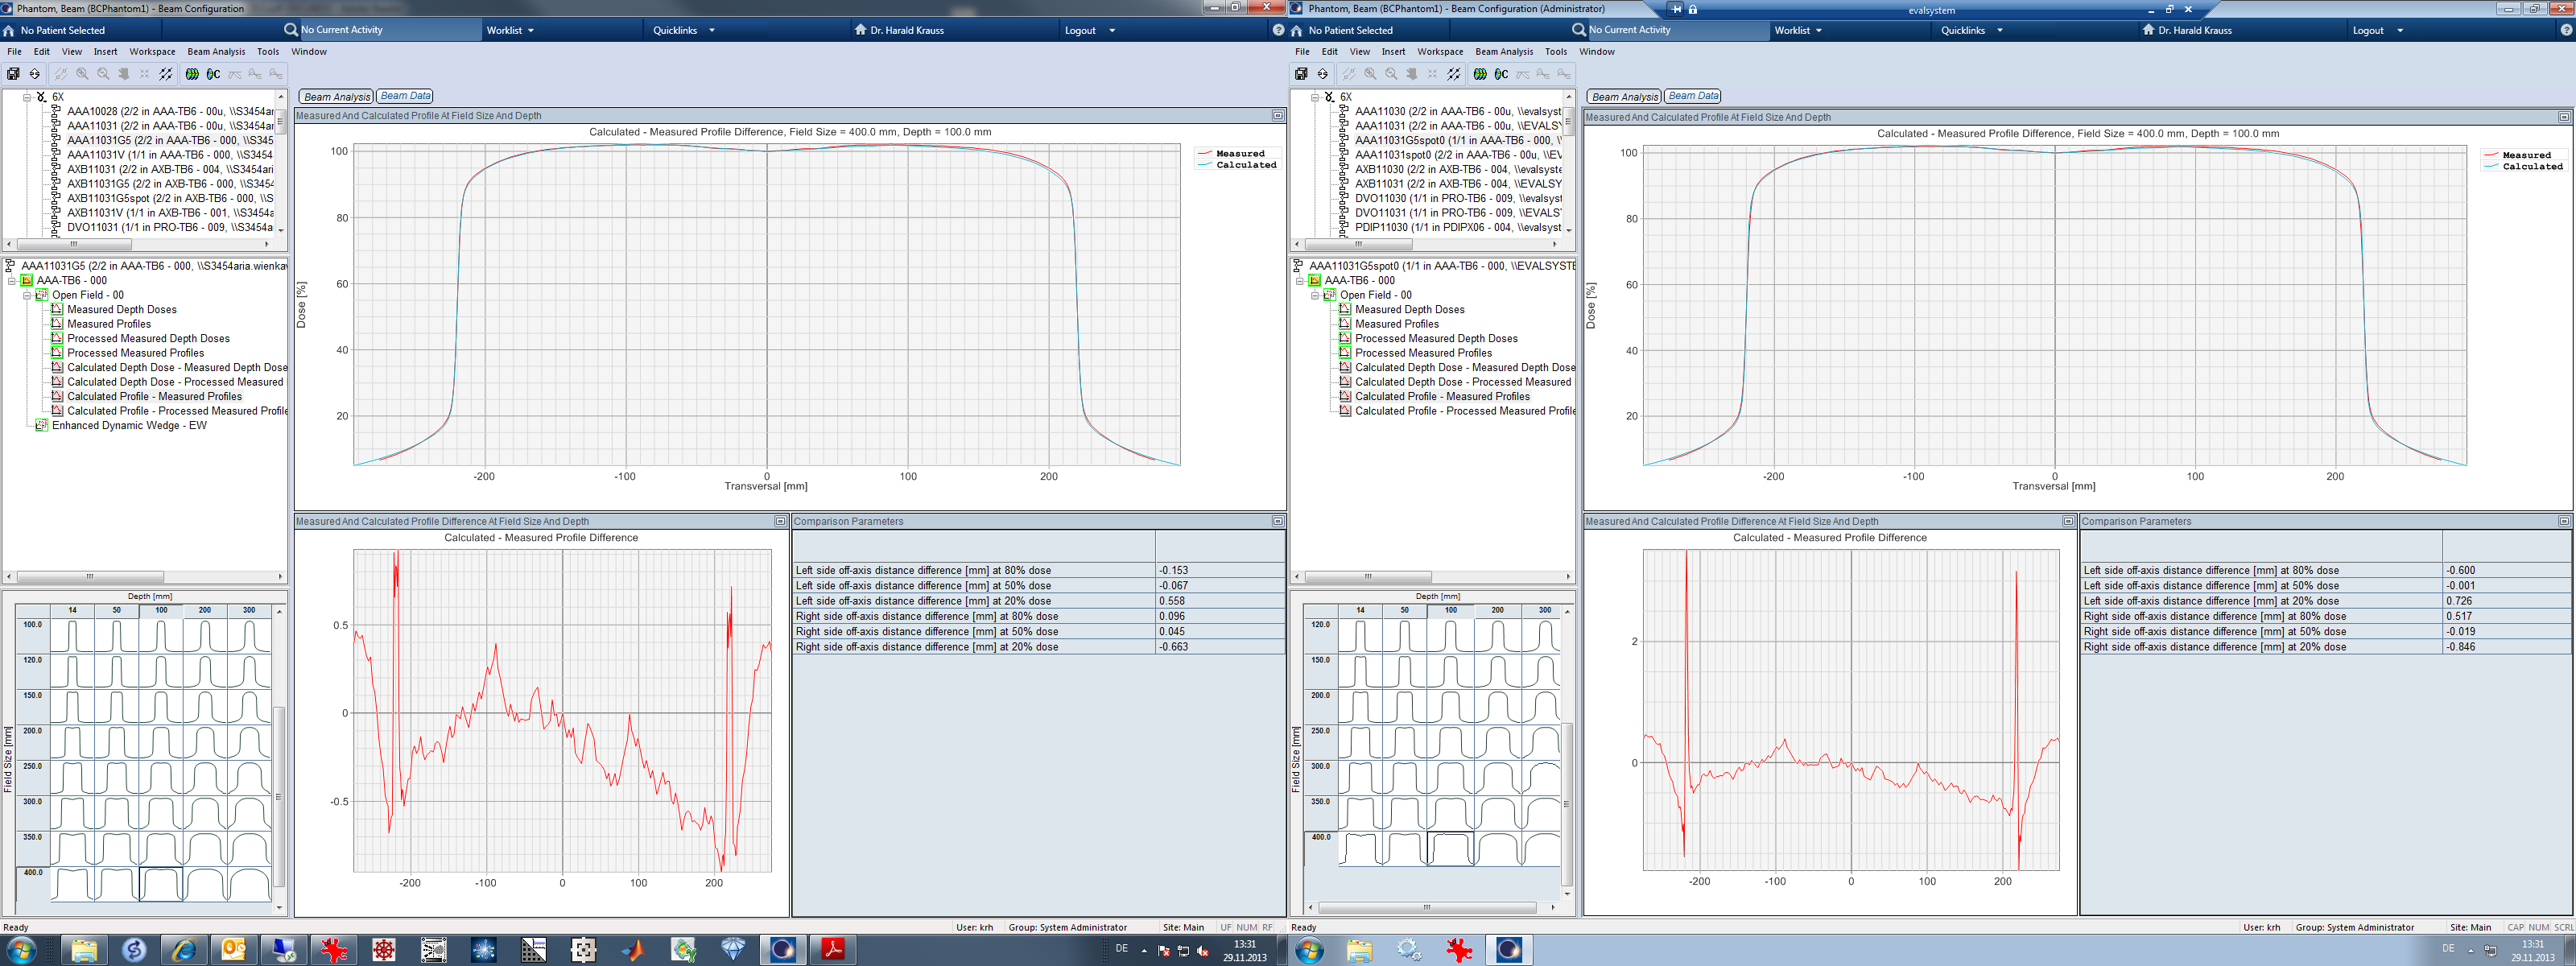
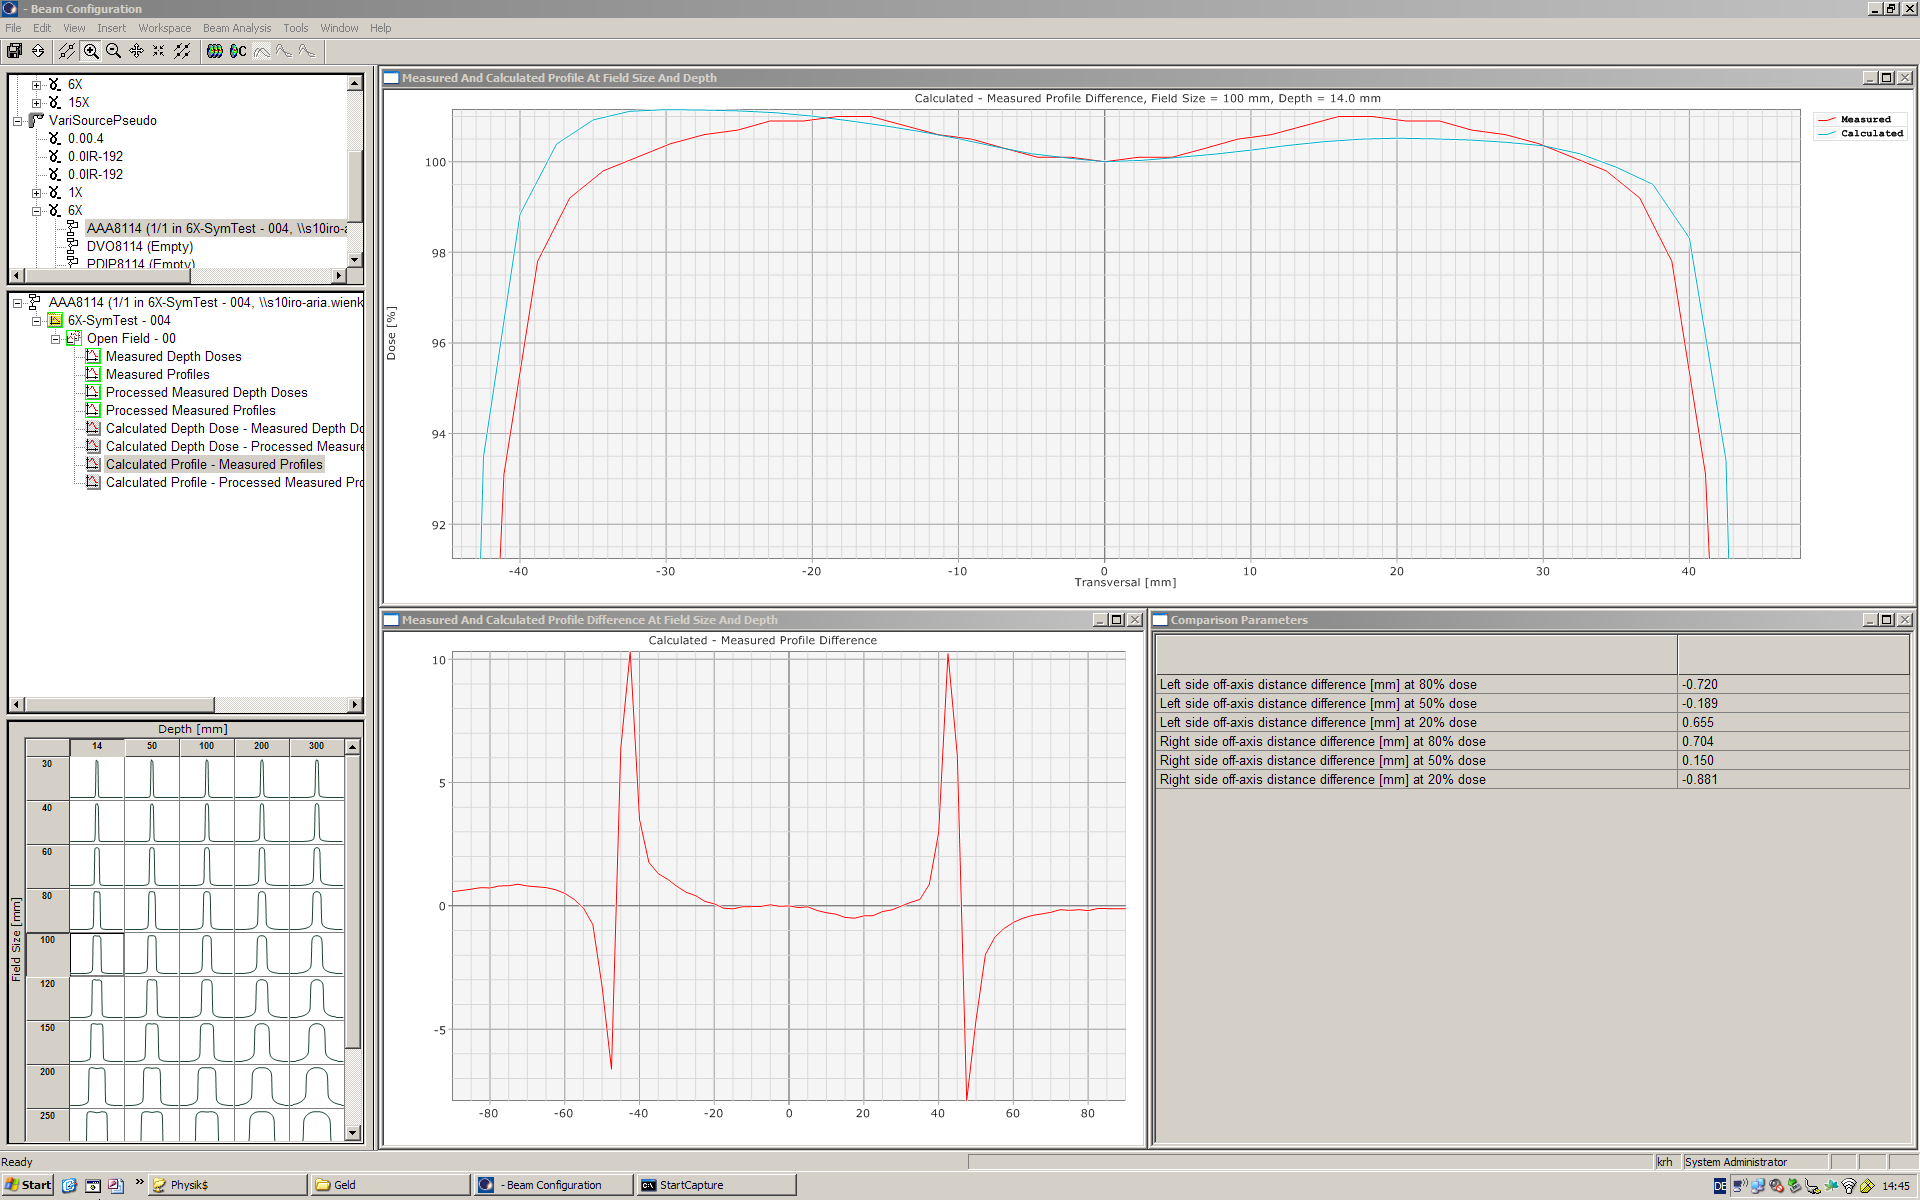
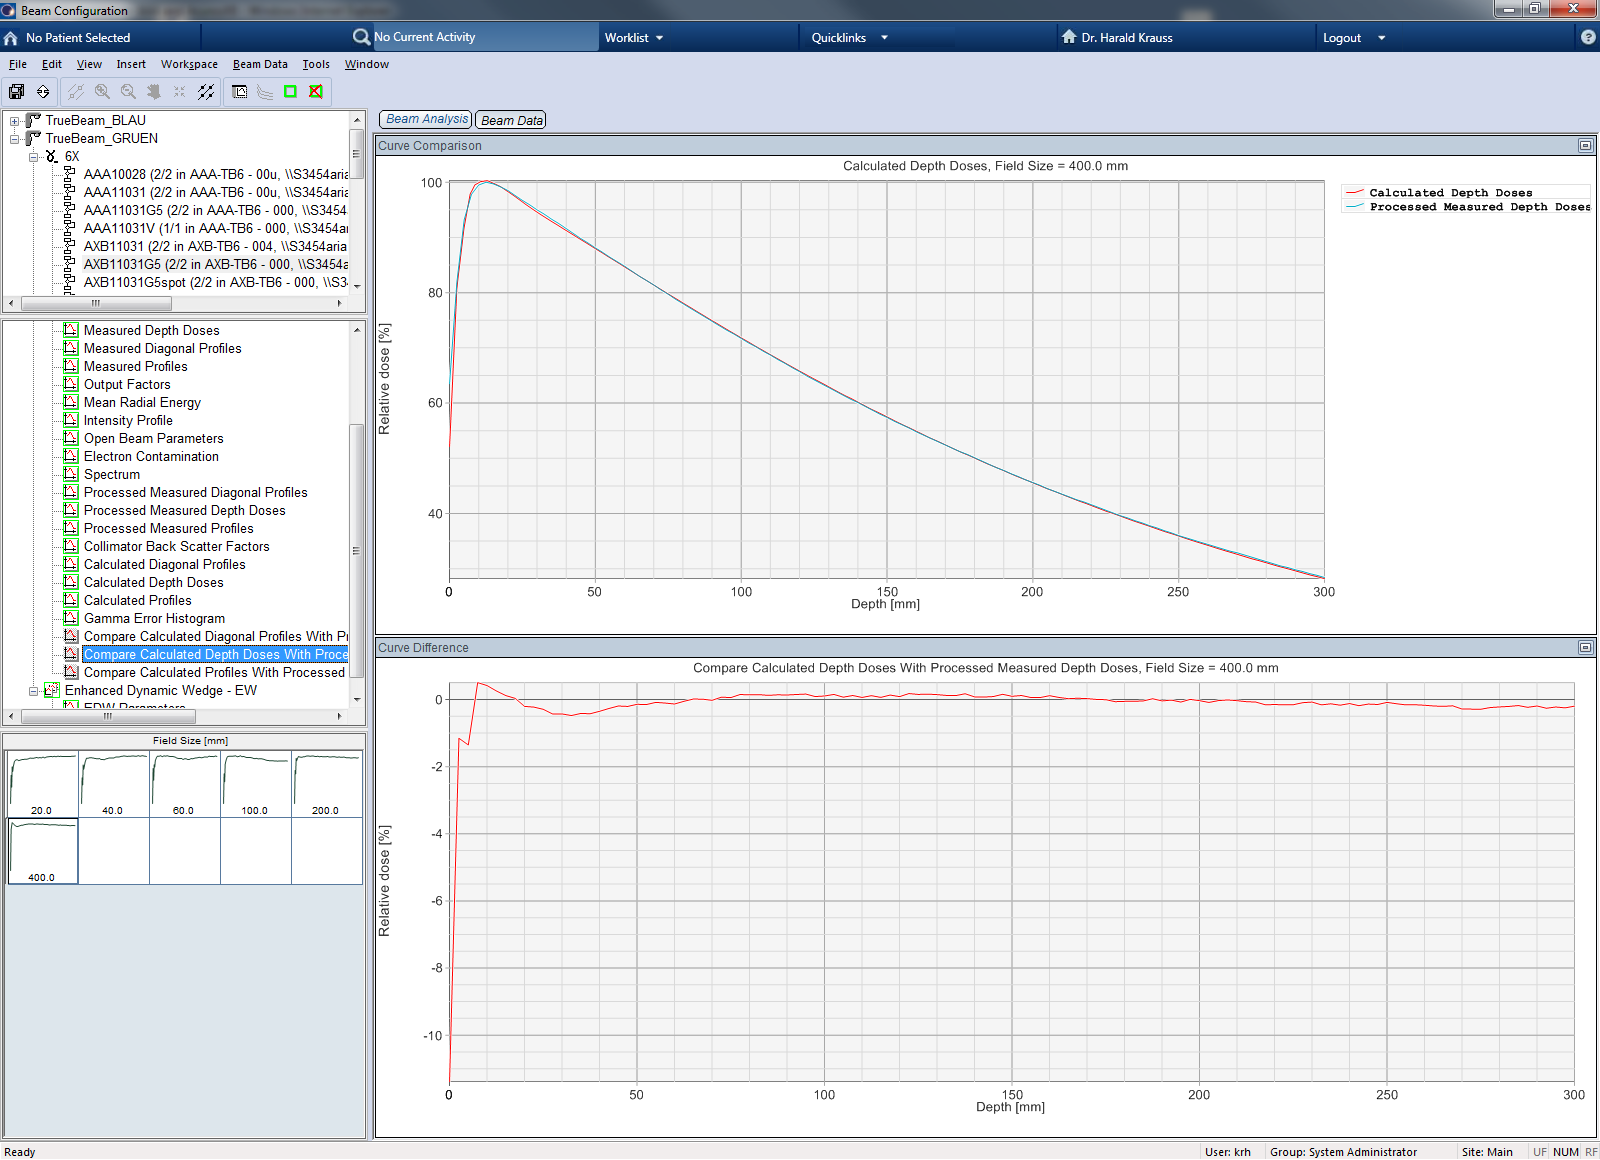
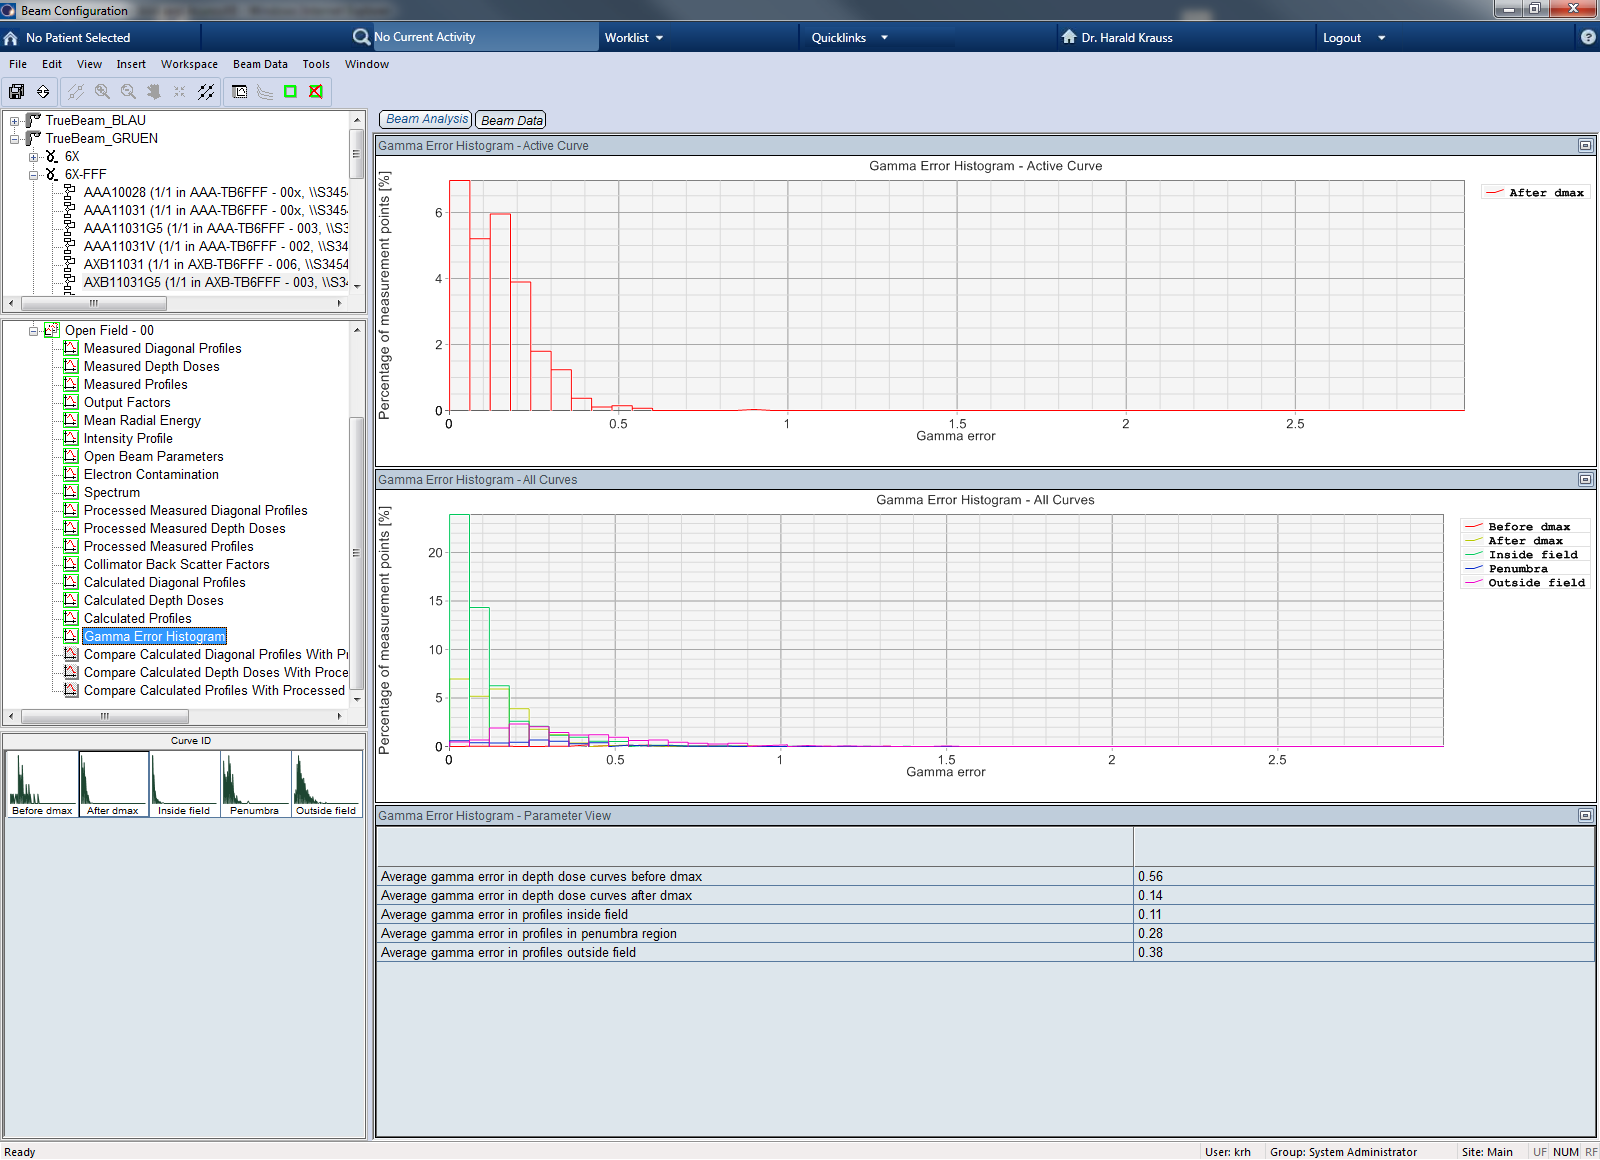
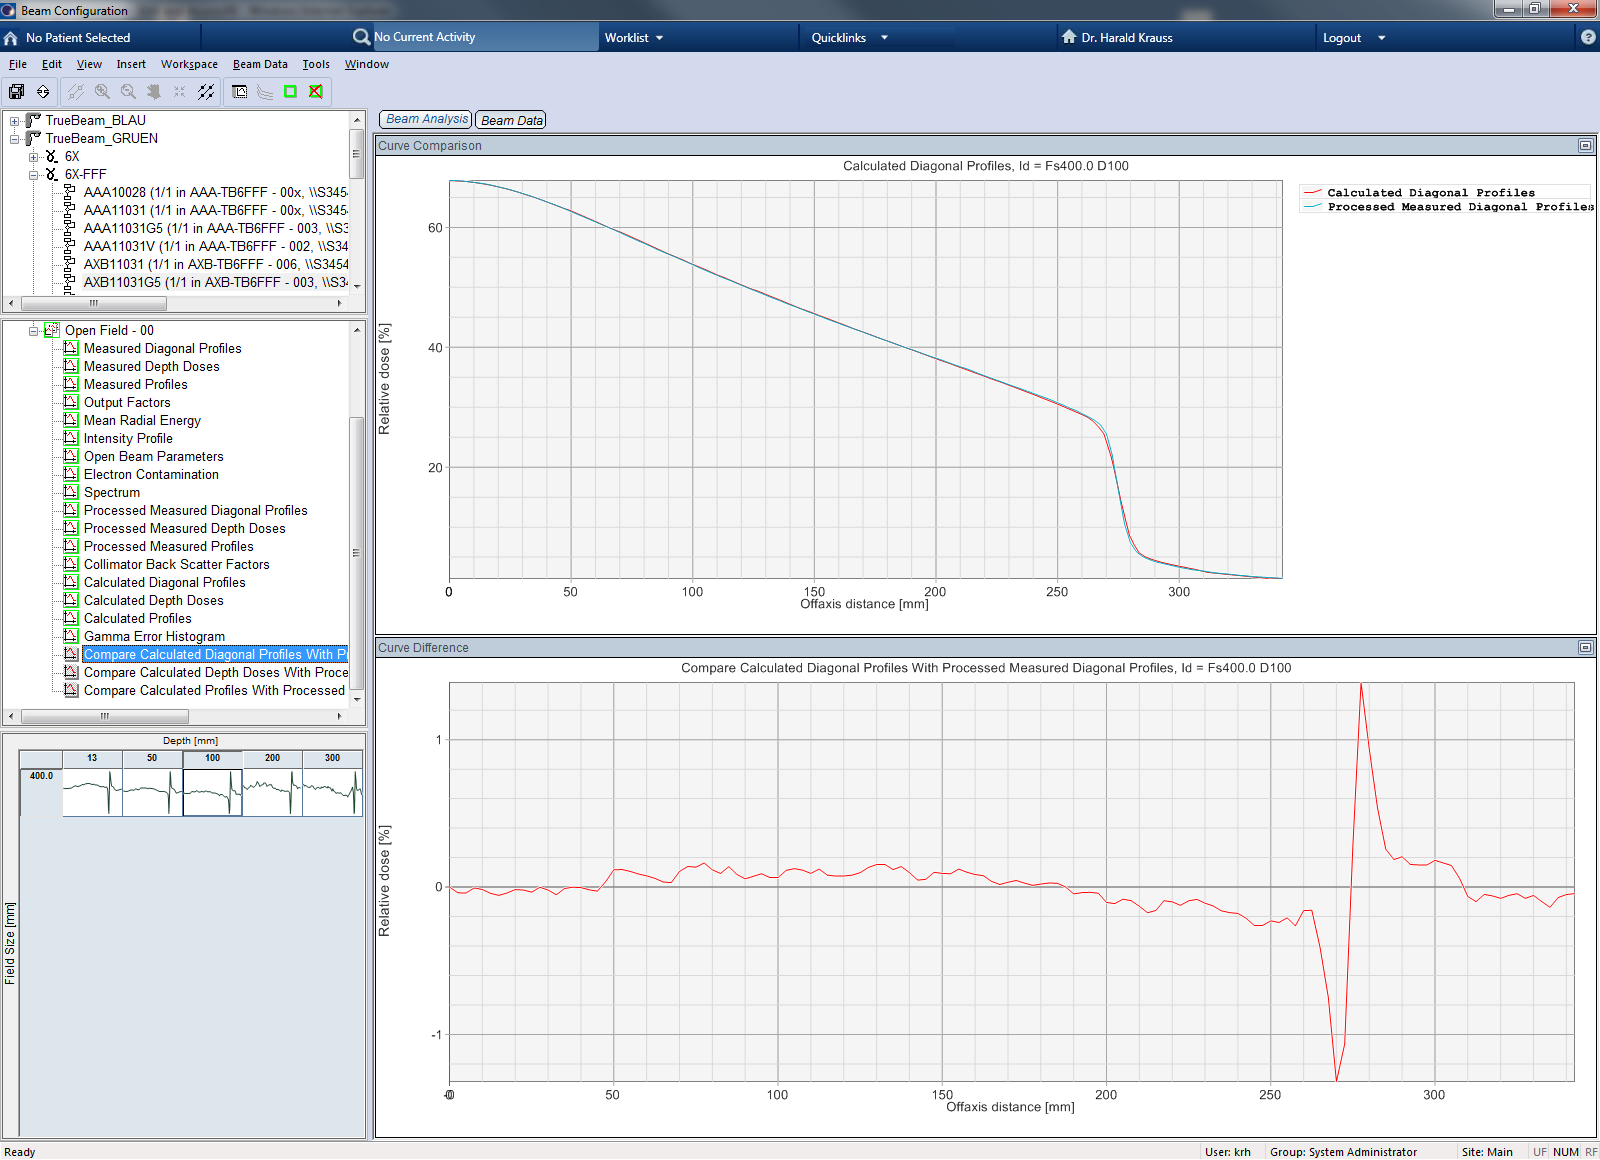
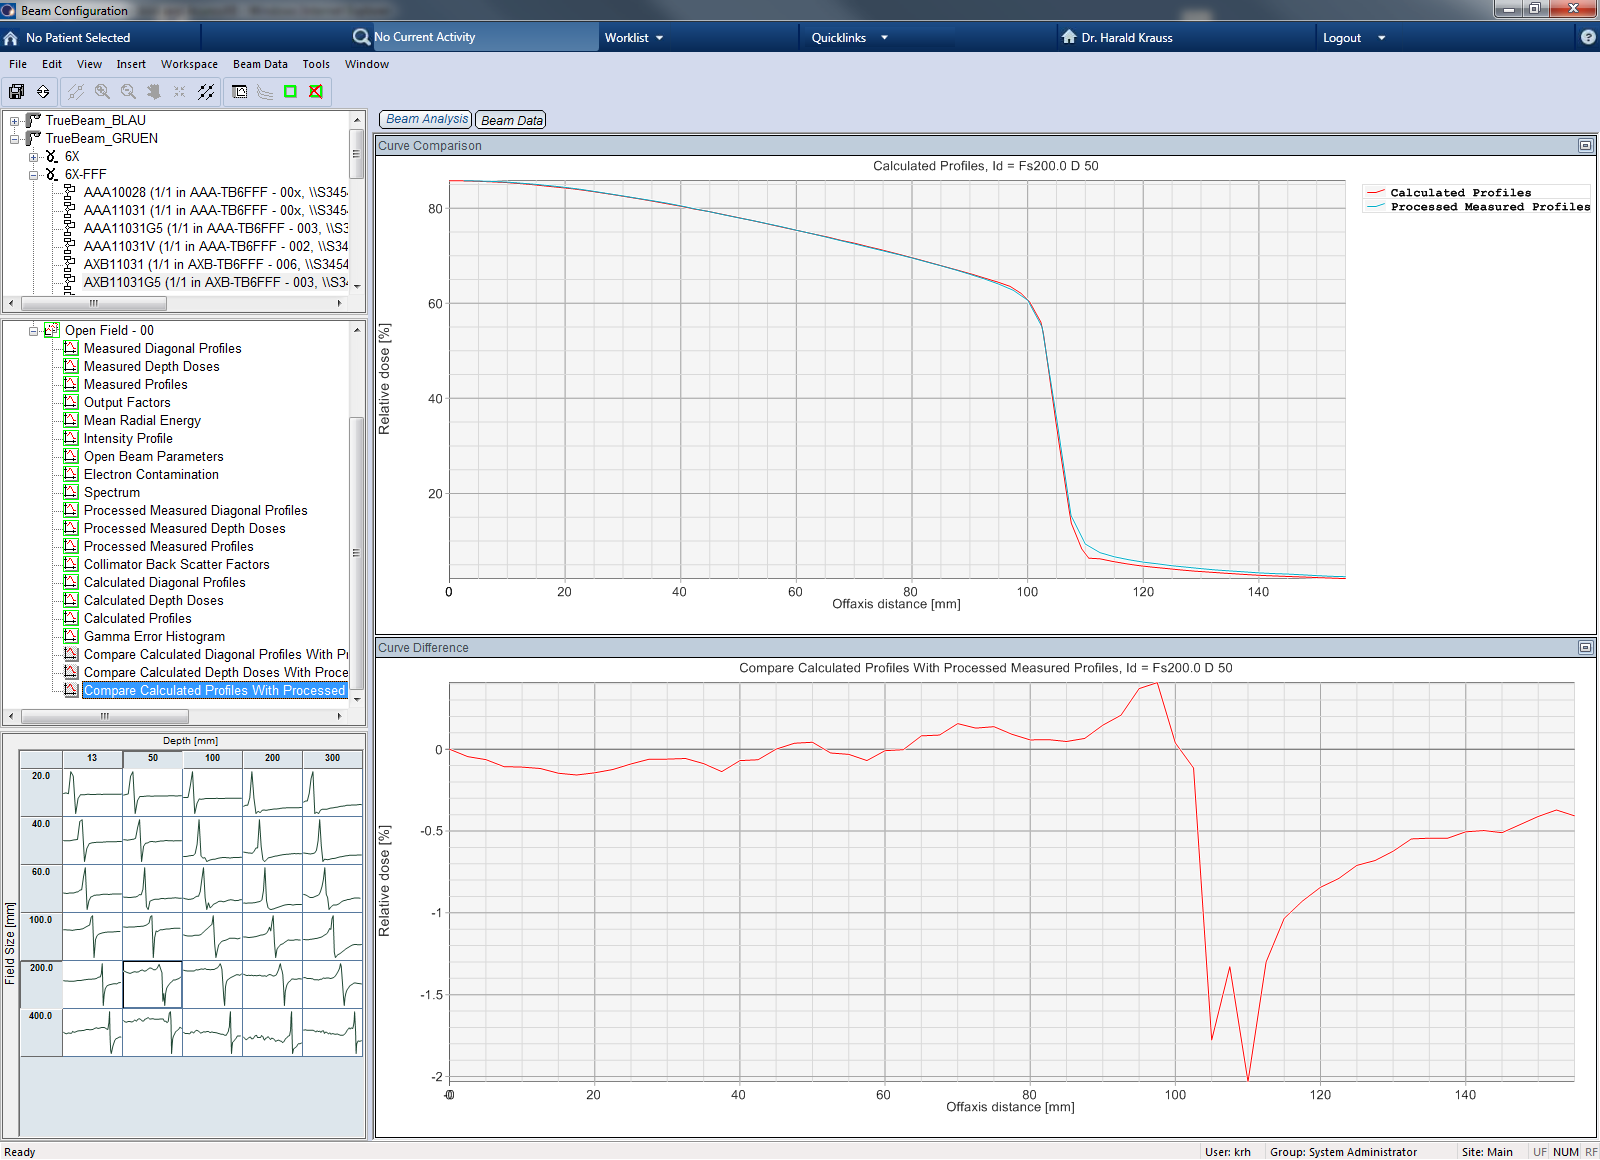
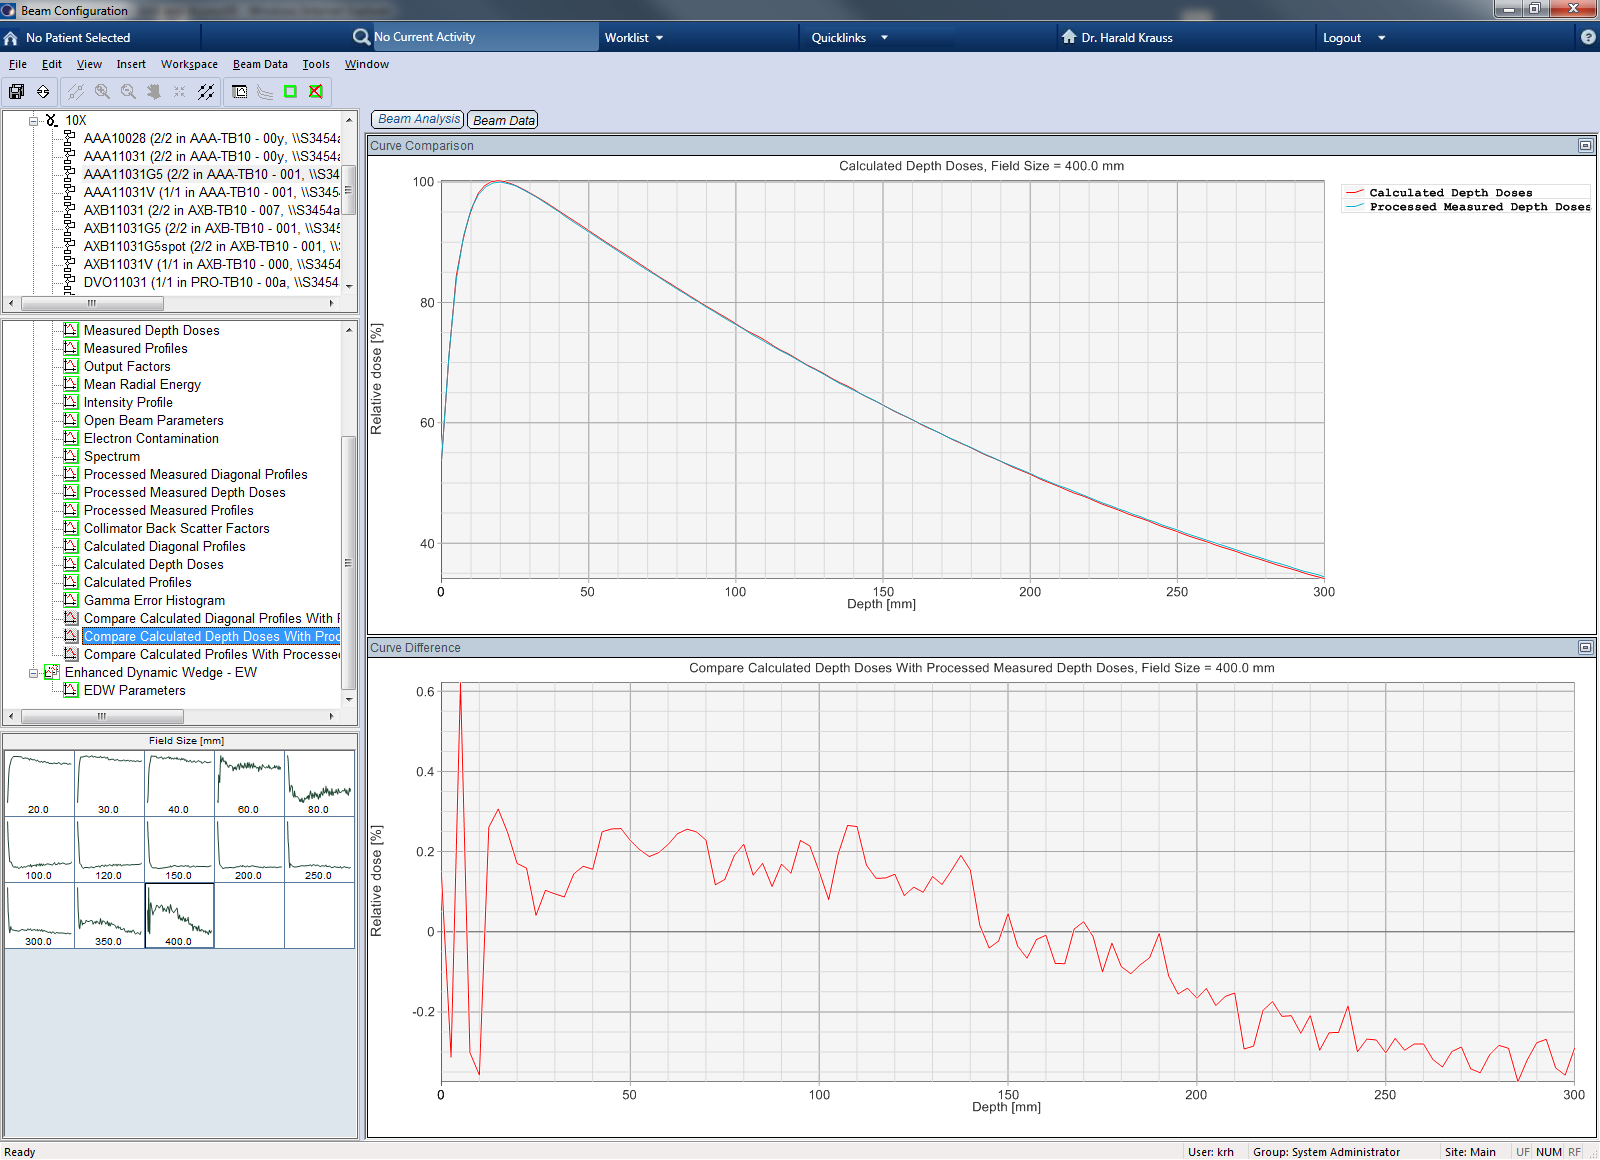
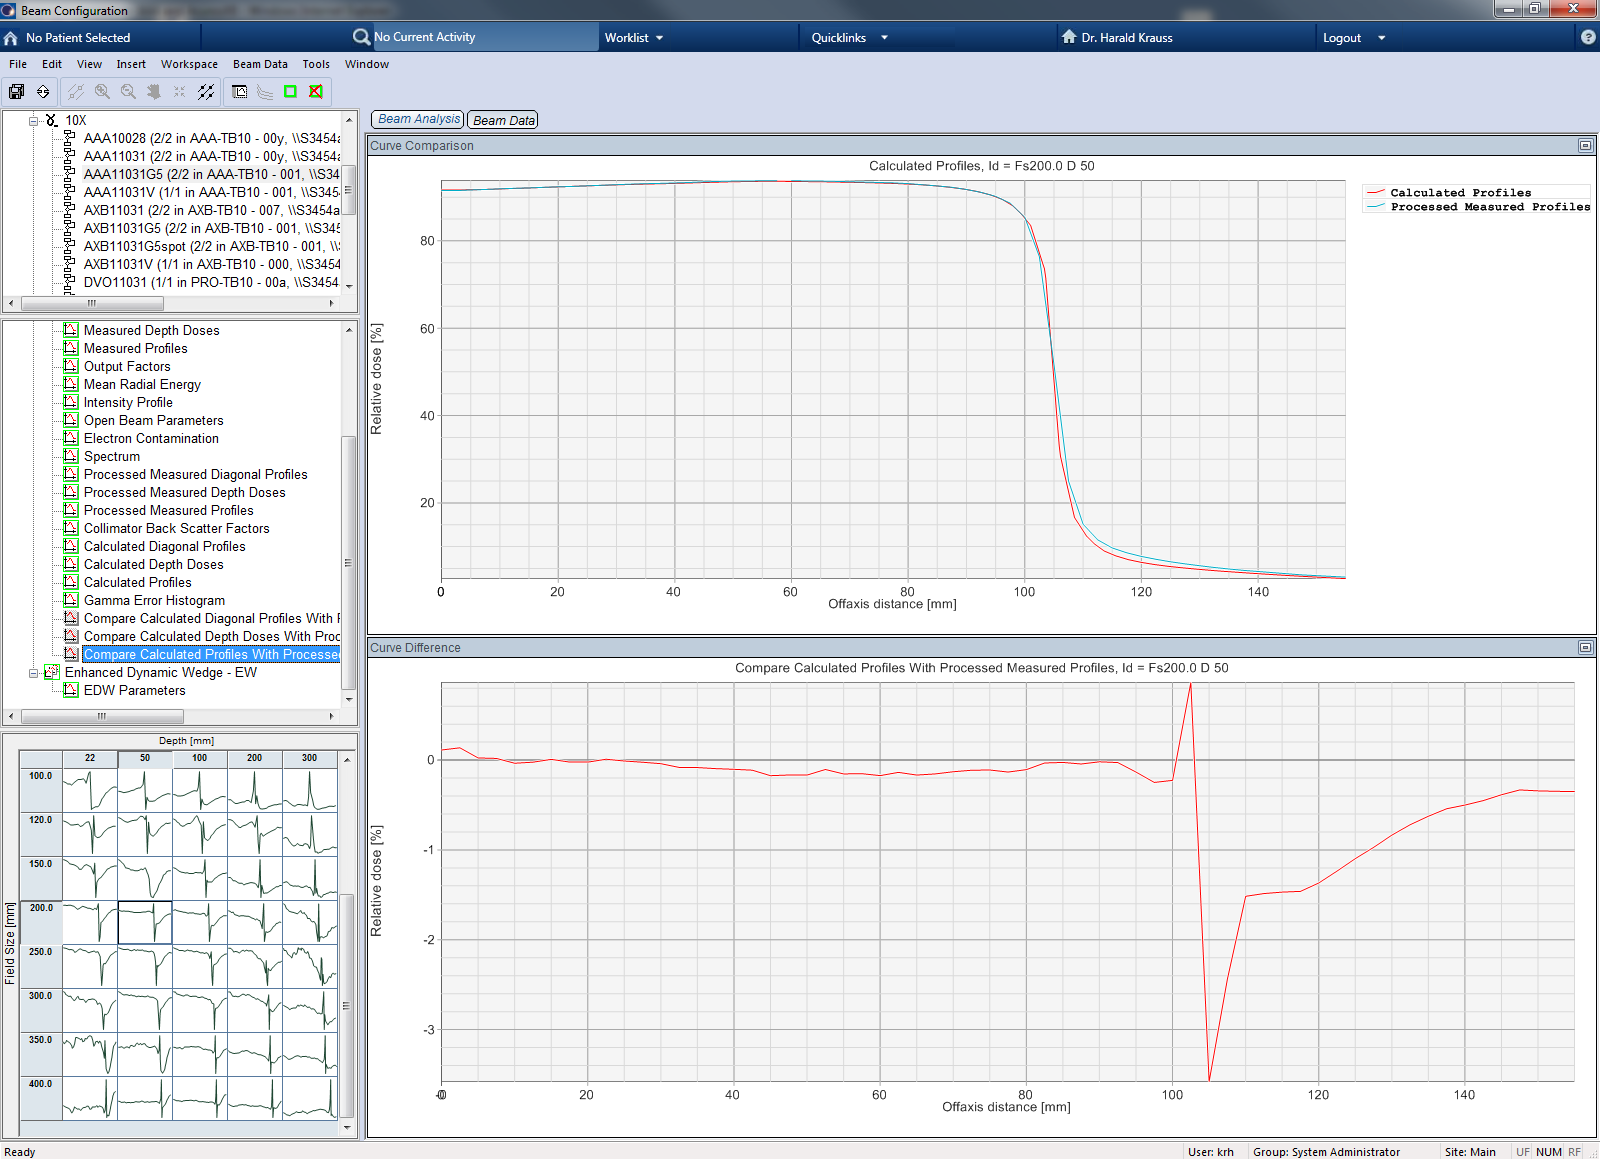
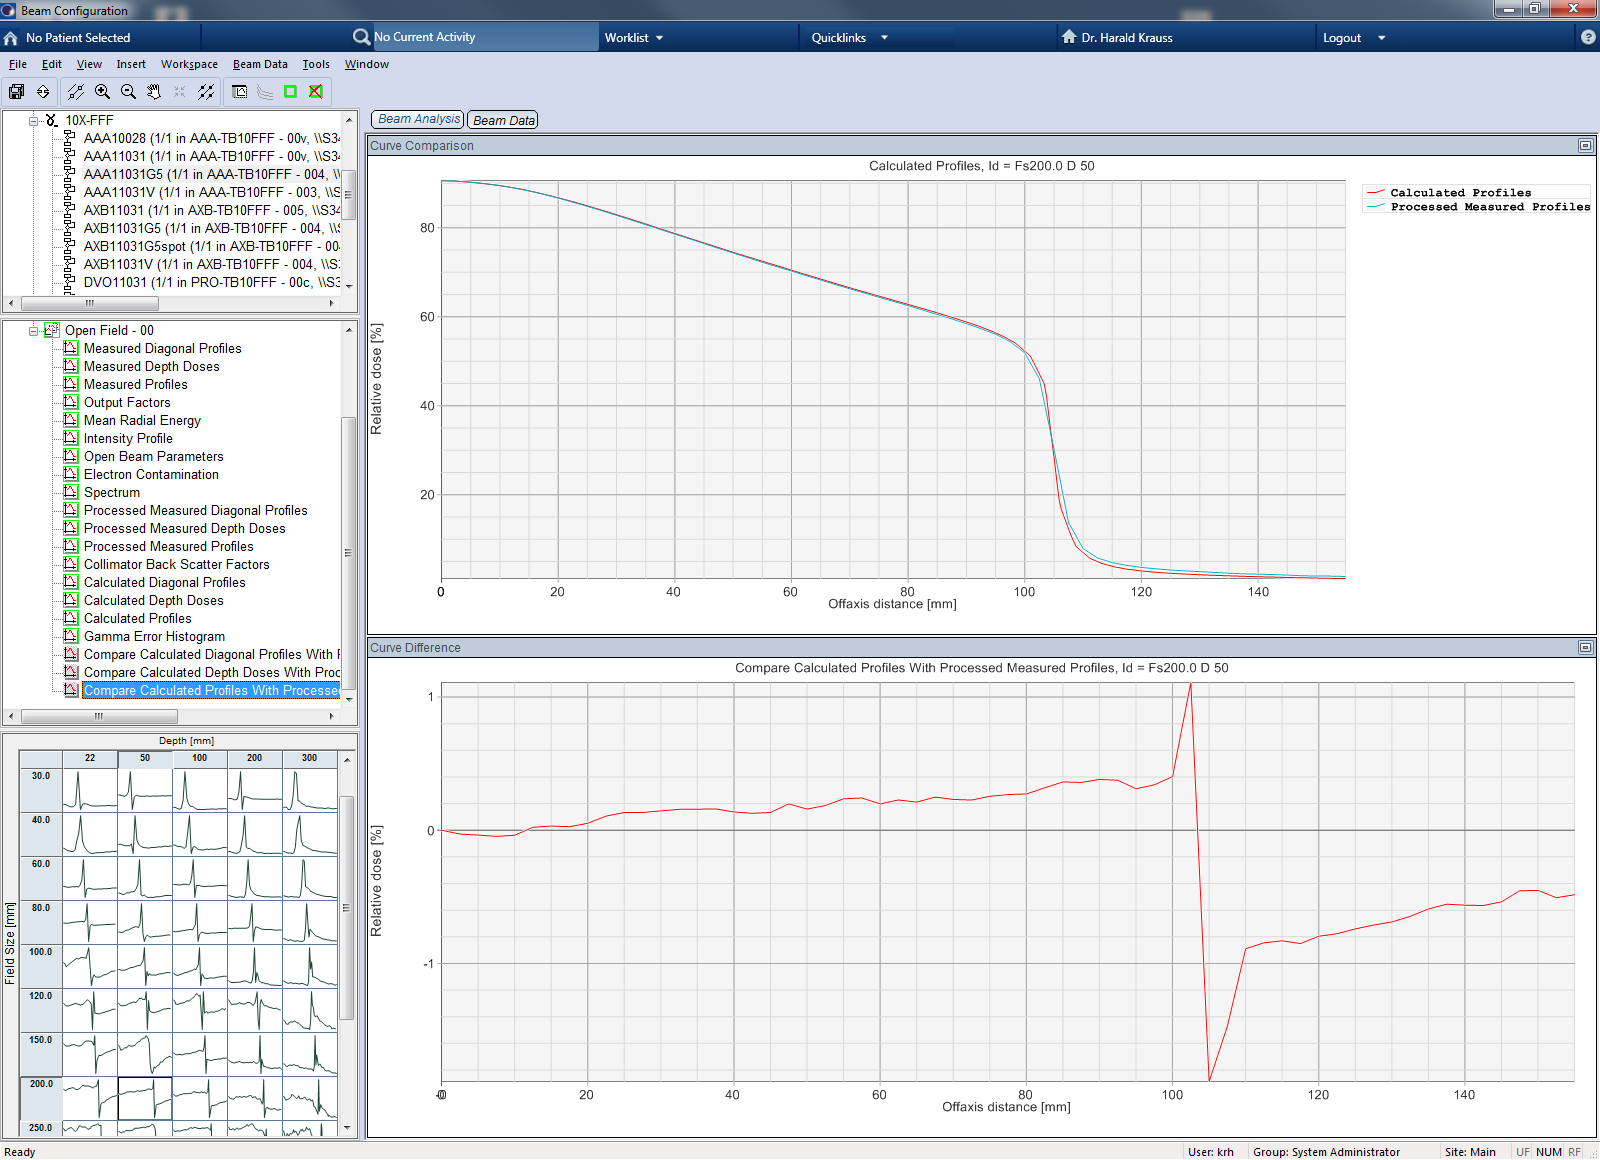
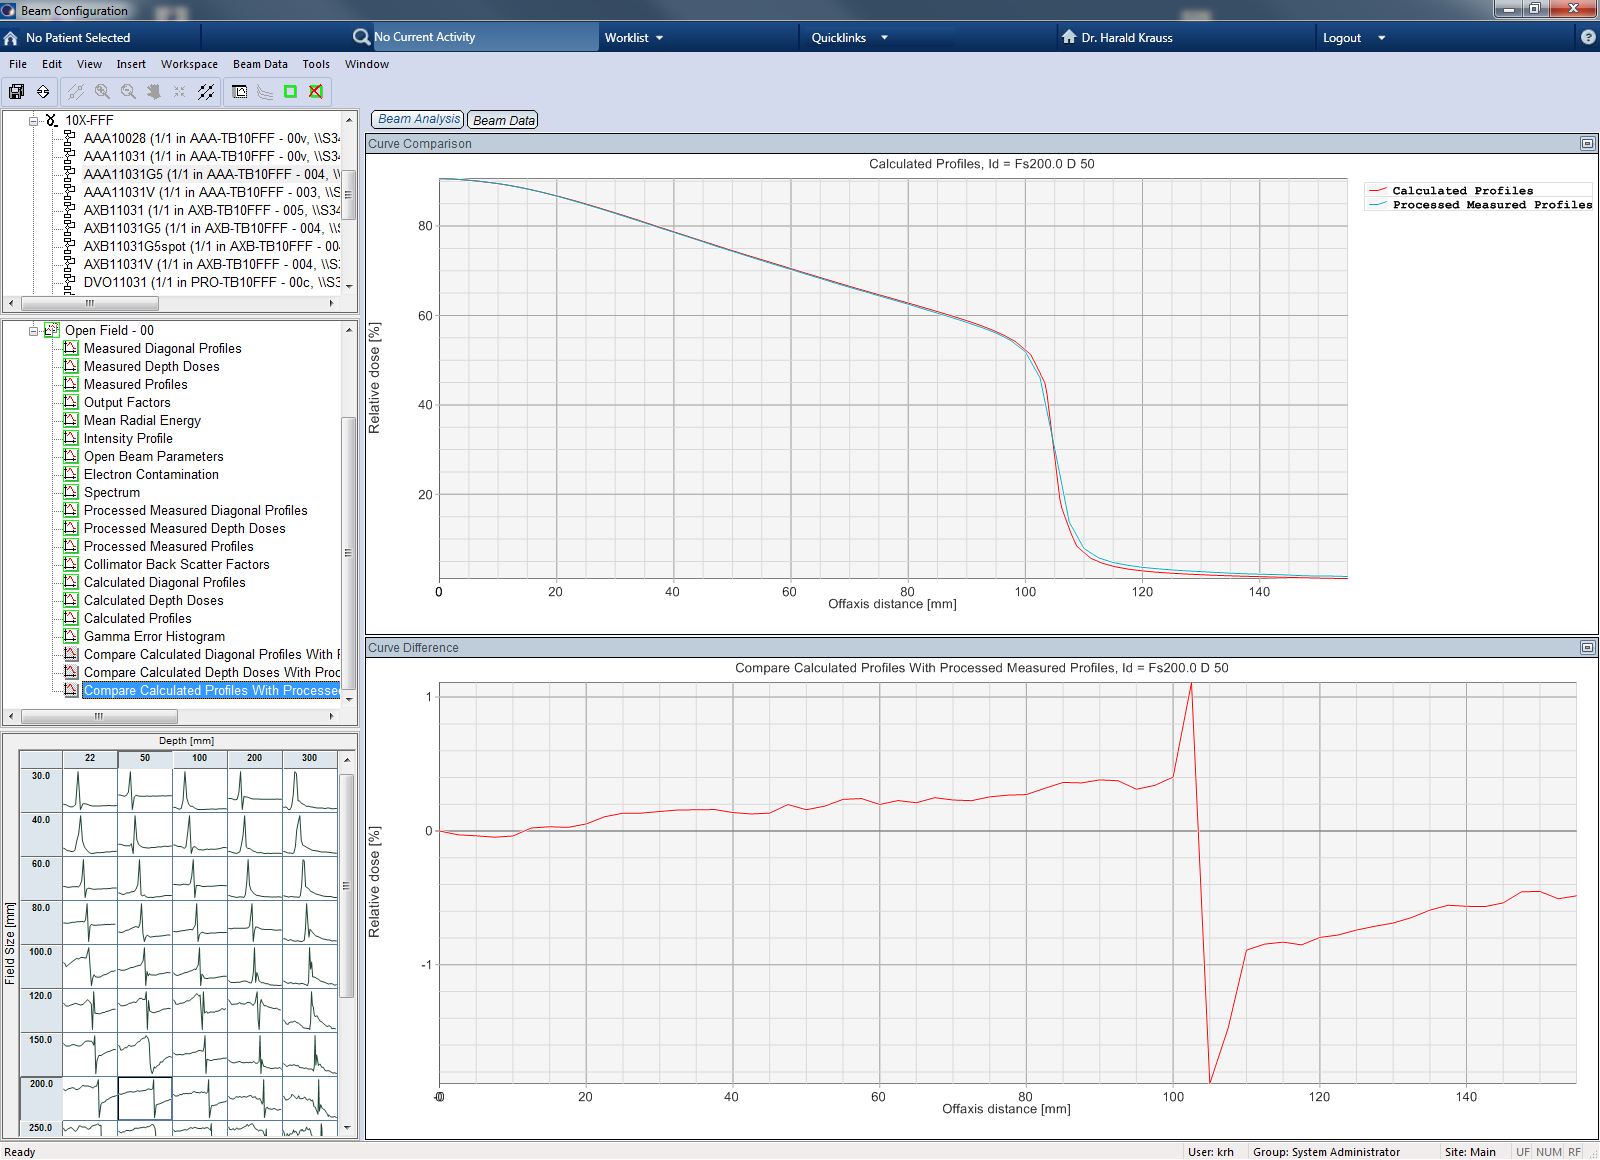
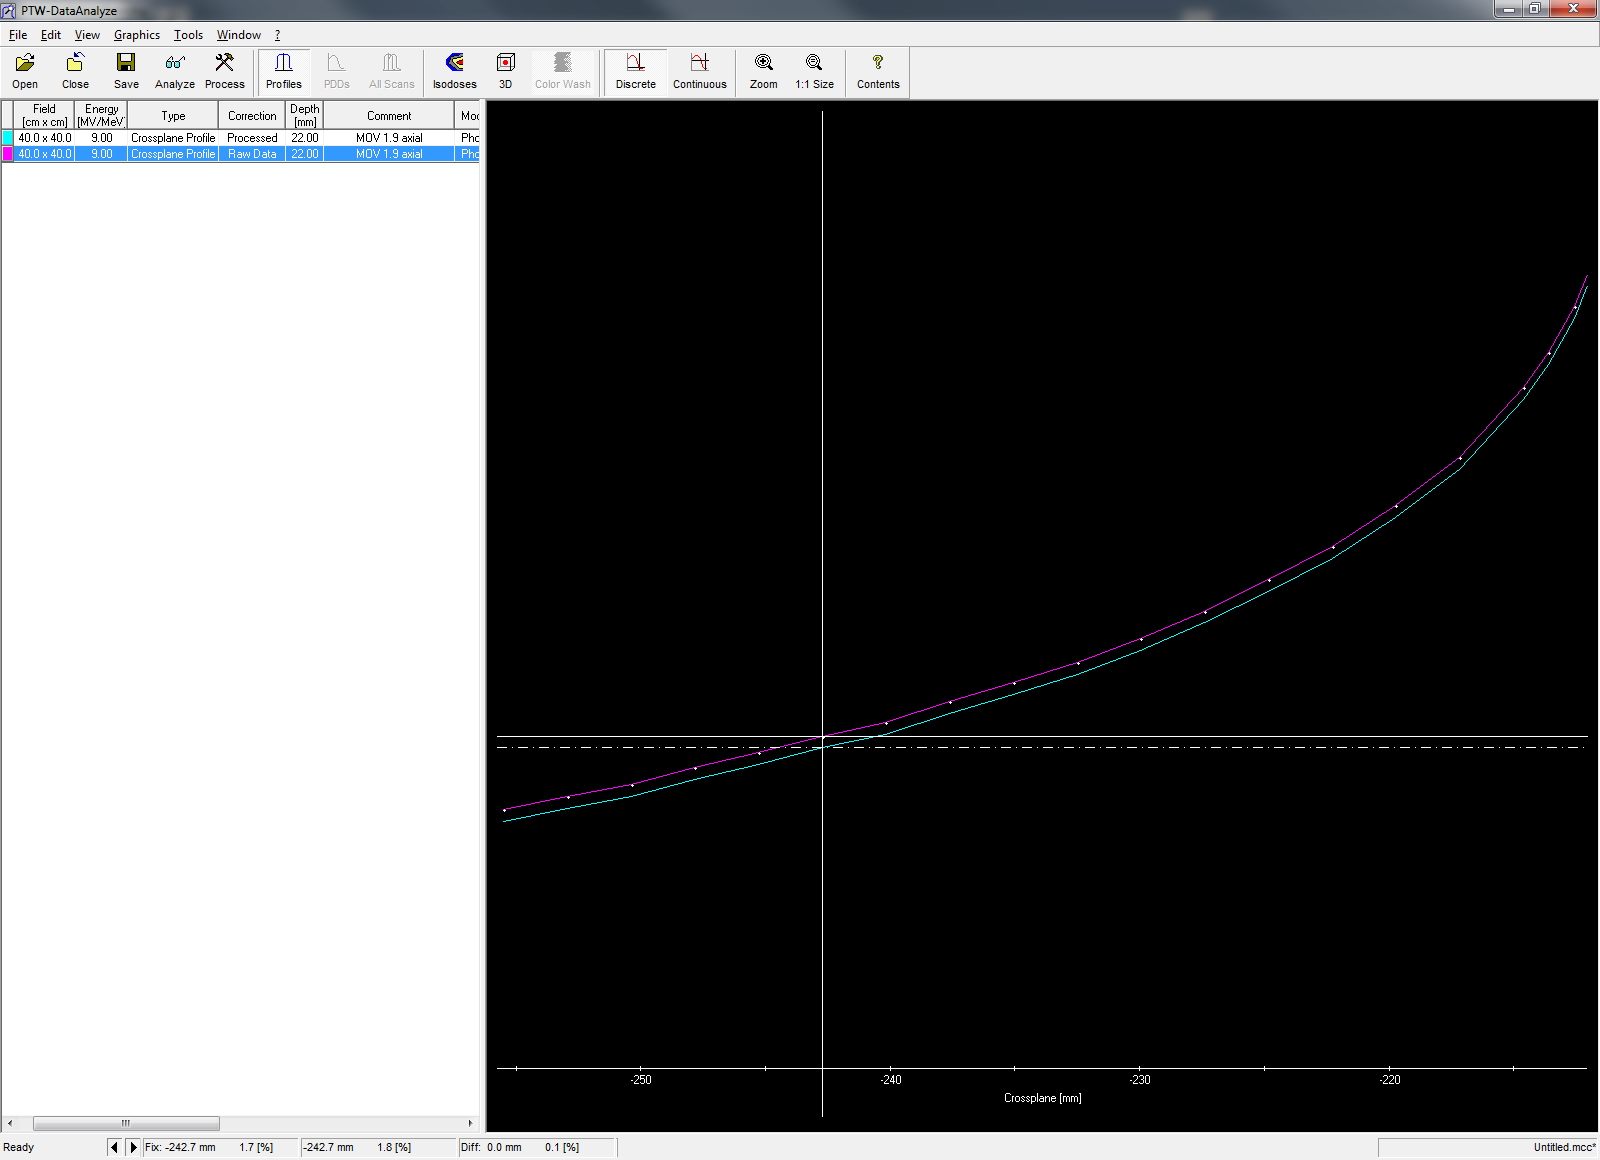
Some notes on saturation correction: For testing purposes, we also tried the saturation correction of transverse profiles, in analogy to the PDD curves. However, we found that it does not make sense to correct the profiles for saturation. While in a PDD at the lowest energy (6FFF), the dose per pulse ratio between dmax and 300 mm depth can be up to 6.7 (the % depth dose value of 6FFF, field size 1 x 1 cm, at 300 mm depth is 14.9%), the dose per pulse at the shoulder point of a FFF crossplane profile is at least 40% (10FFF, 40 x 40 cm, 22 mm depth). Since the transverse profiles are always normalized to CAX during TPS formatting, a saturation correction of the PP15 profiles would have no effect between CAX and the shoulder point. The effect would be smaller than 0.1%, and since TPS formatting is done with only one digit of precision, there is actually no effect at all on the ASC file. In the tails region however, a saturation correction would reduce the curve value by up to 0.1% (processed curve in cyan). But because Eclipse beam modelling always underestimates the dose in the tails so that the calculated tail dose is always lower than the measured dose, we did not want to promote this behavior, and left the profiles without saturation correction.
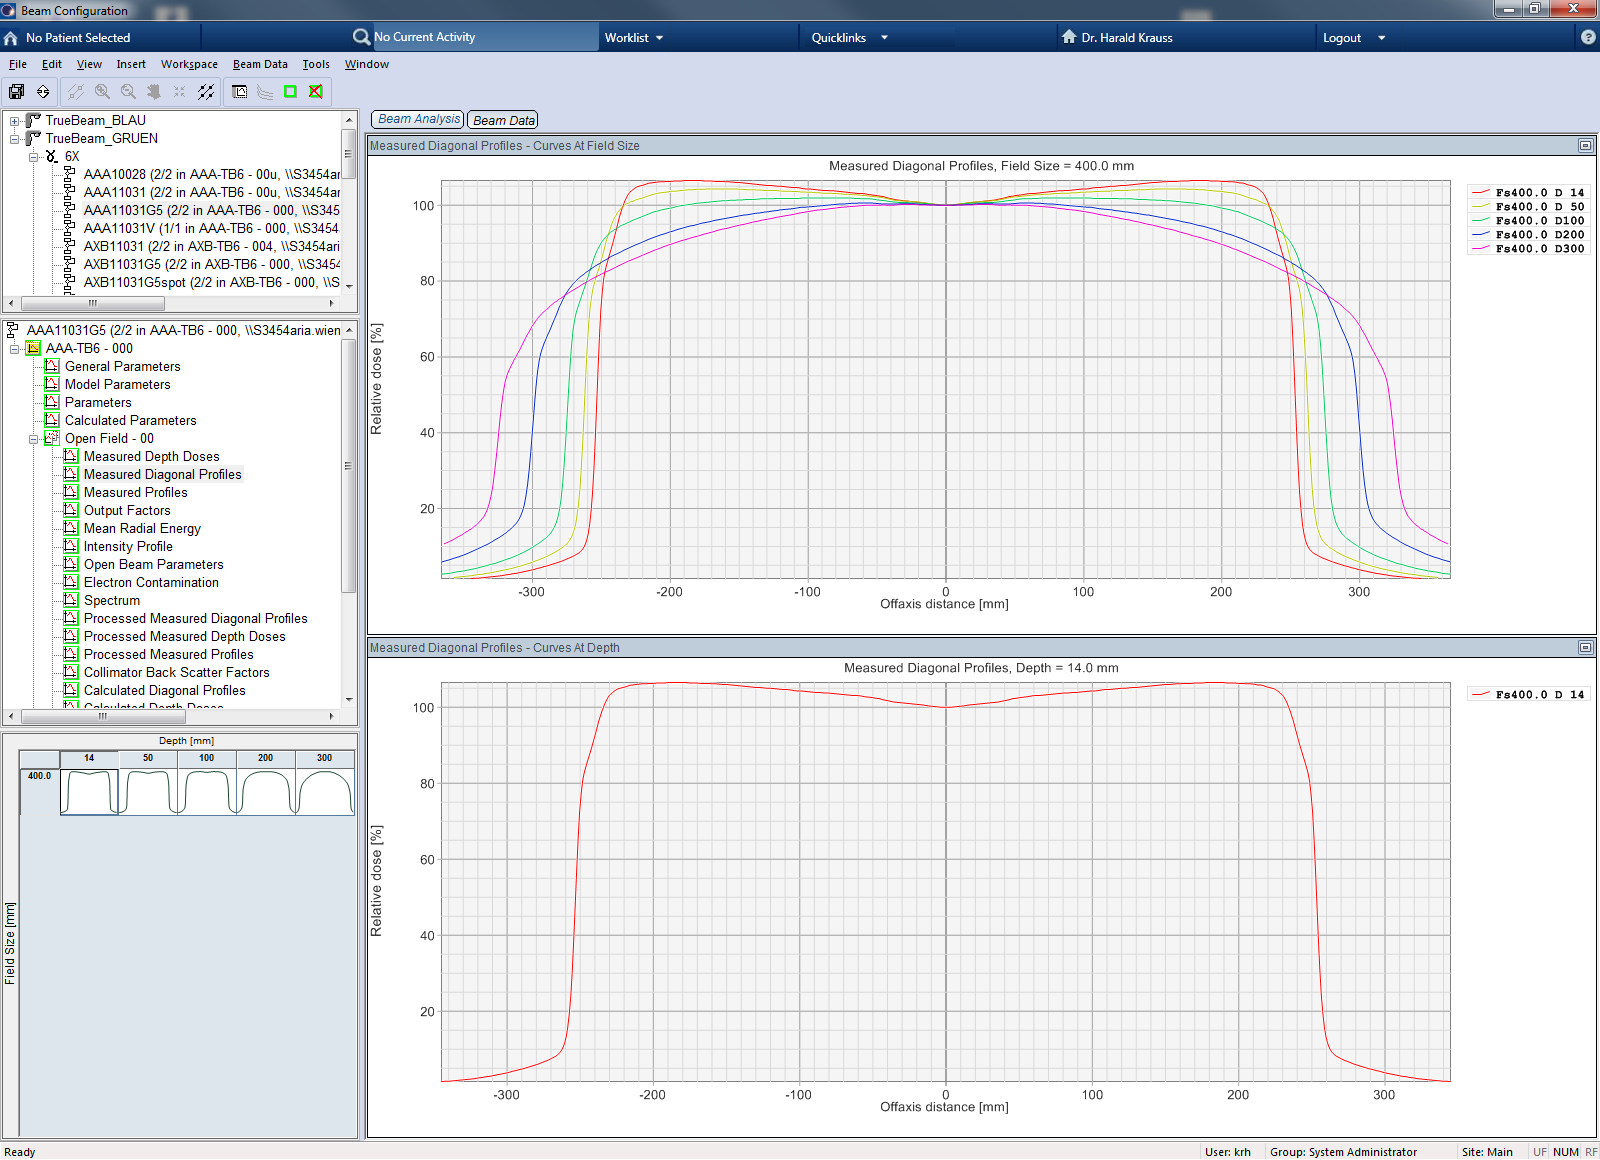
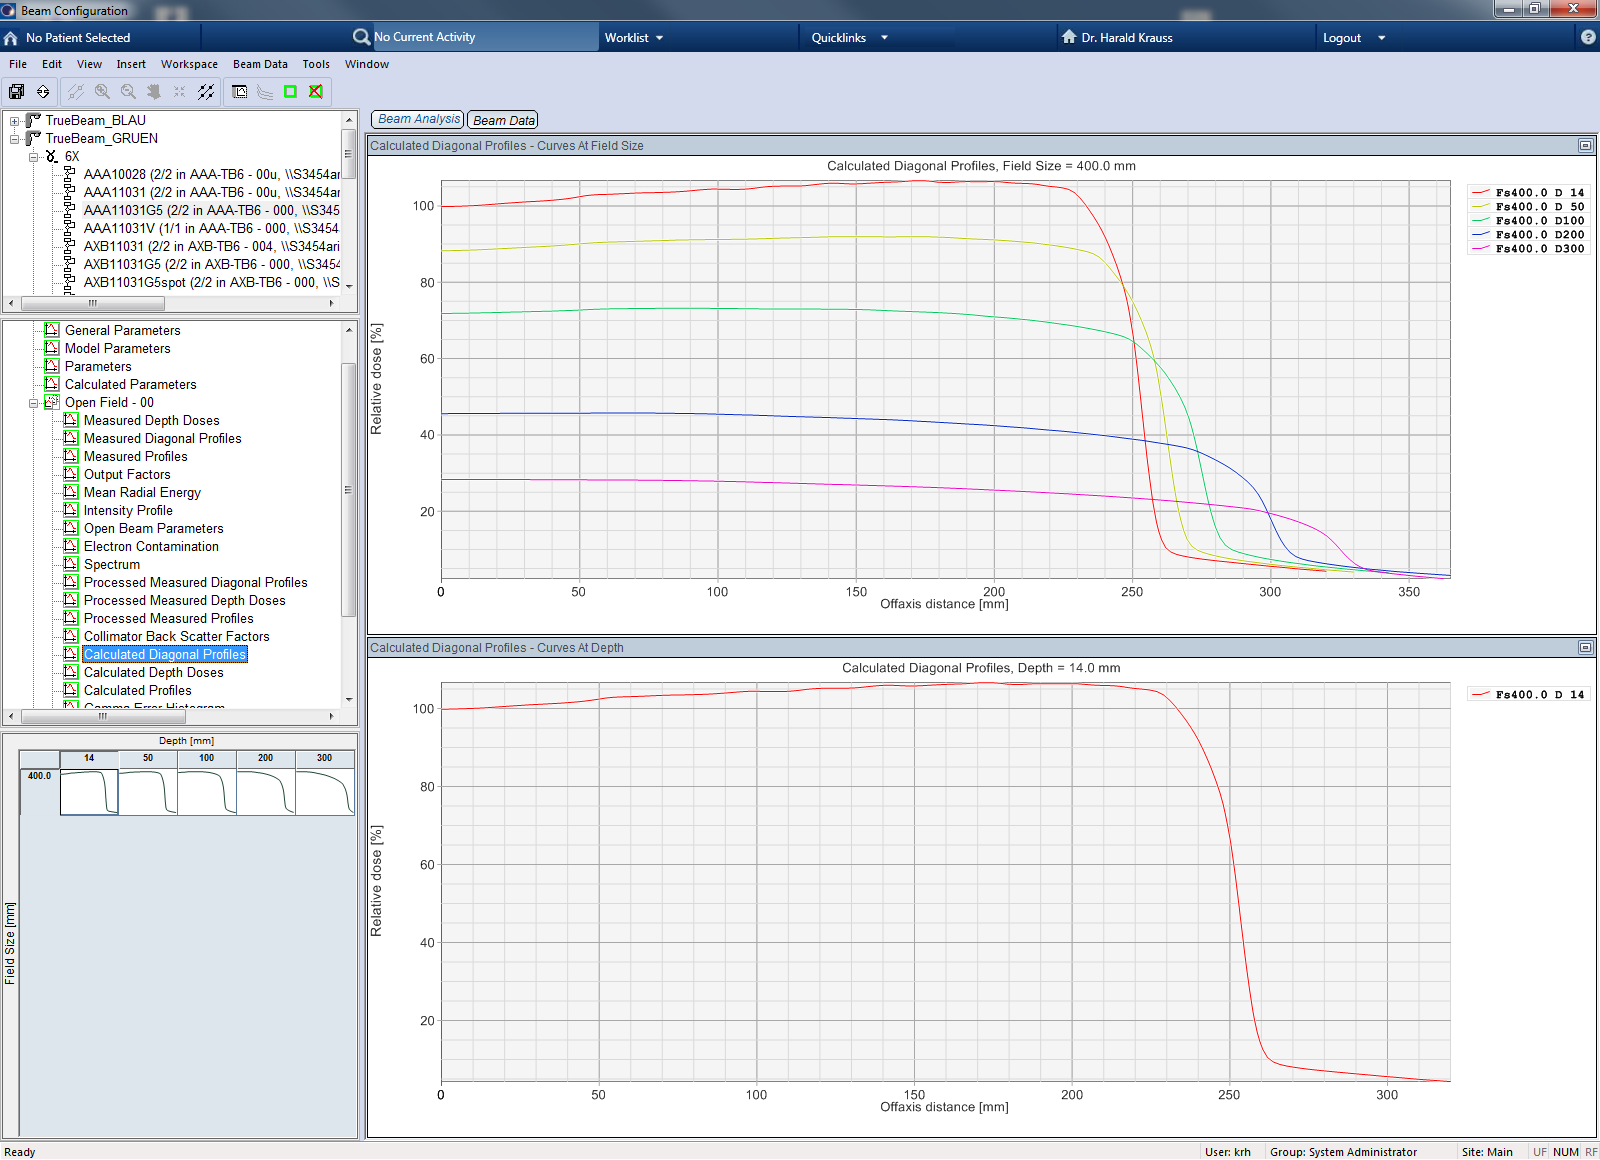
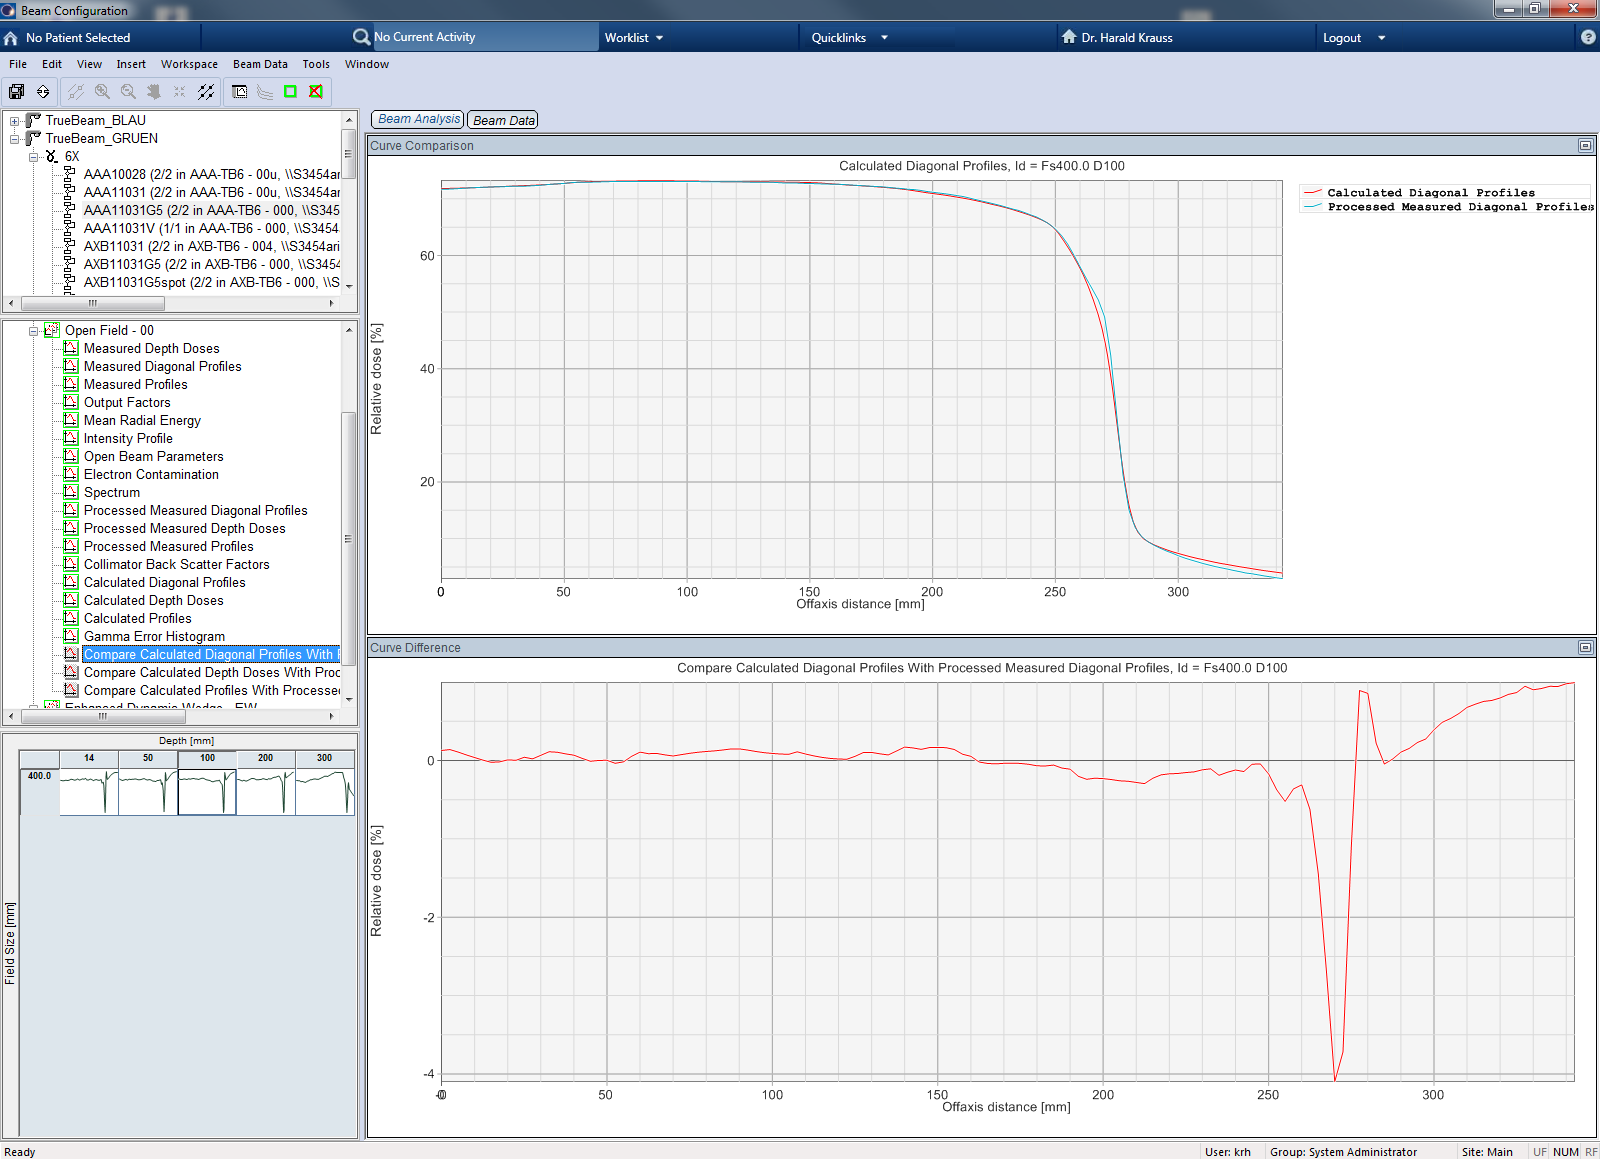
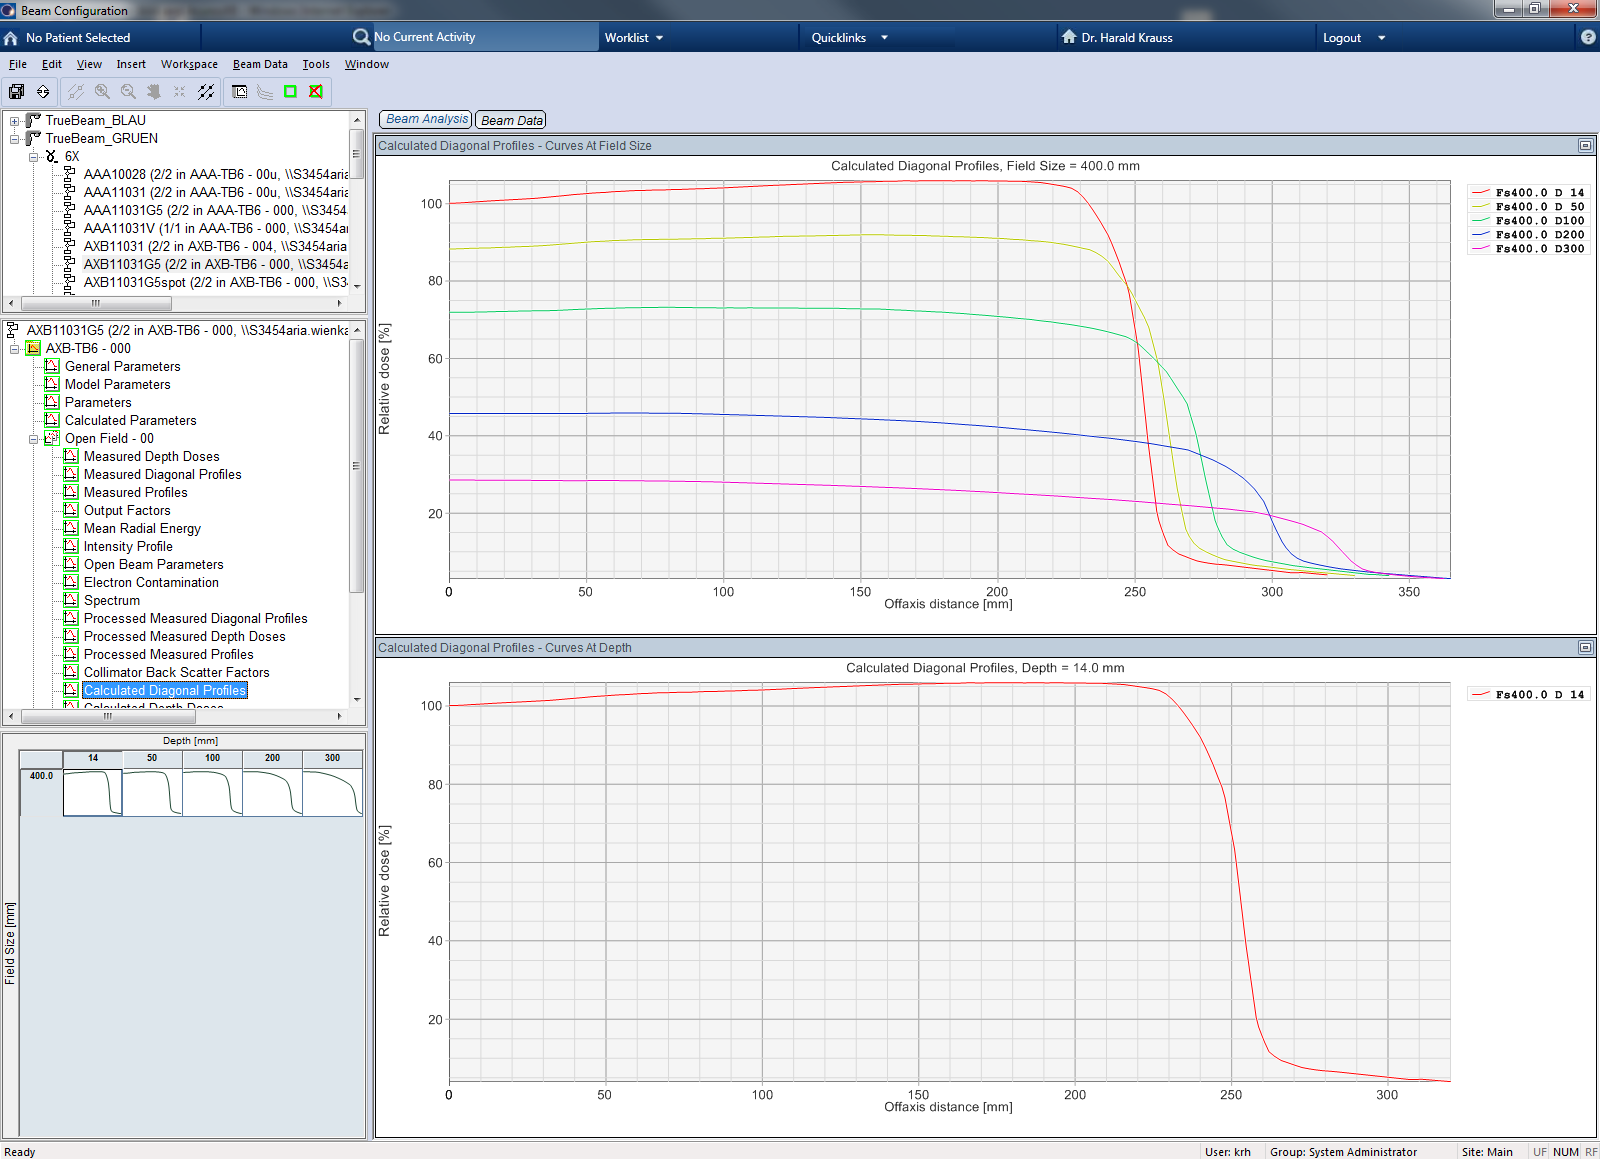
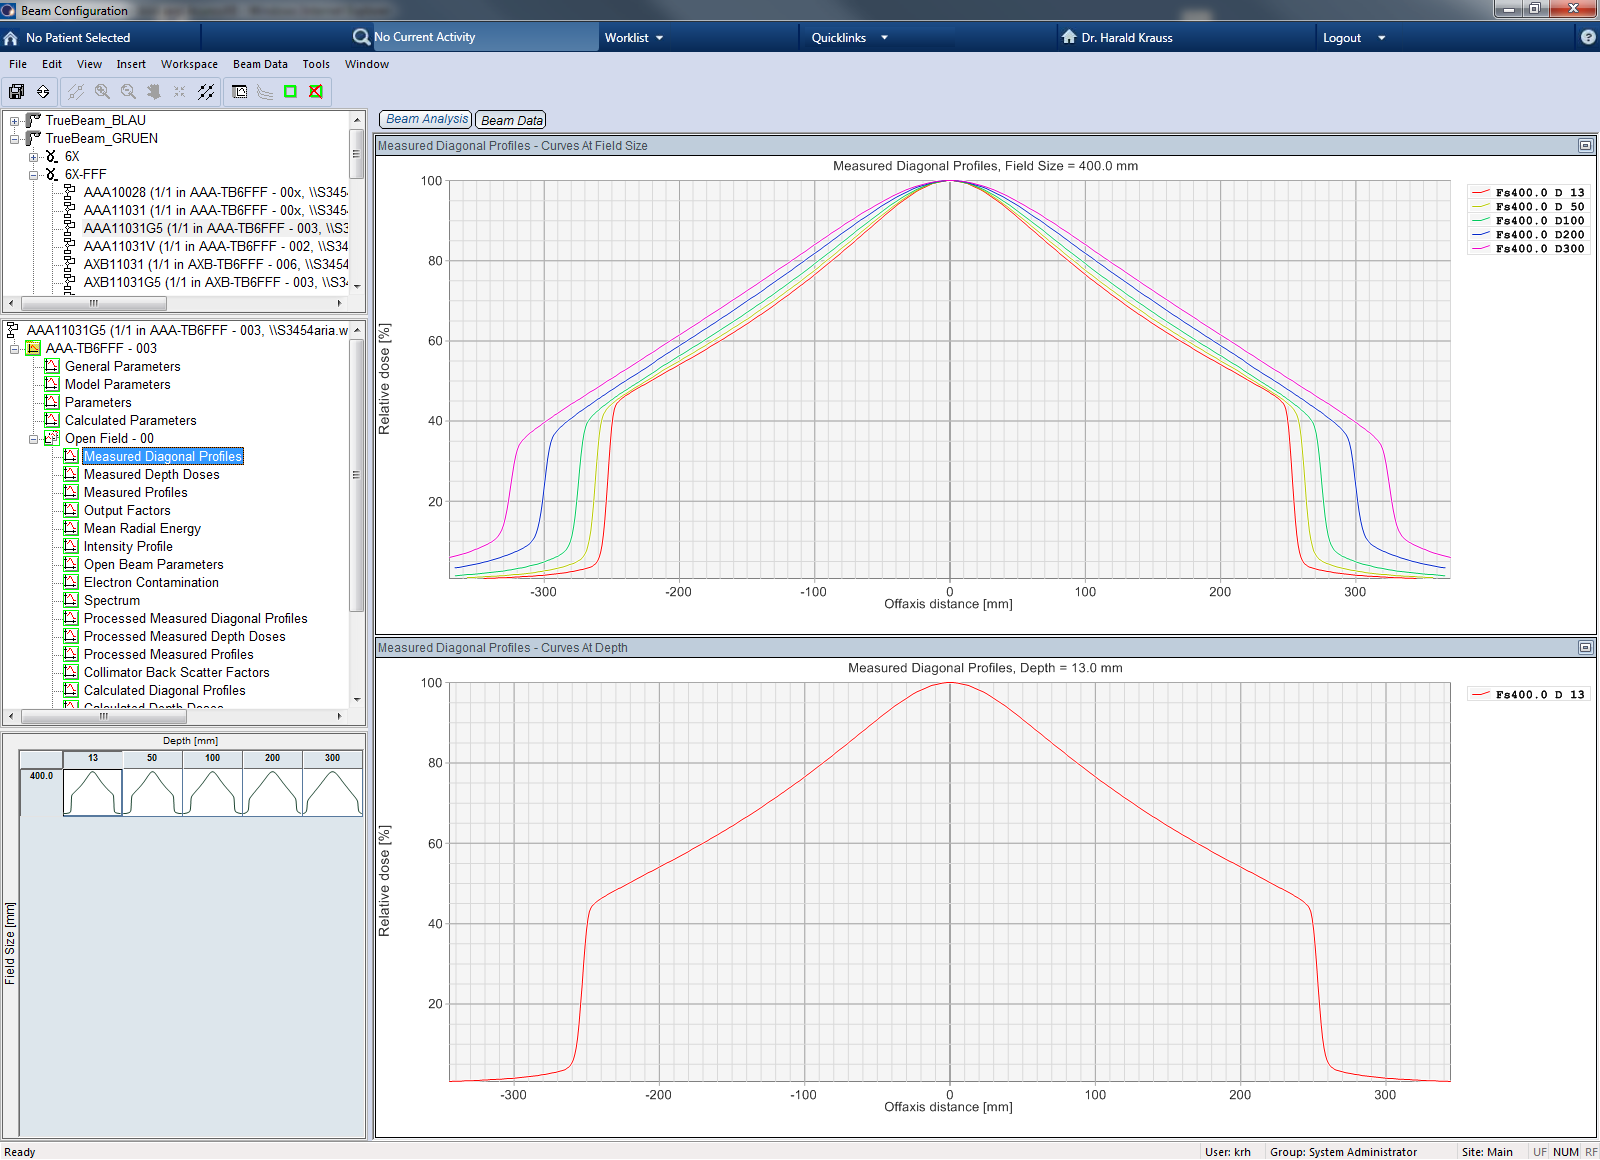
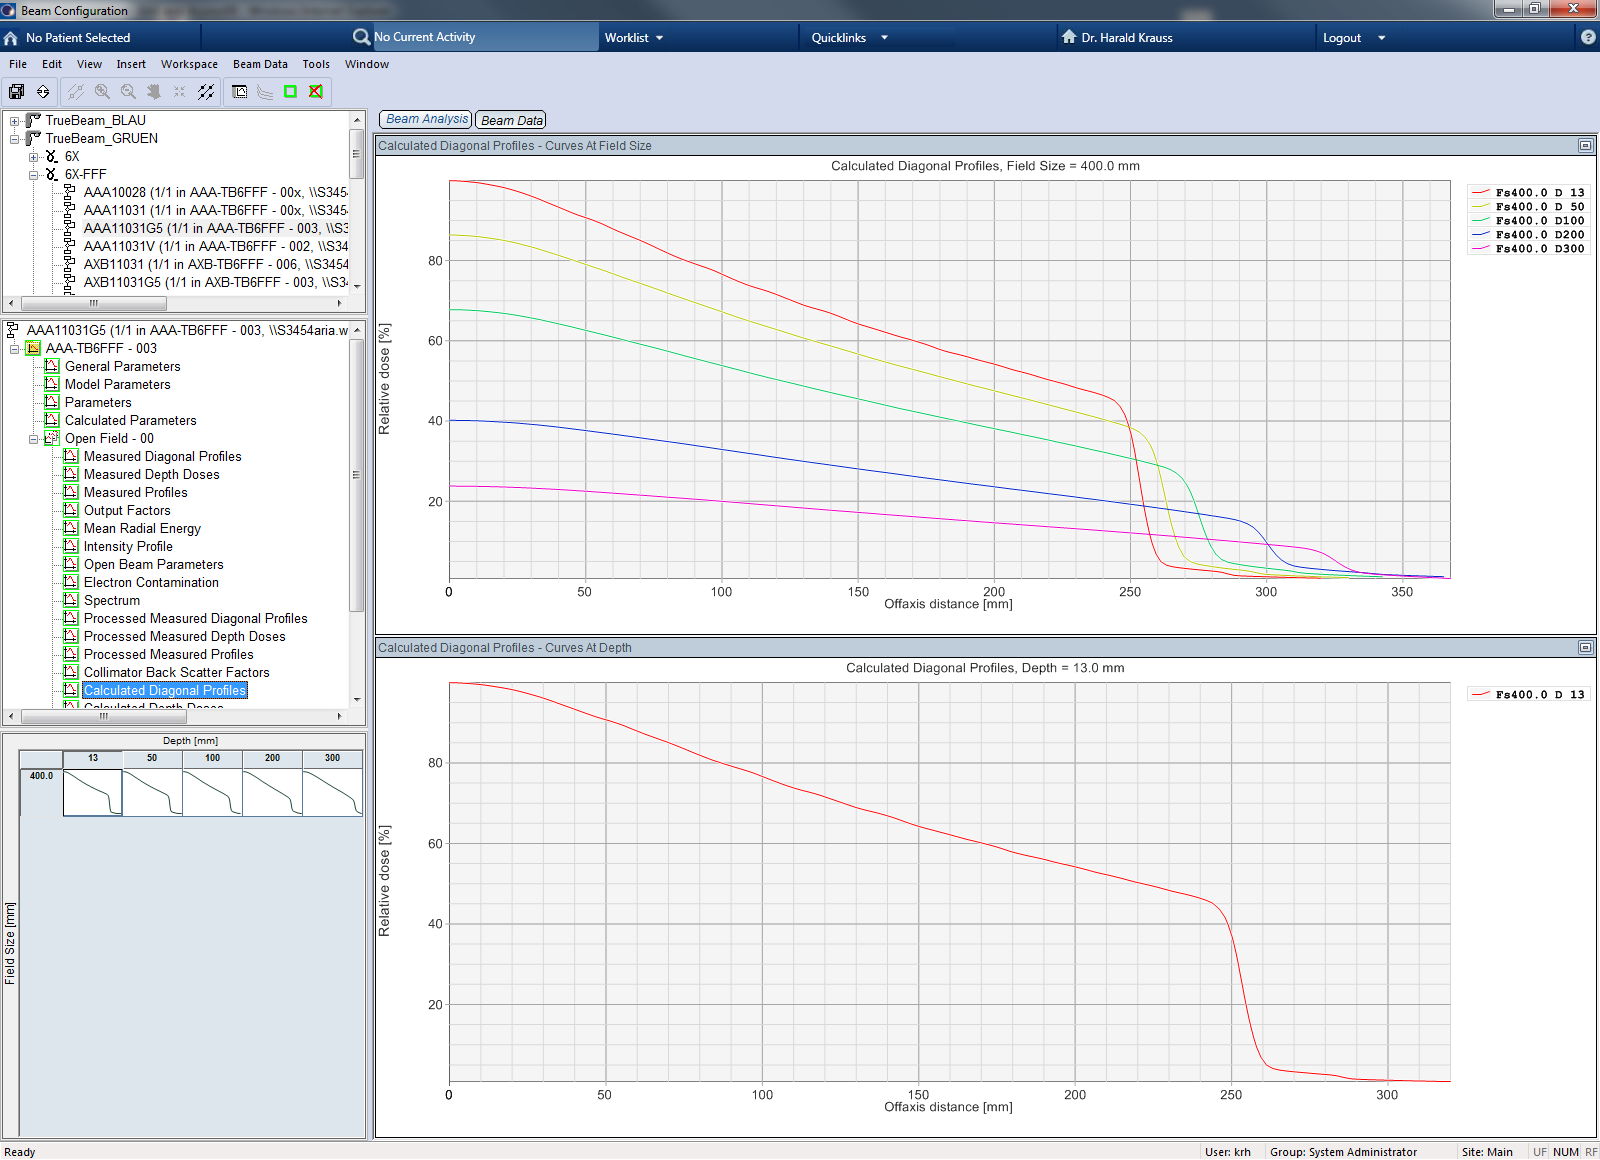
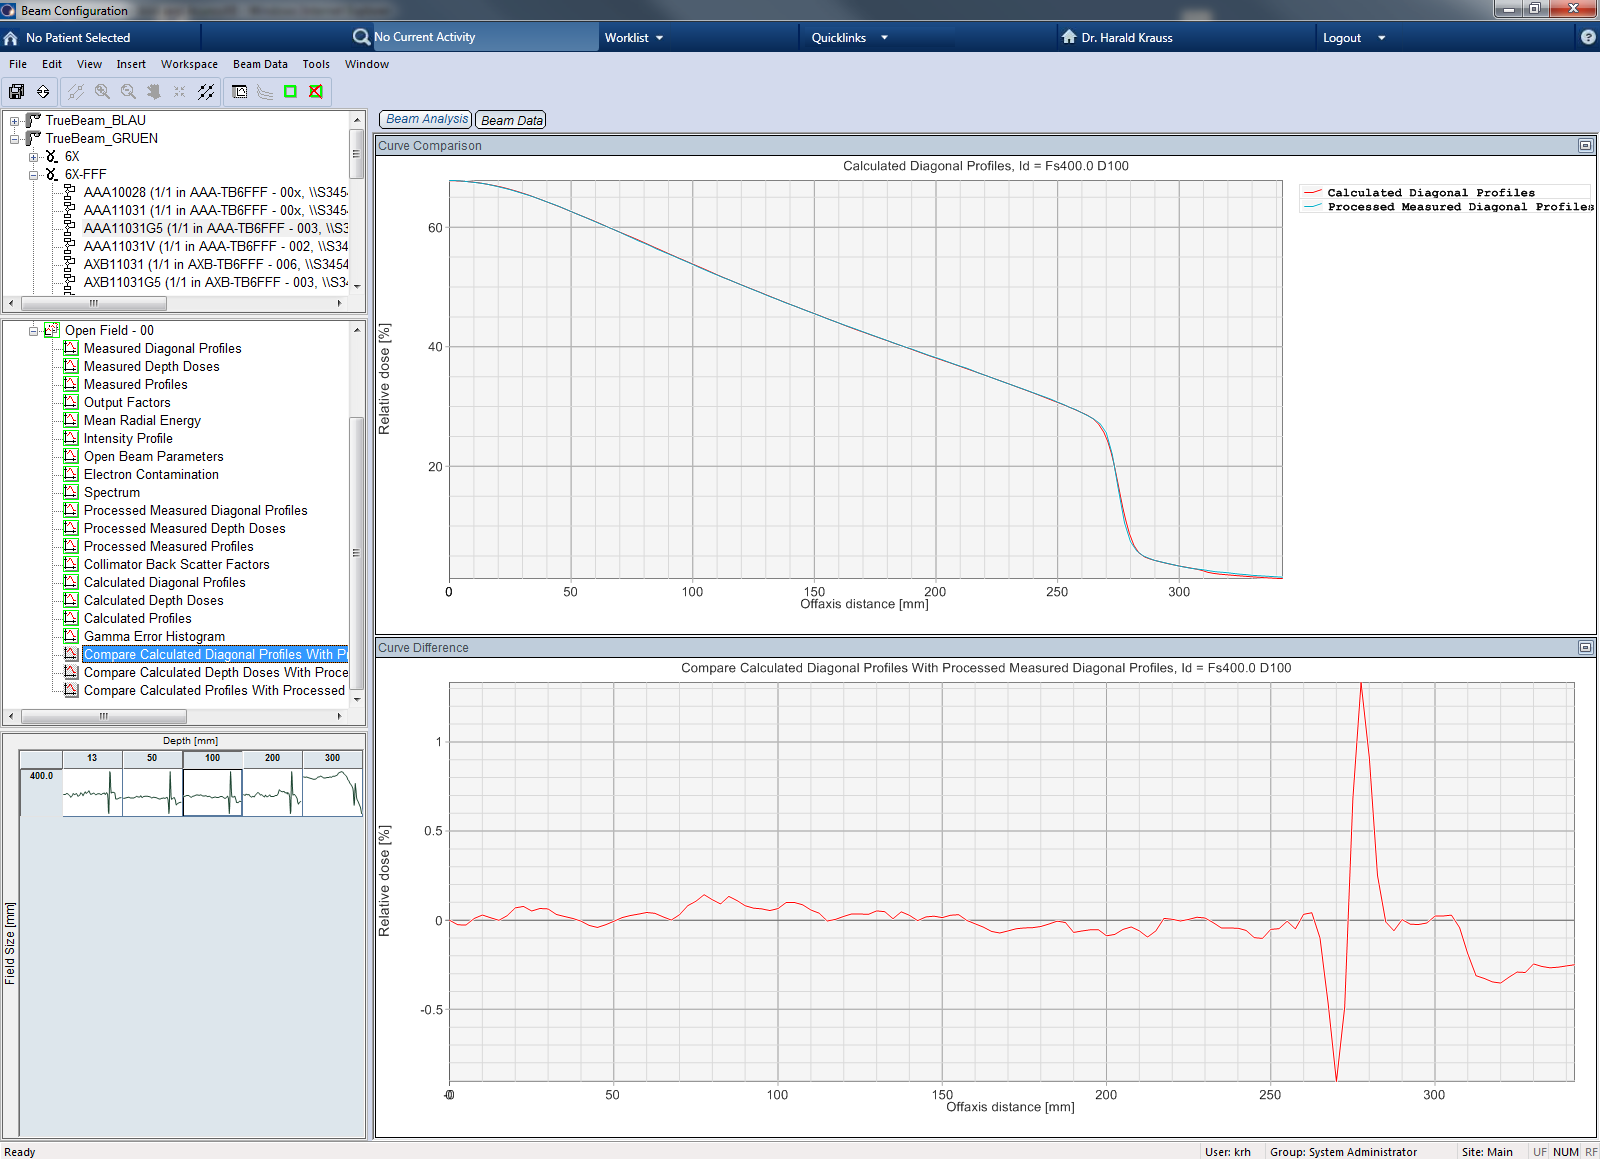
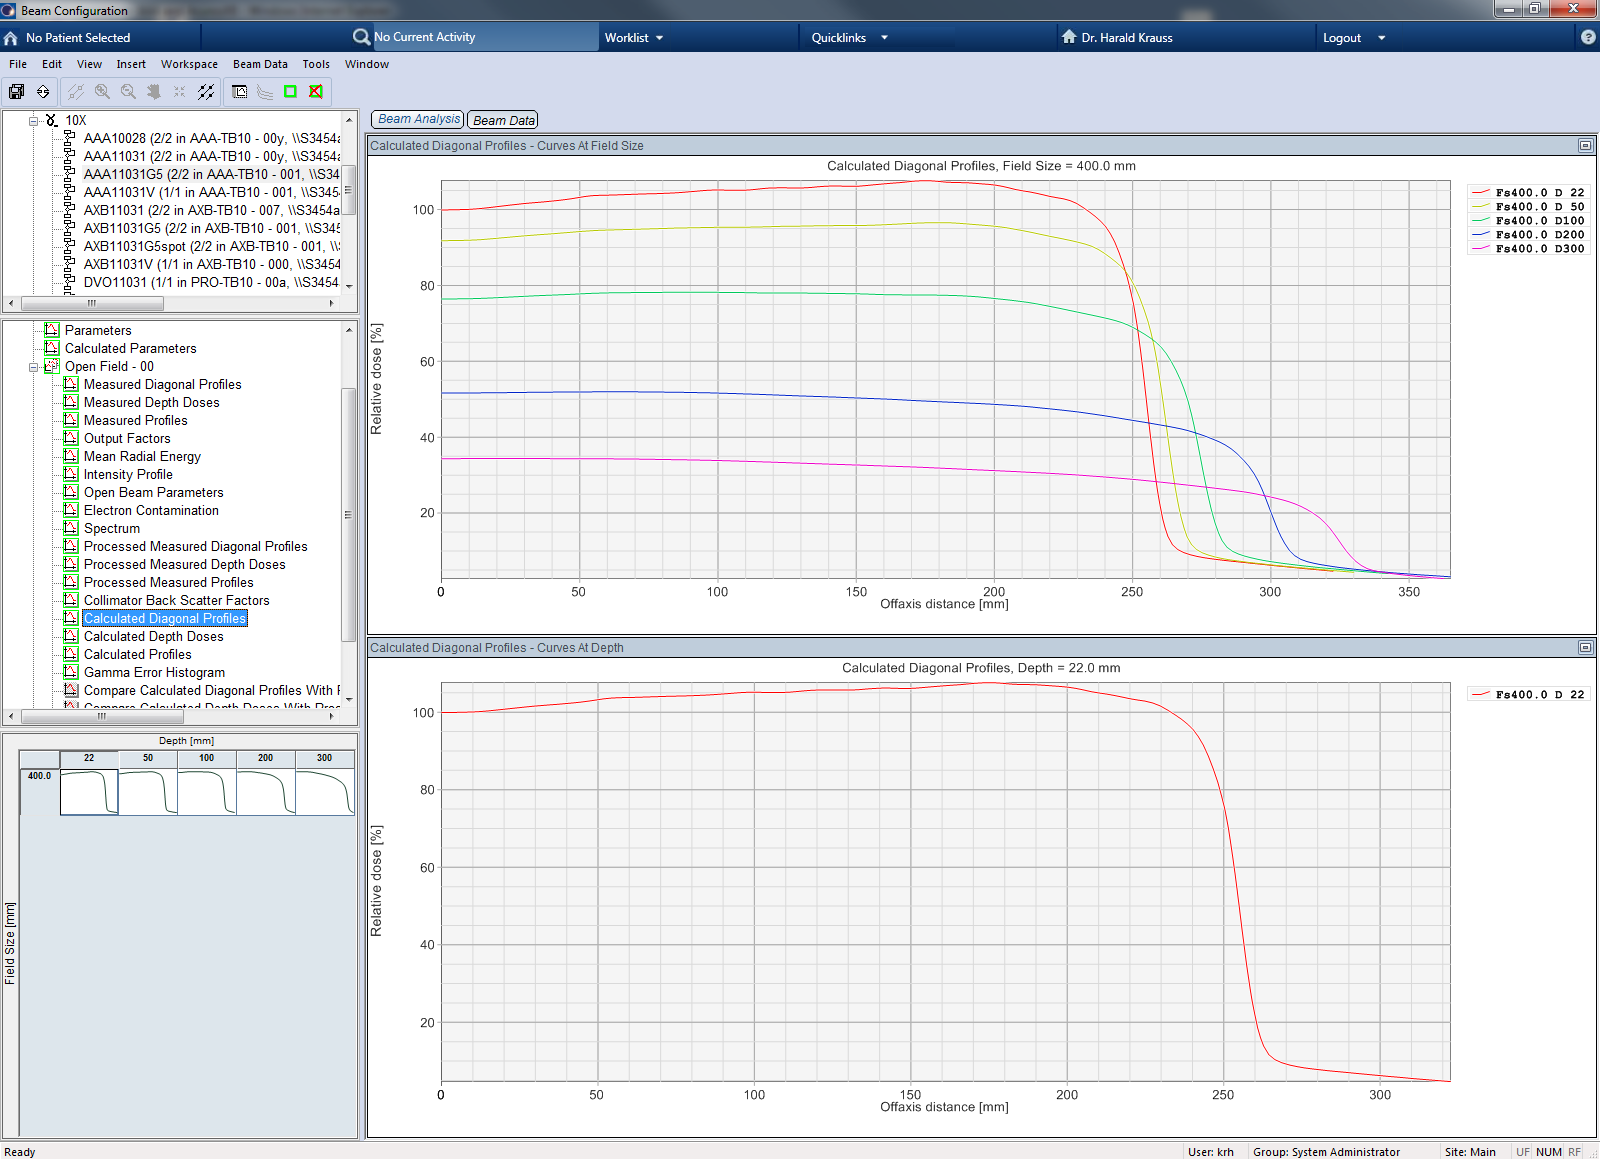
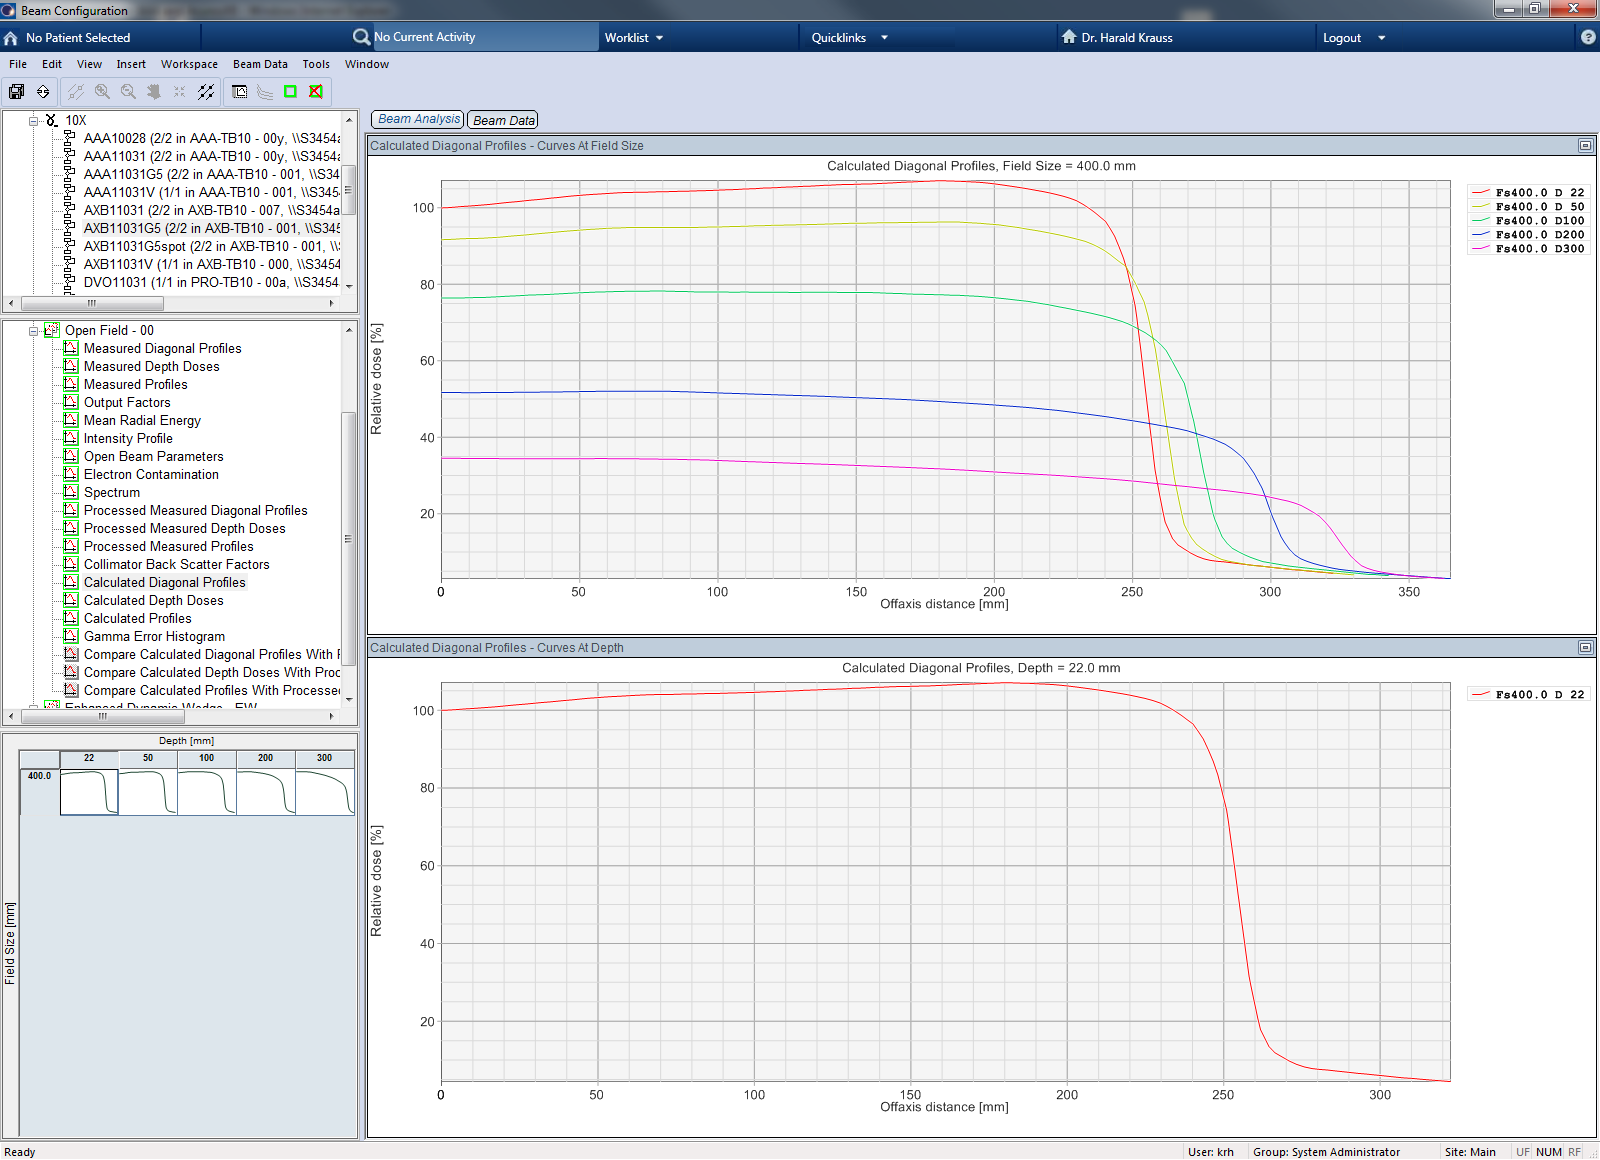
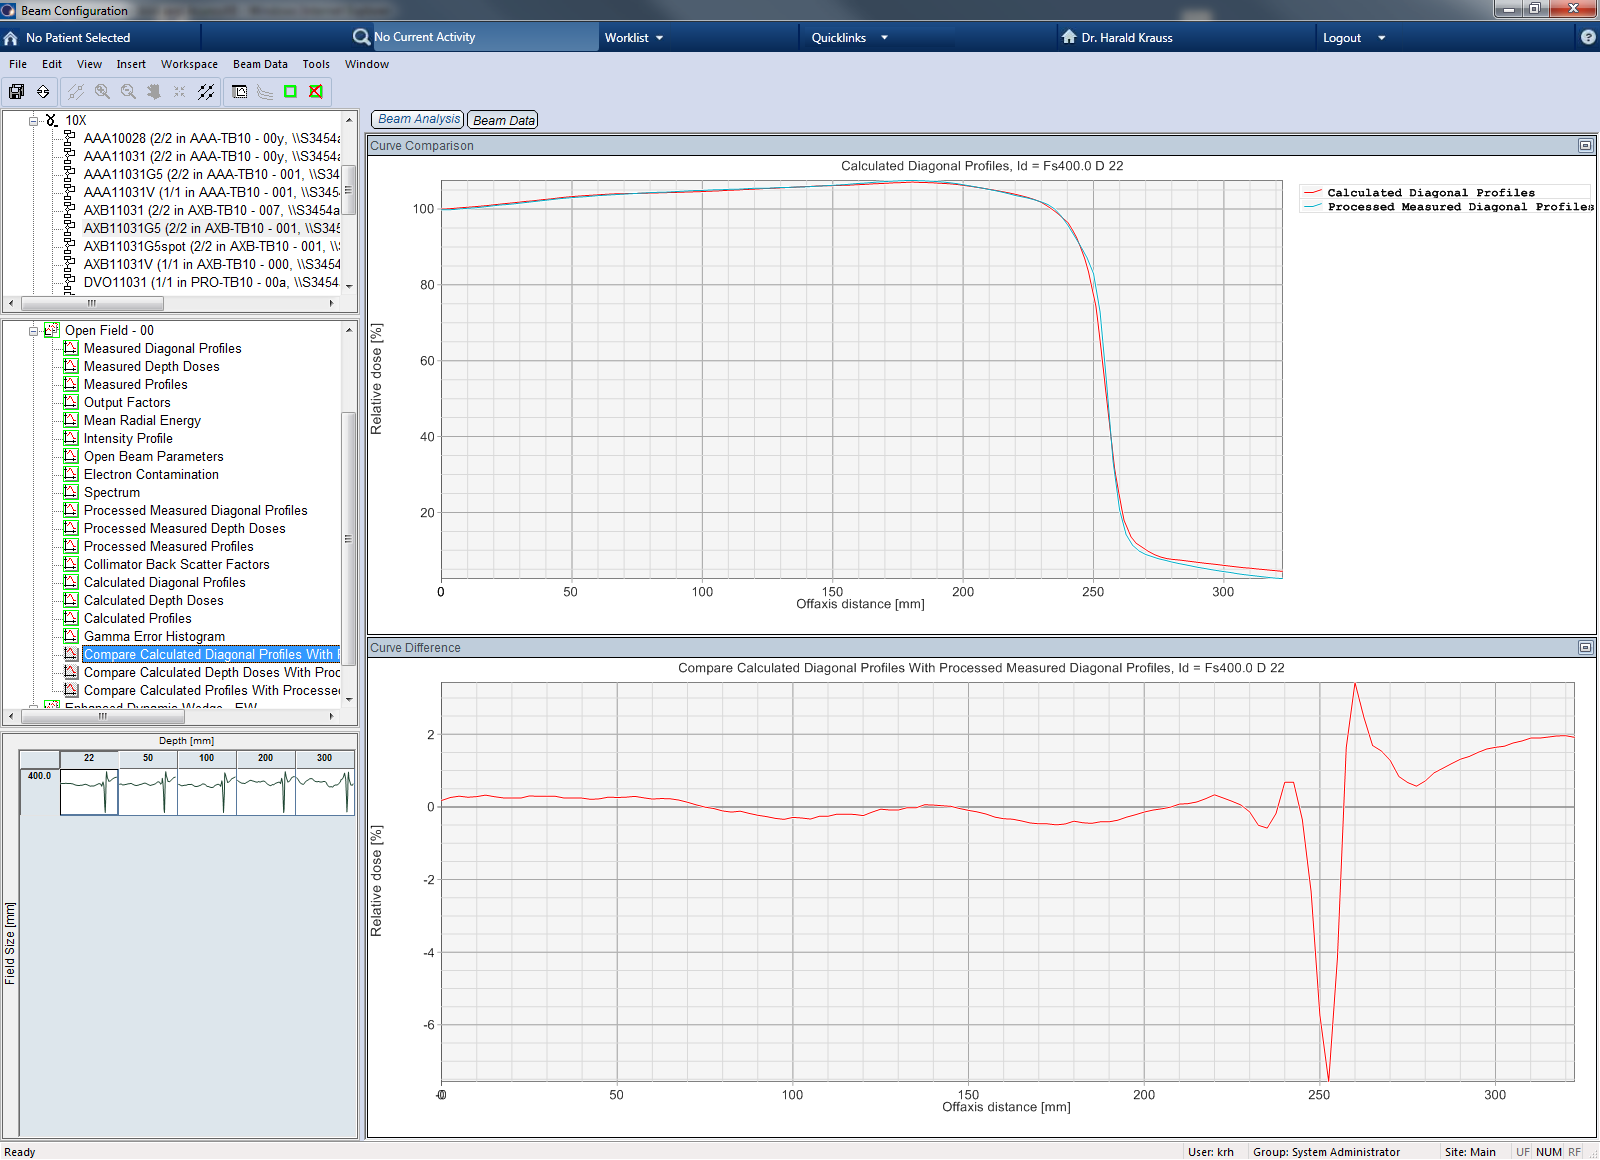
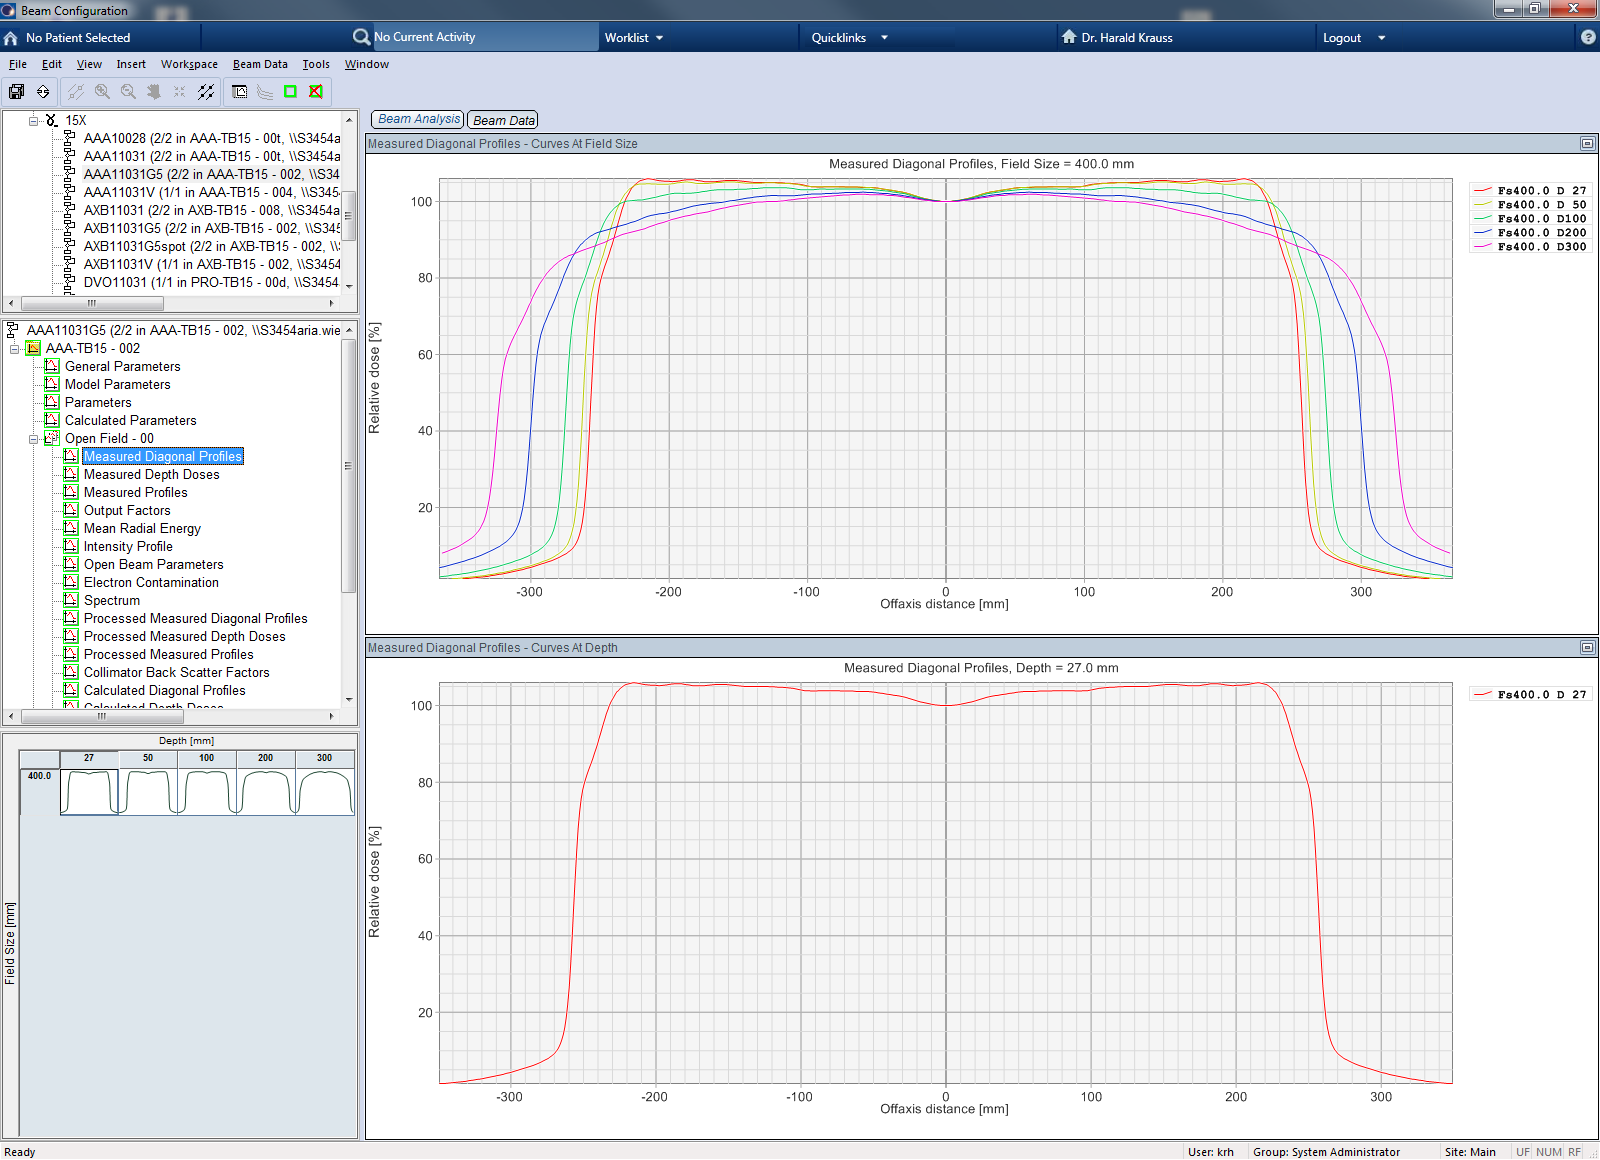
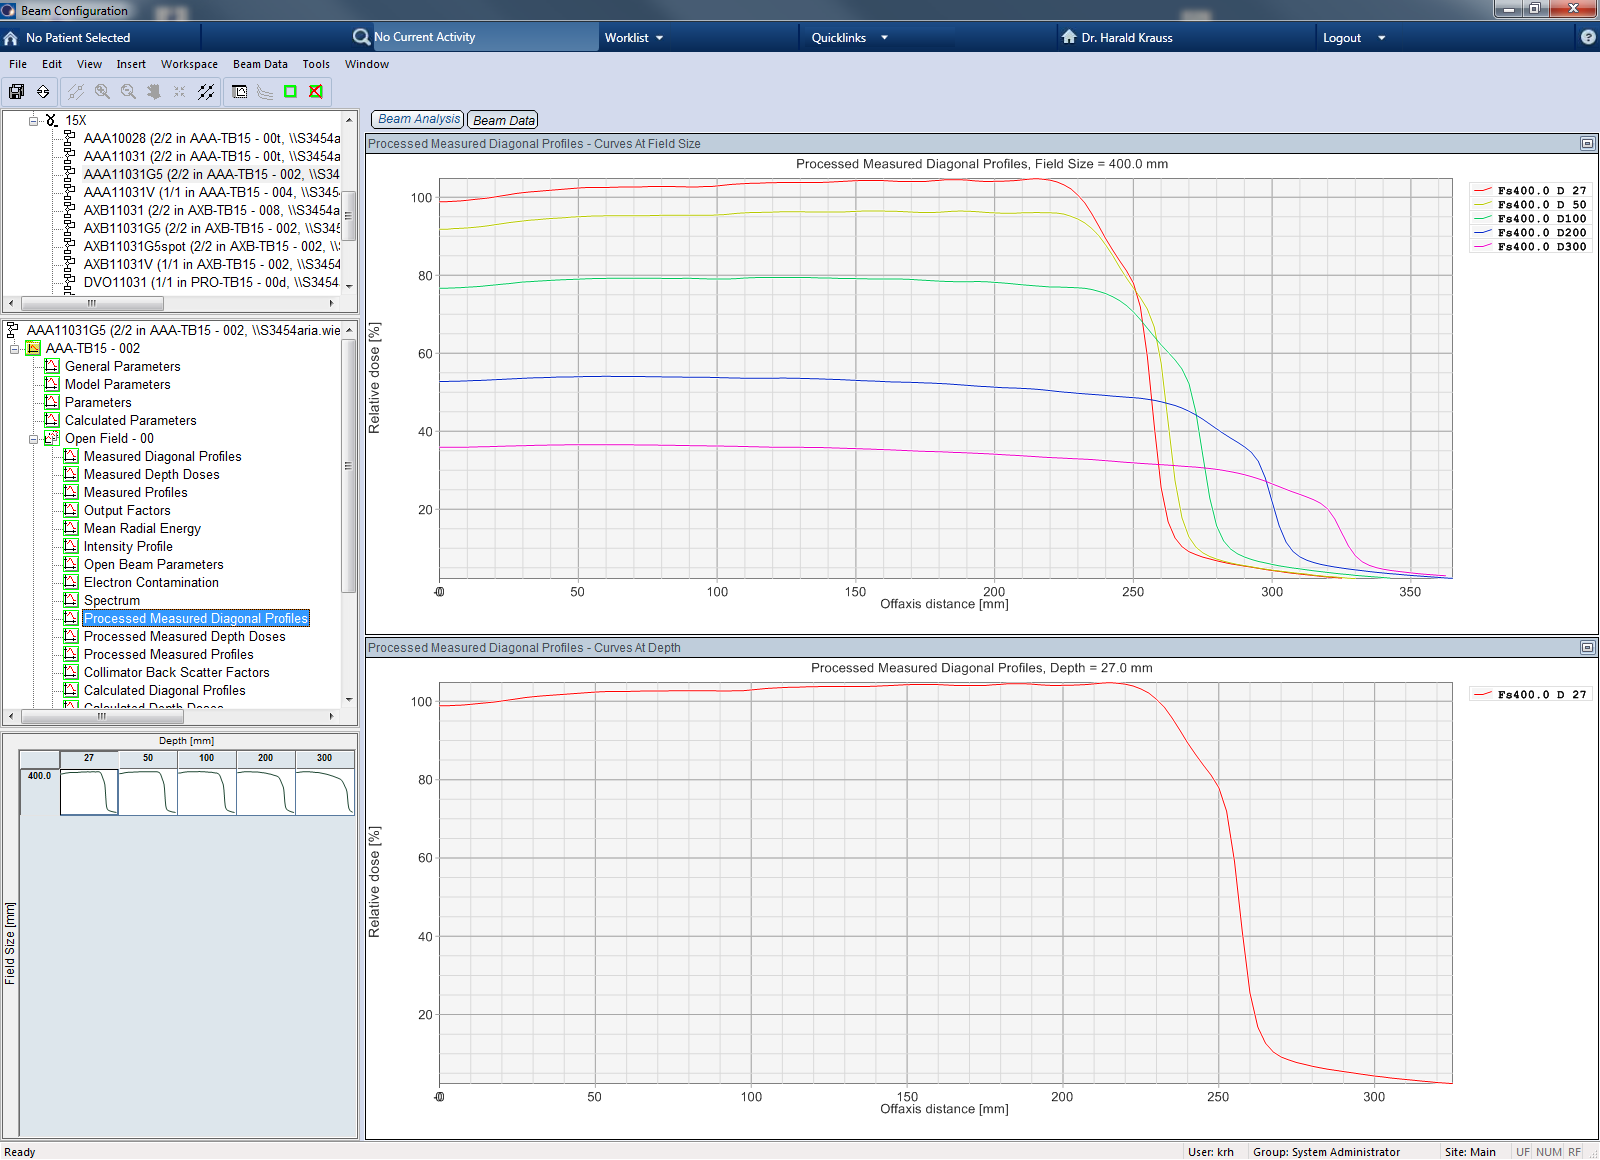
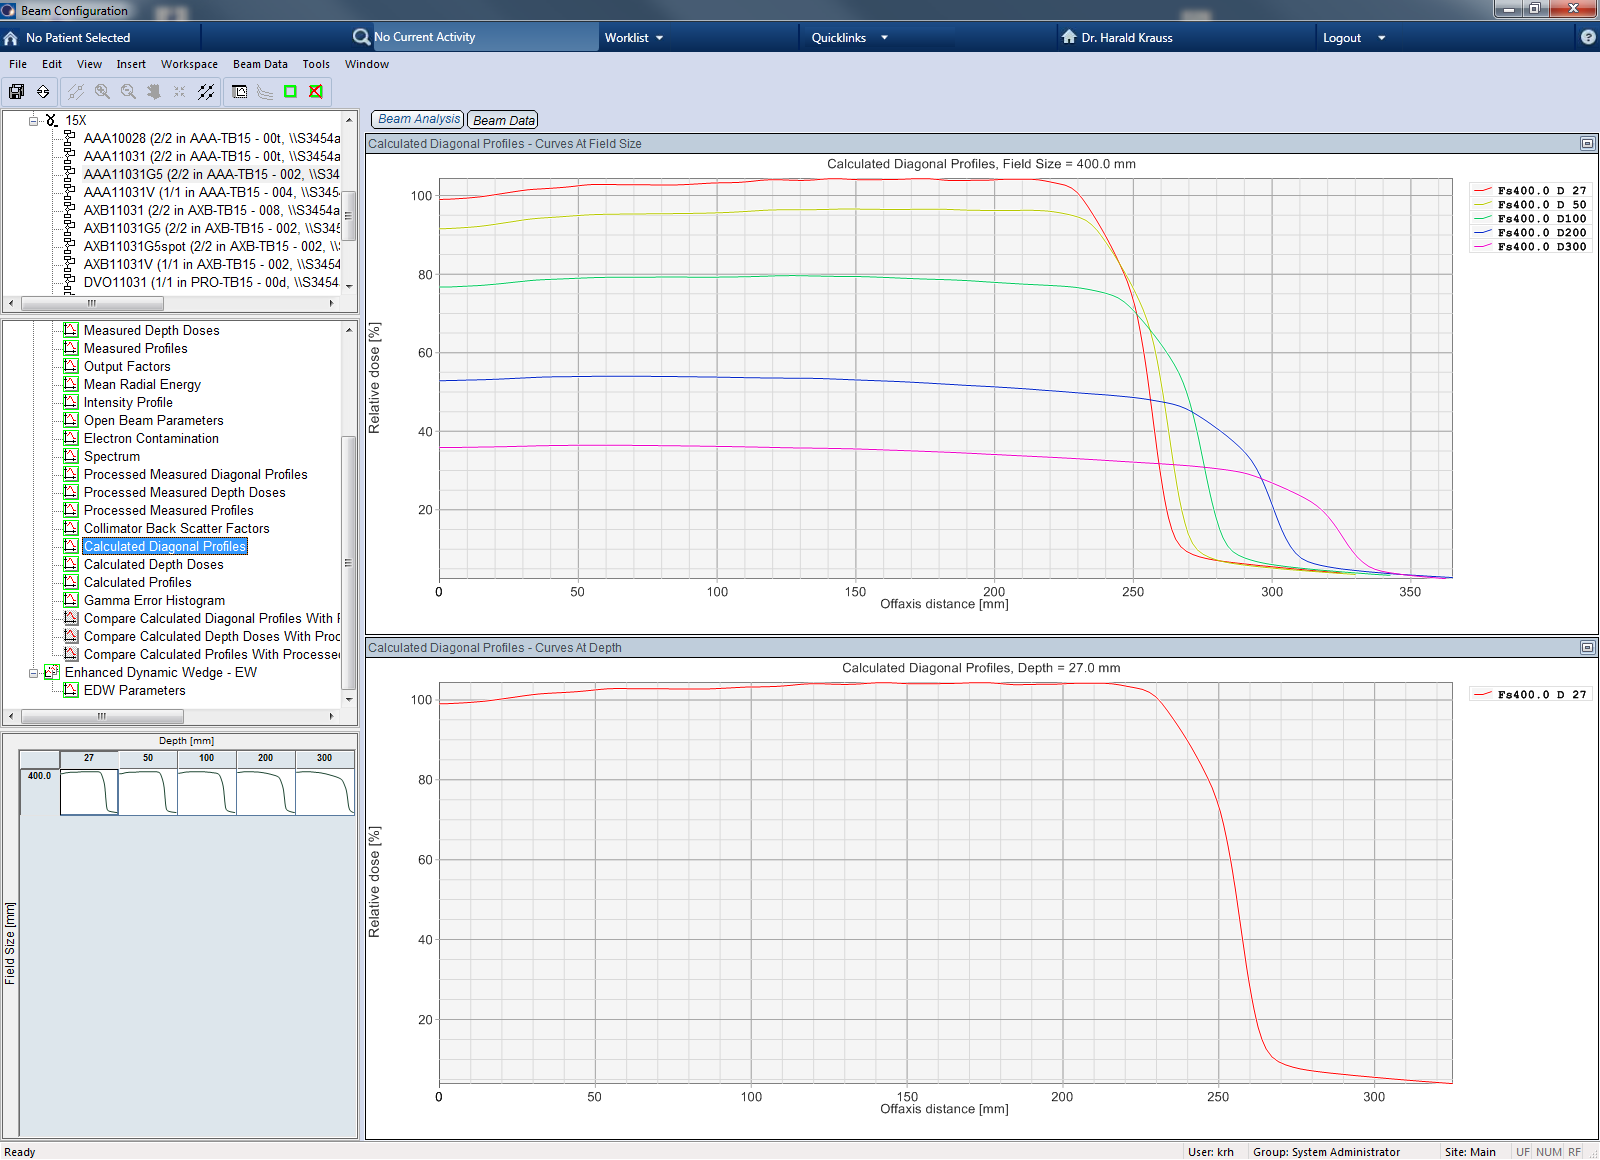
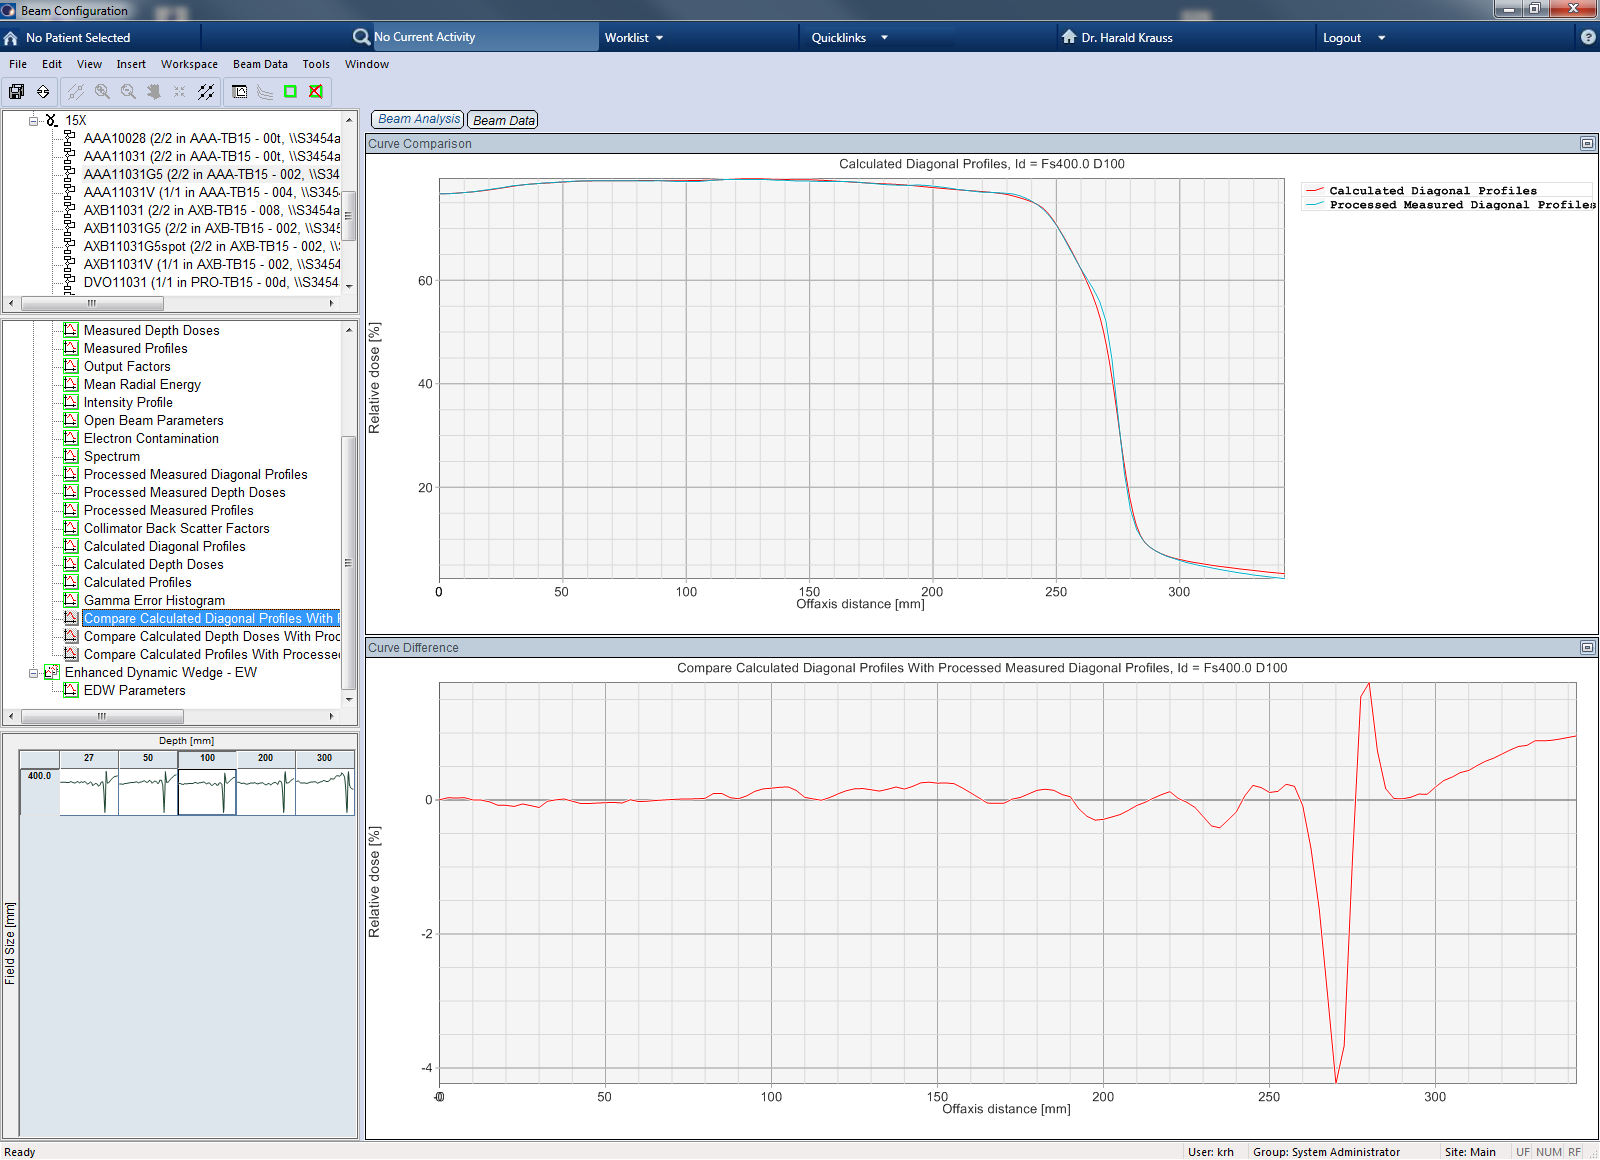
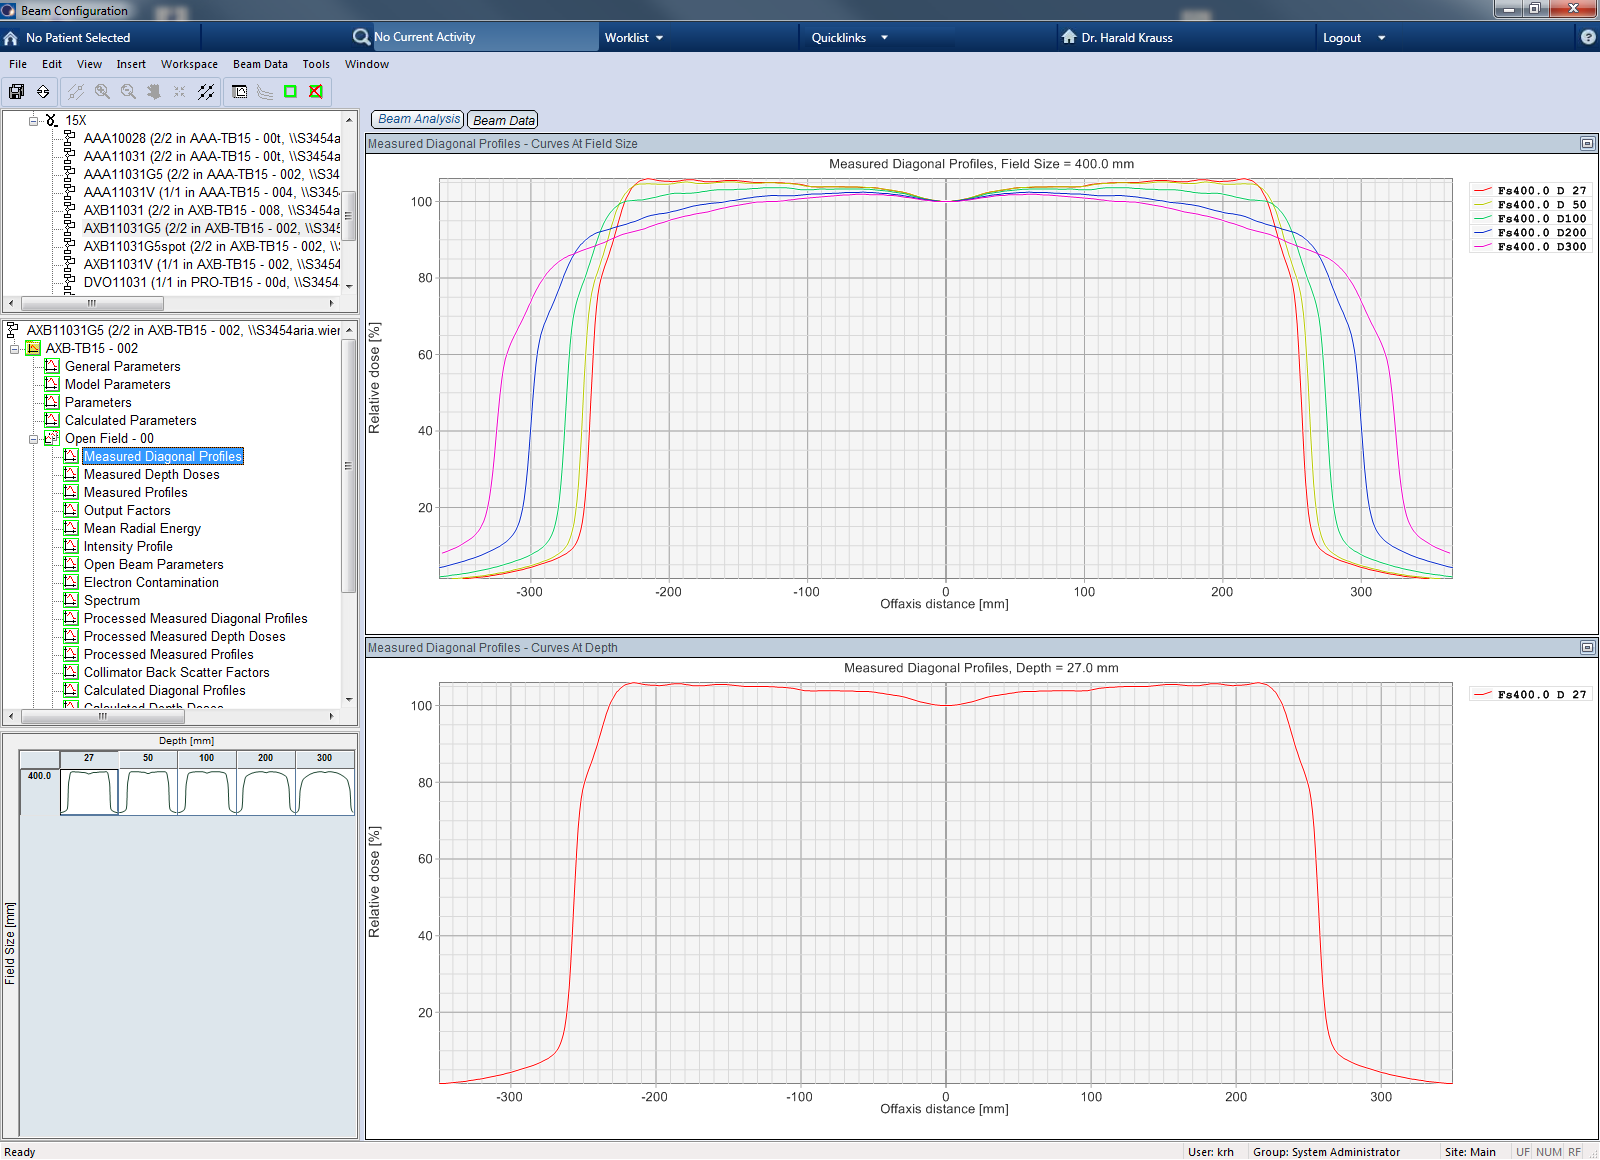
Diagonal Profiles
Eclipse requires a diagonal profile of the largest field size, measured with the same SSD and at the same (five) depths as the crossplane profiles. This is the only curve data which was not measured with a PP15. Instead, the thimble ionization chamber PTW TM31010, S/N 4882 was used.
Chamber and Phantom Setup
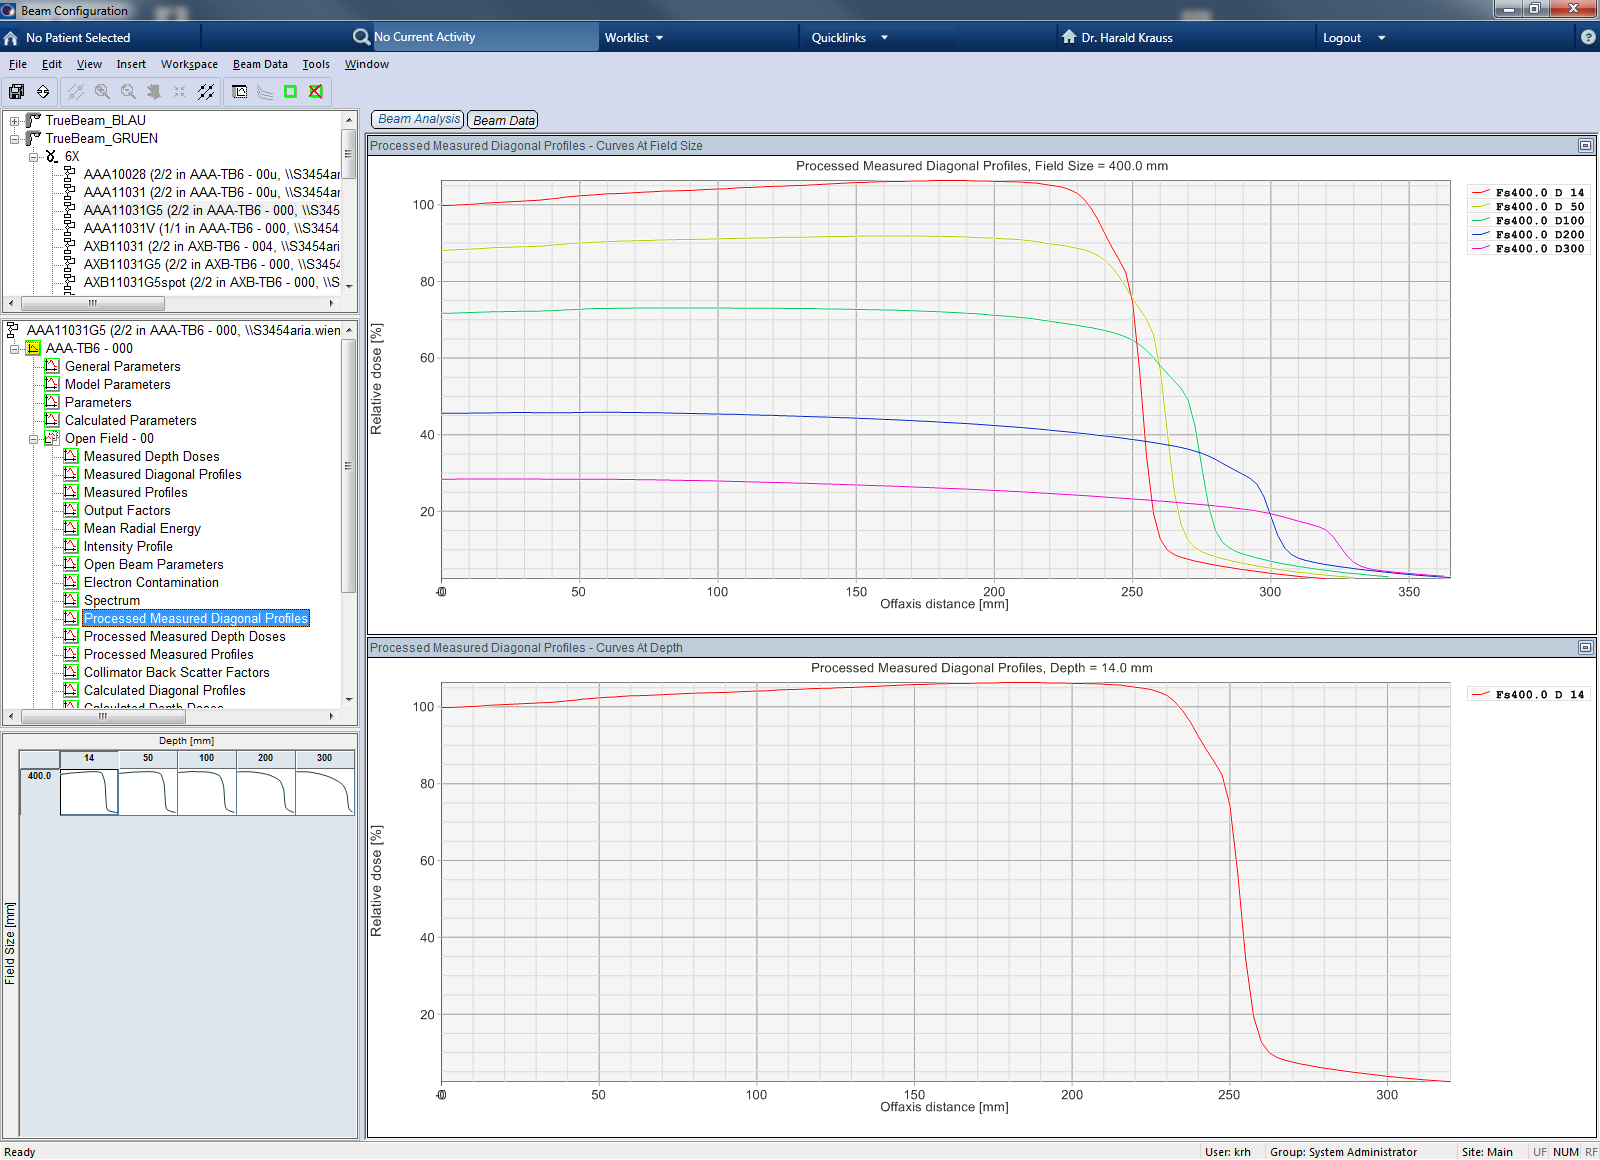
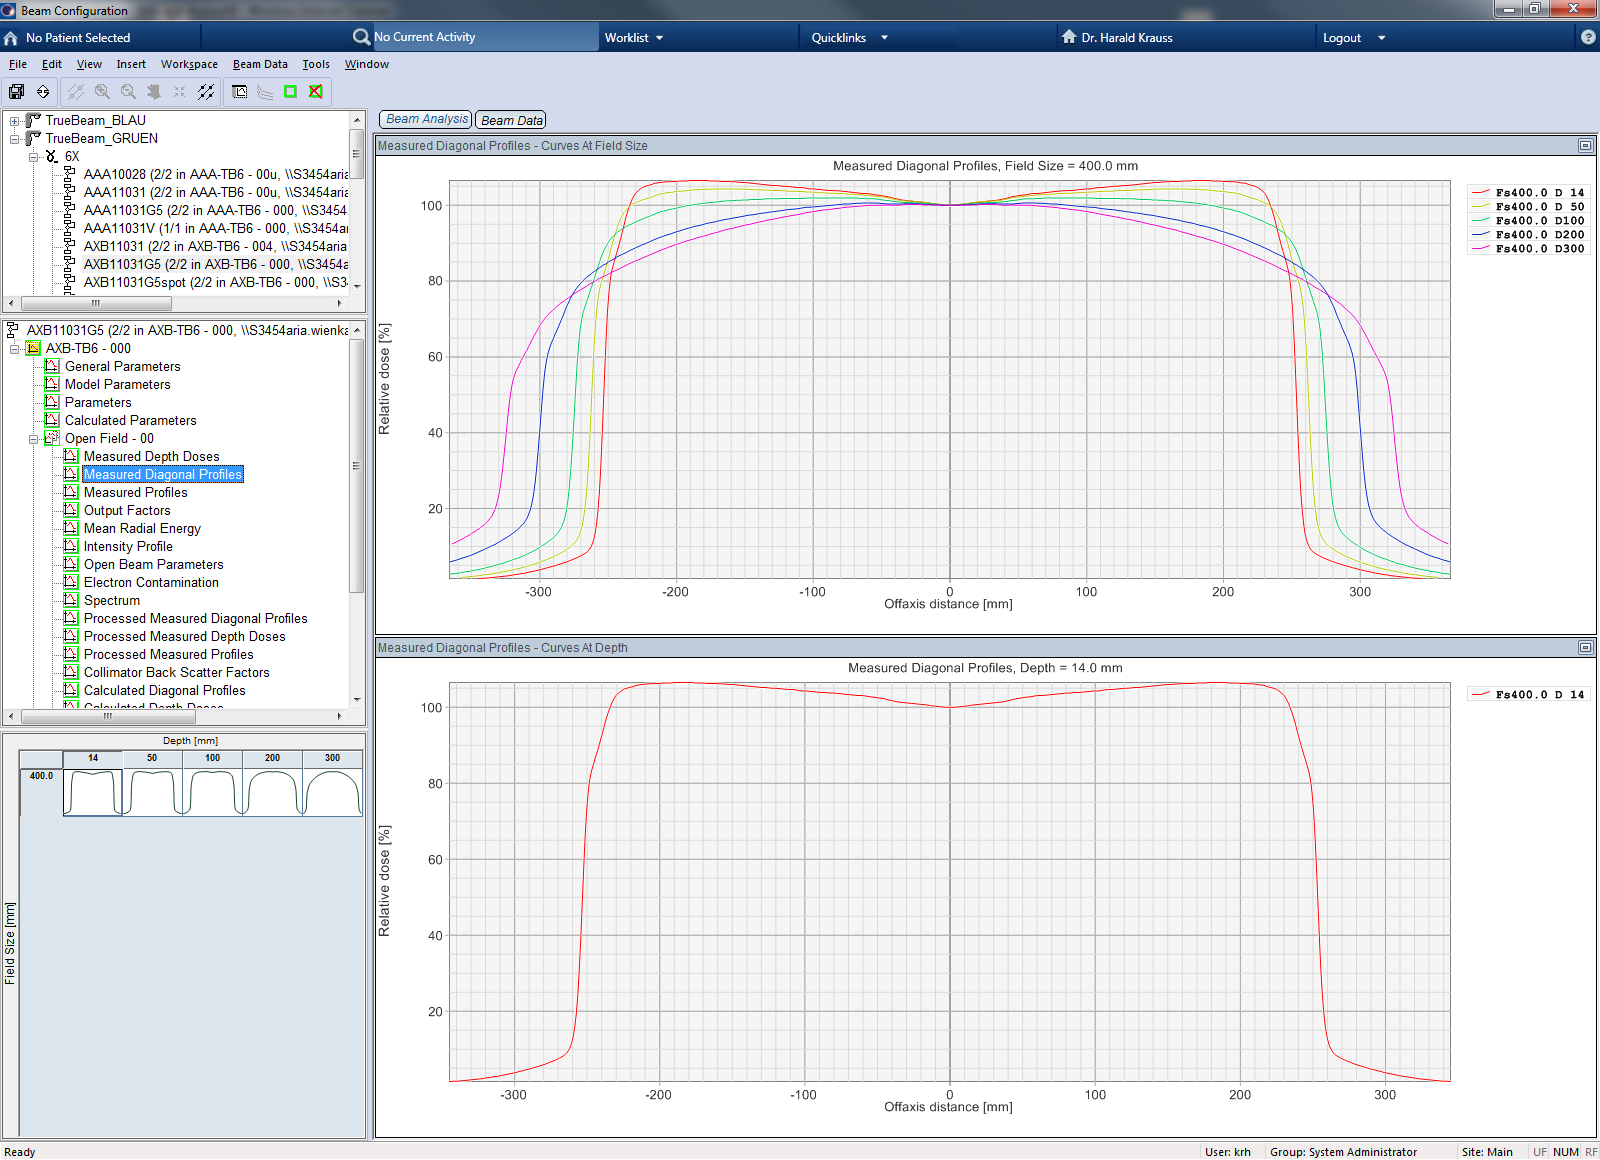
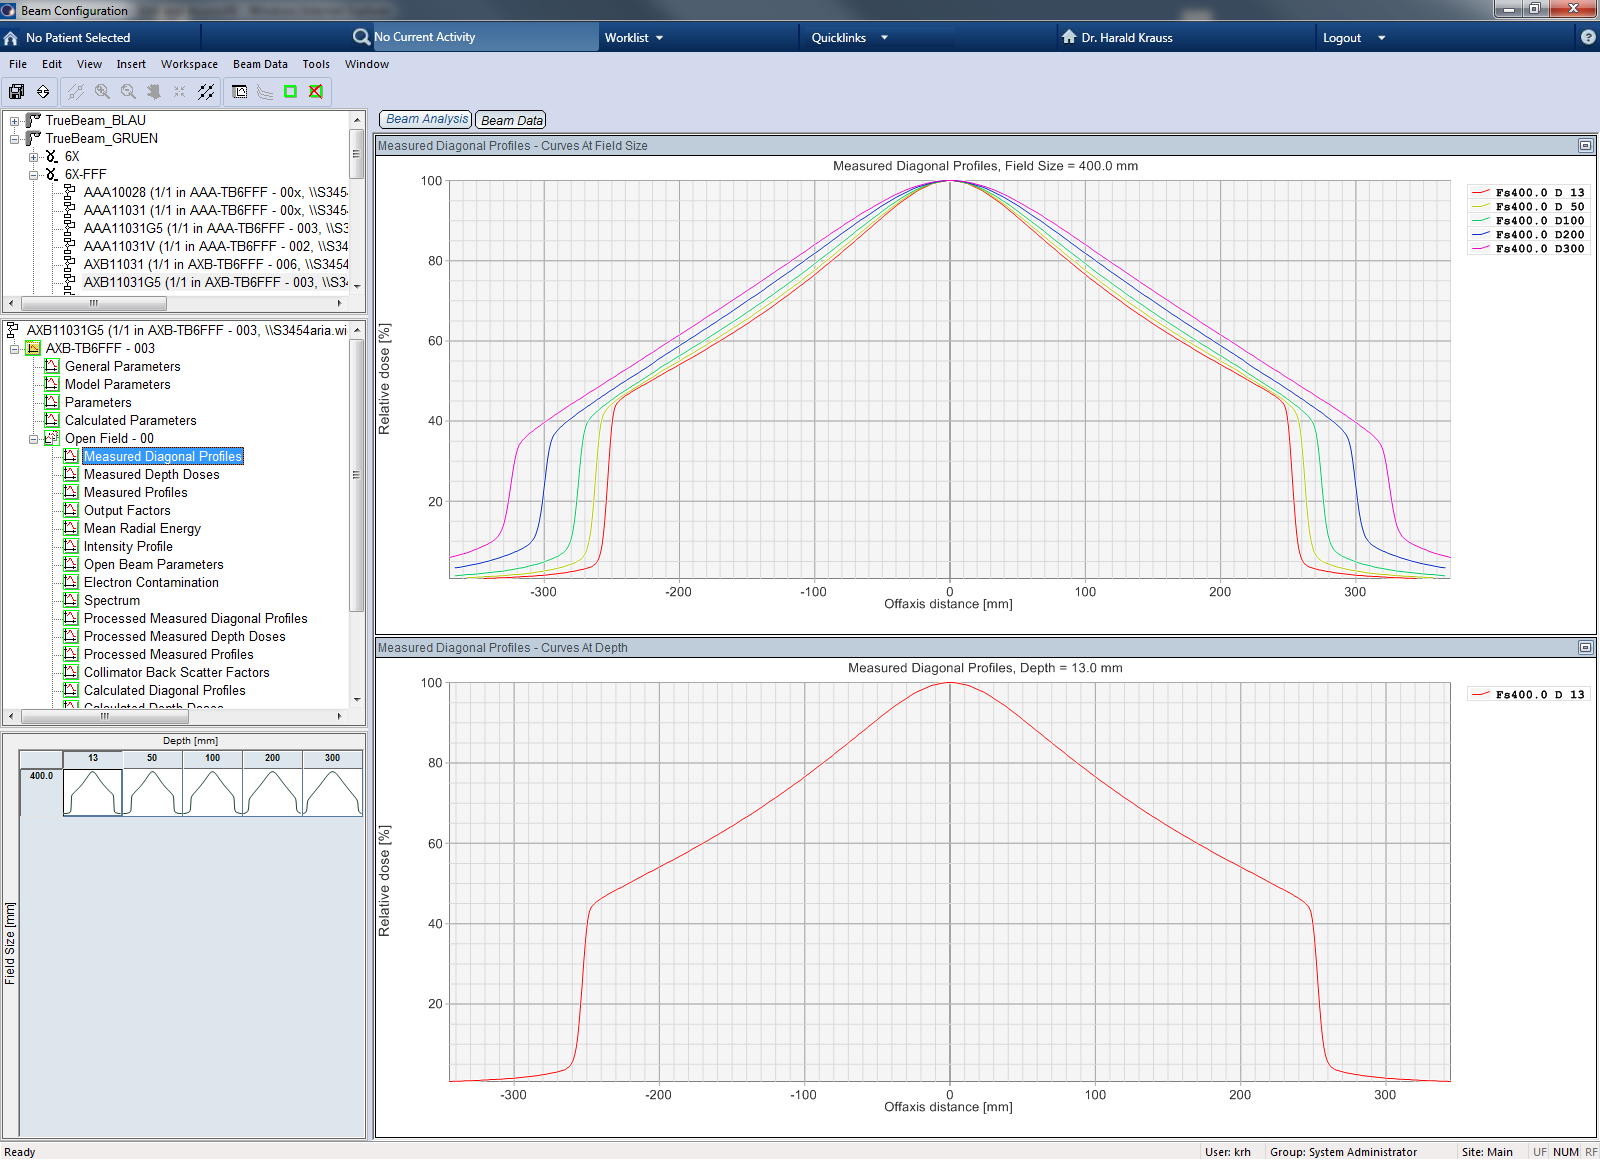
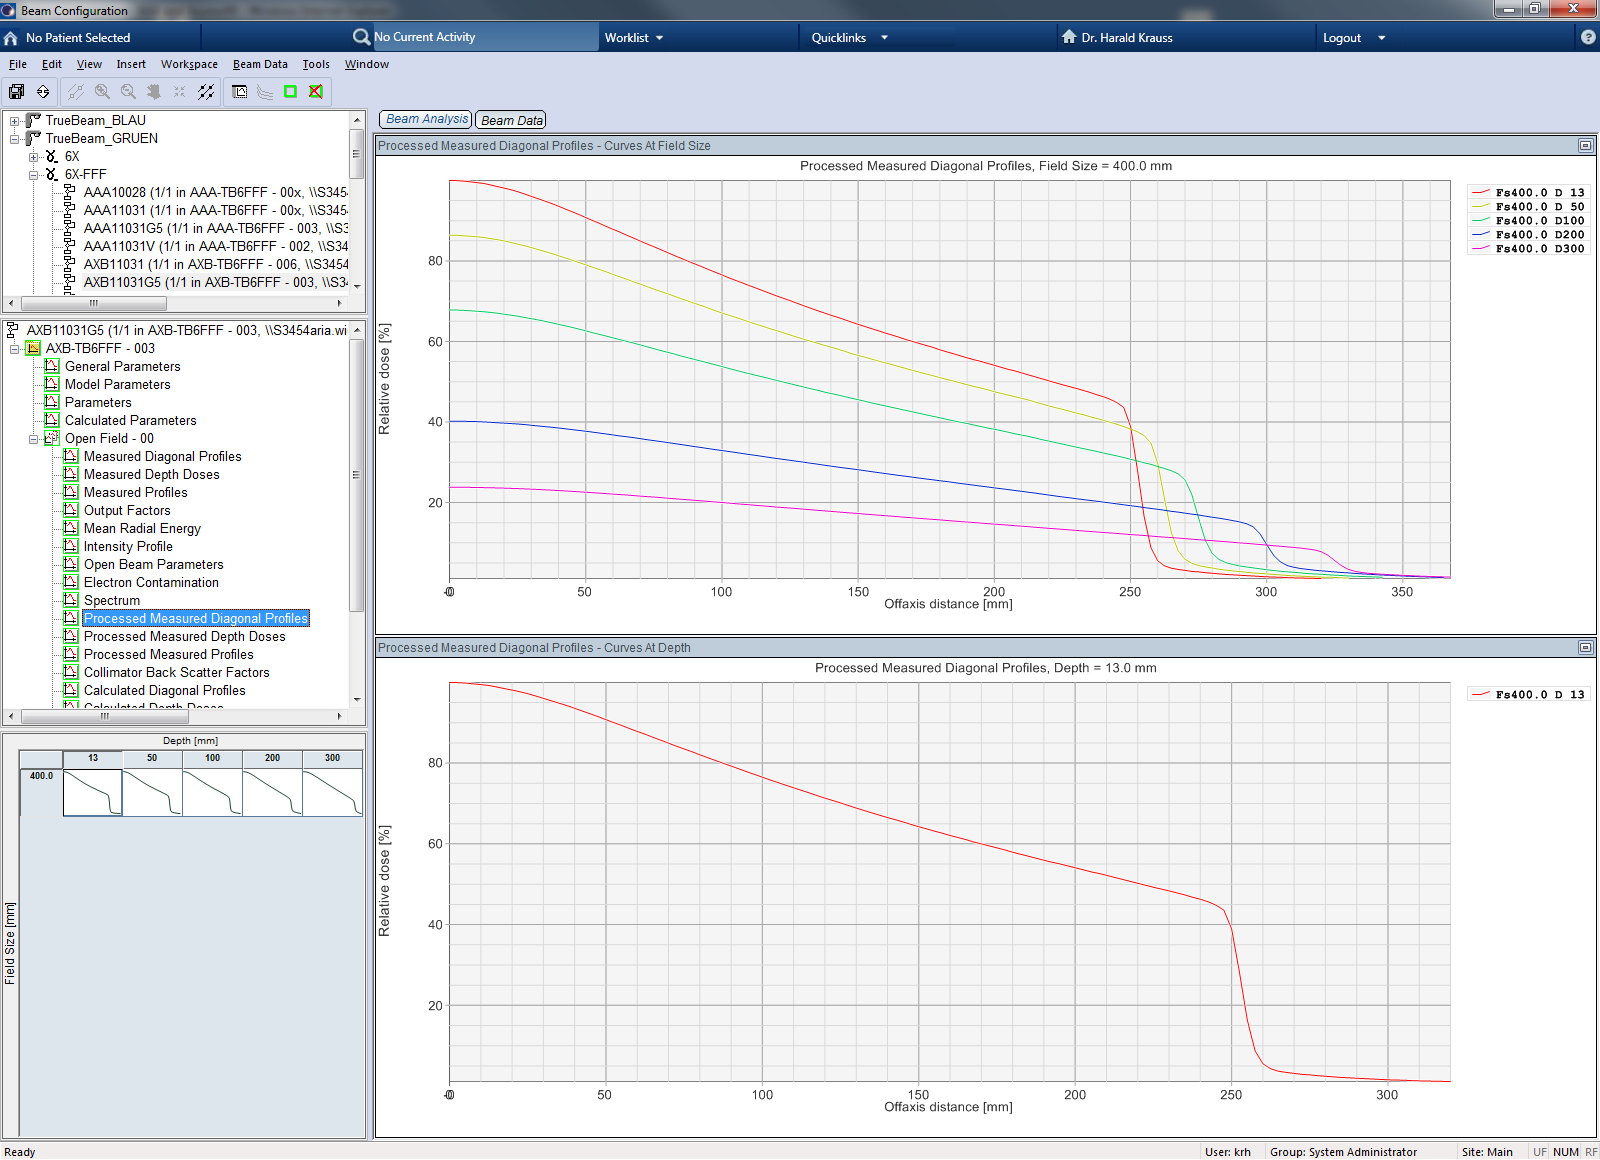
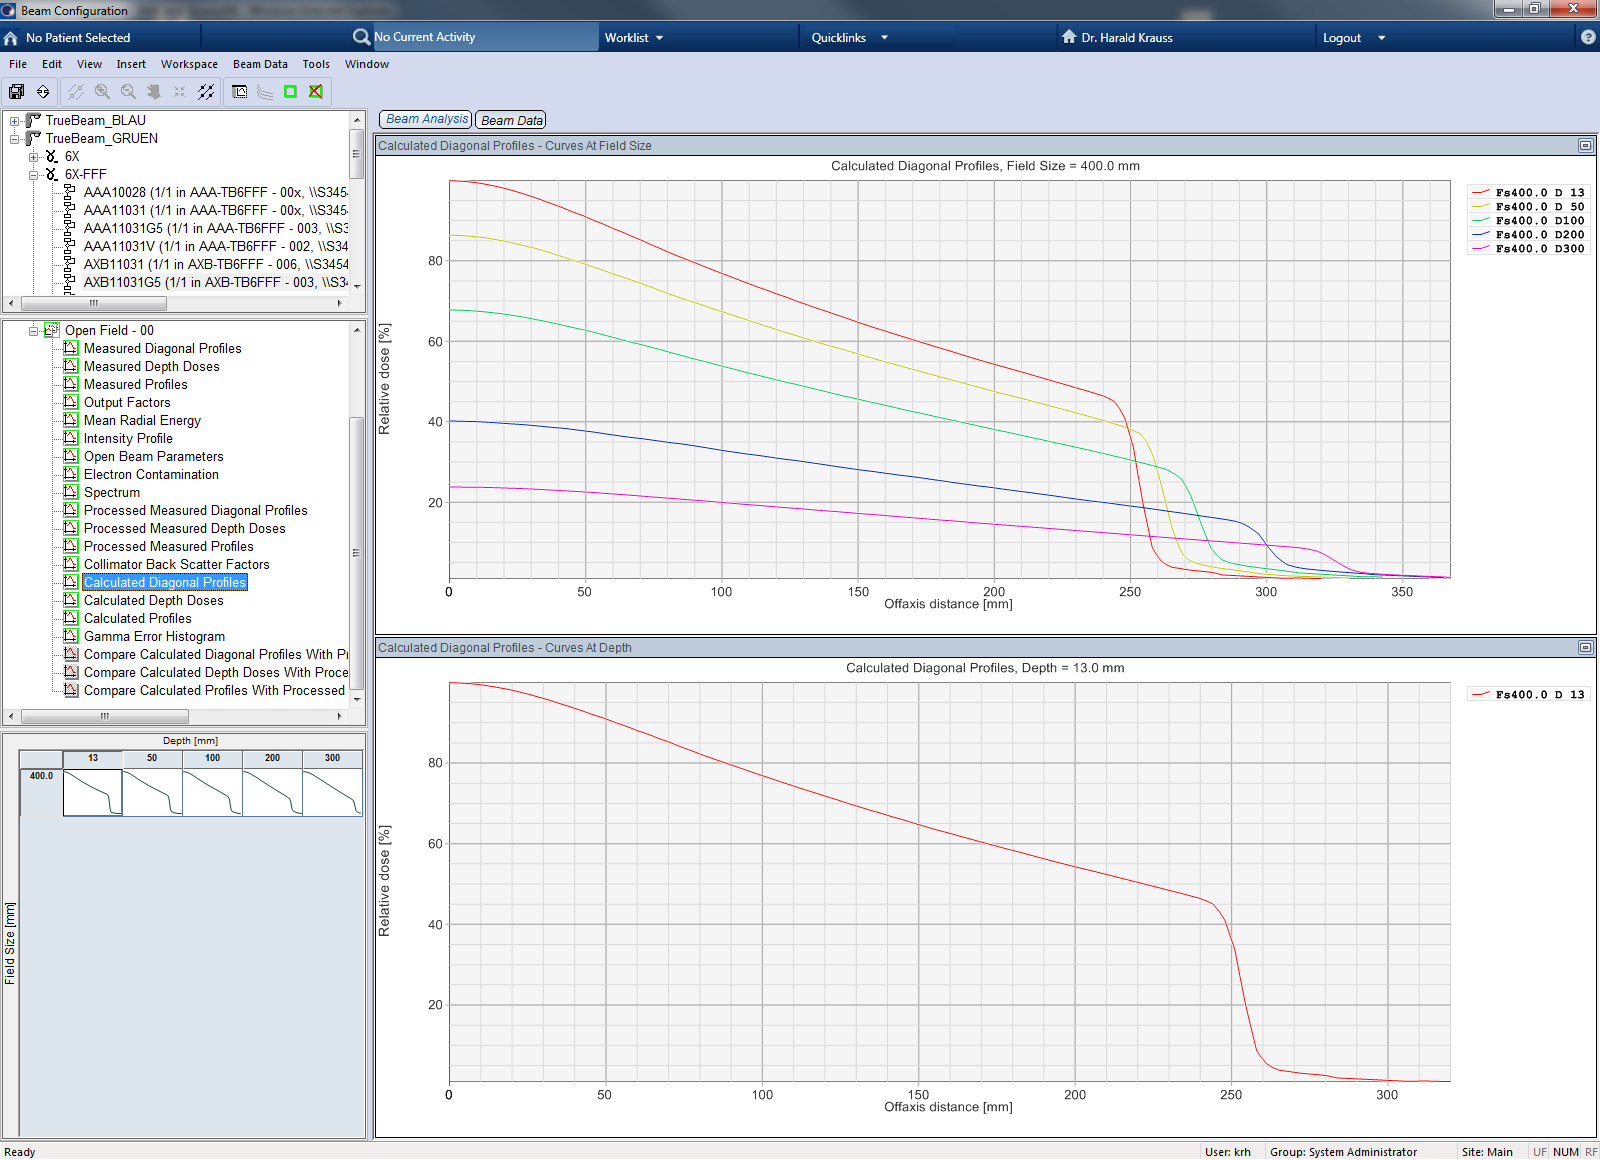
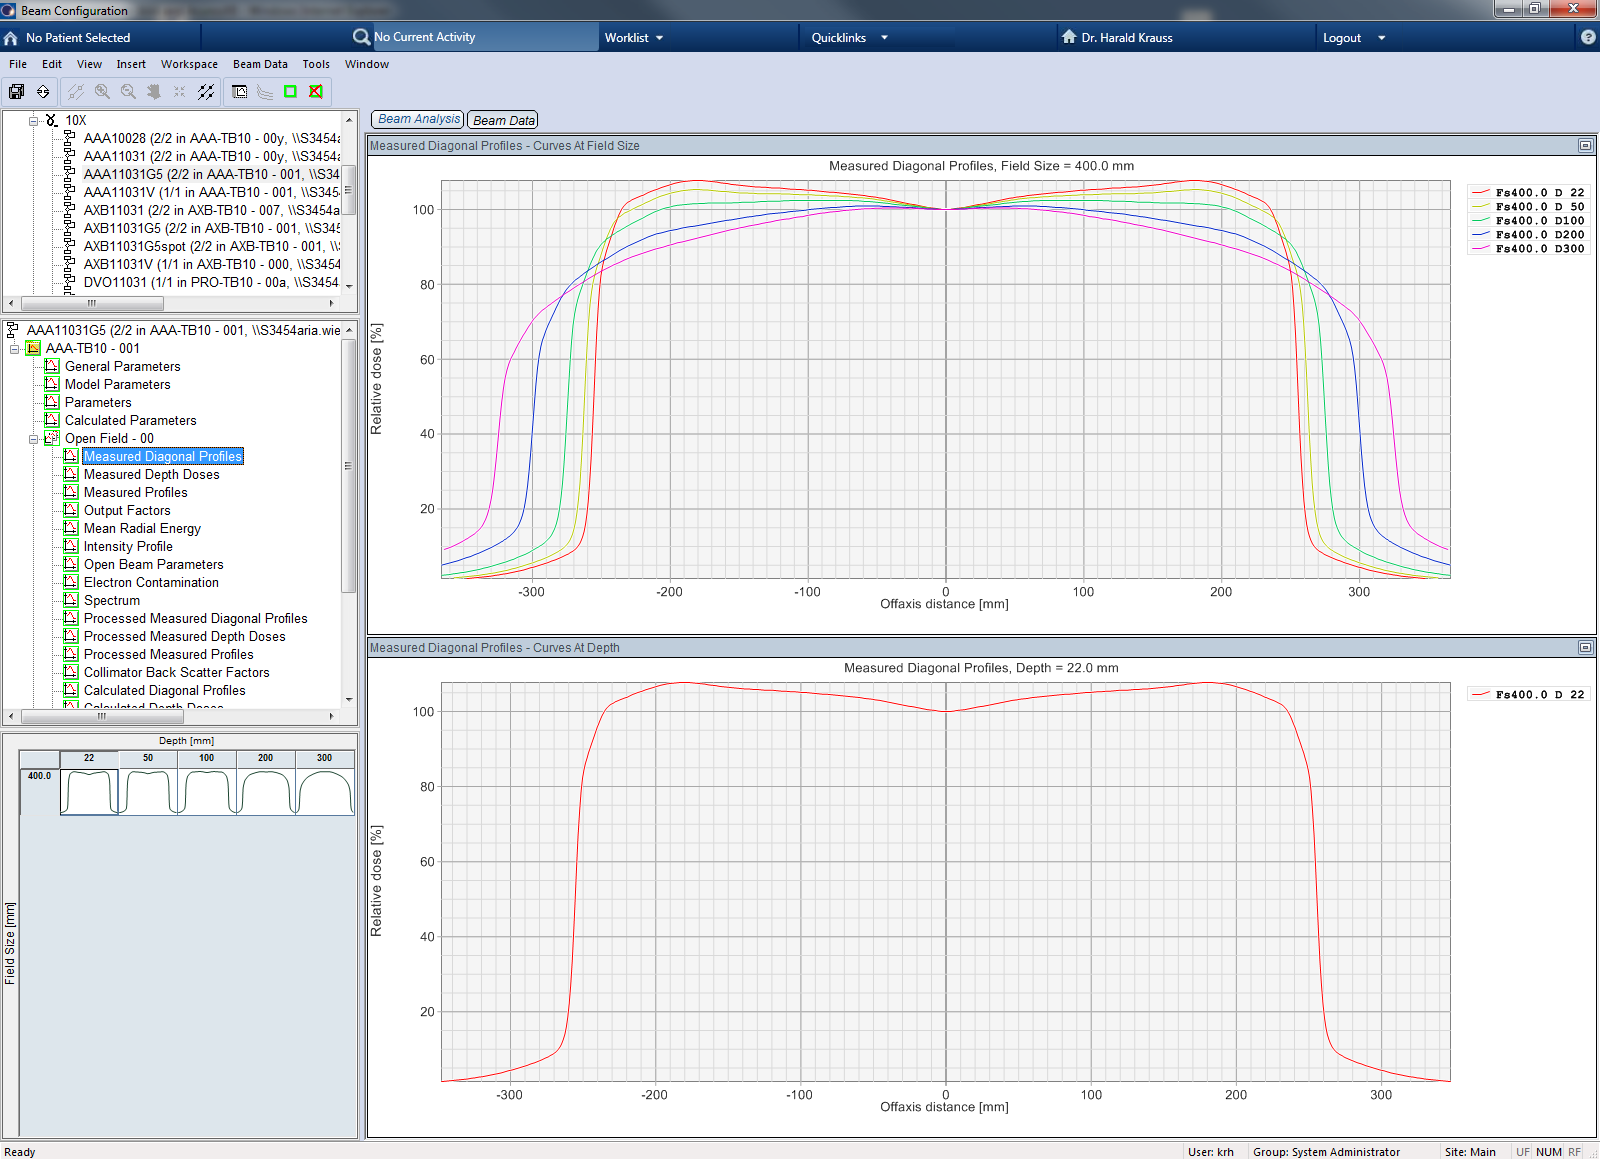
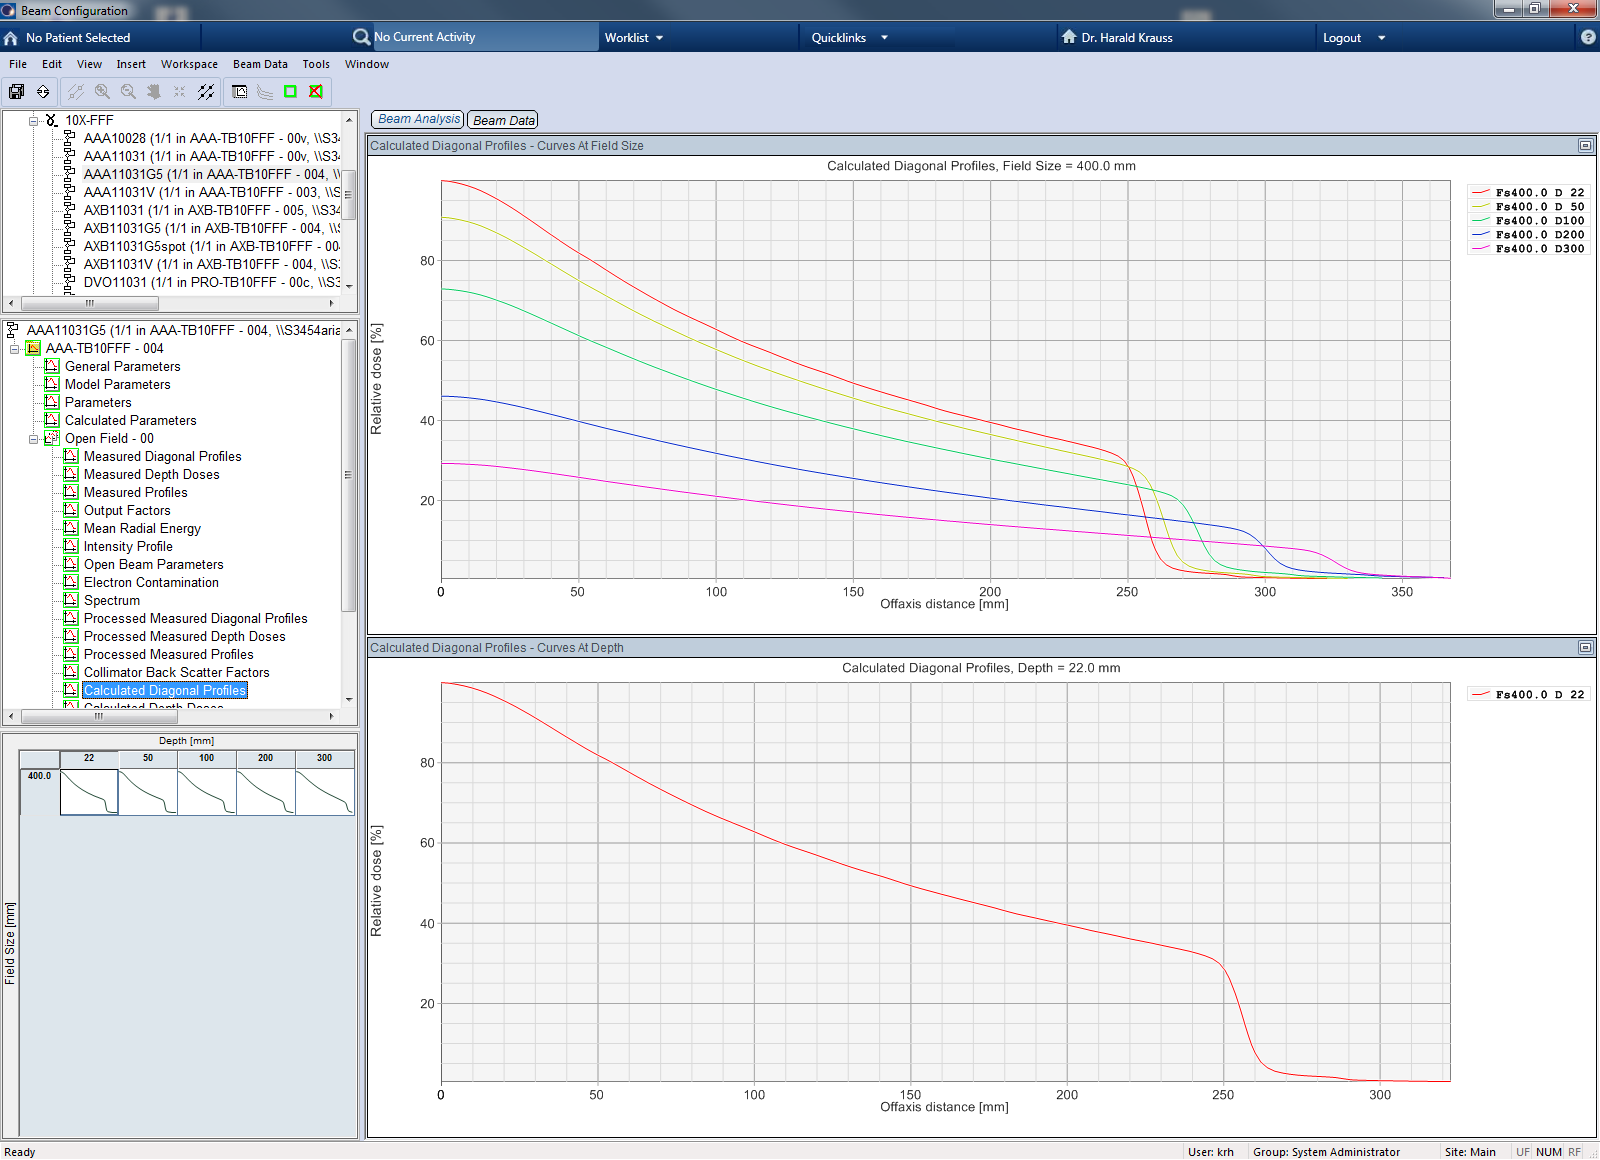
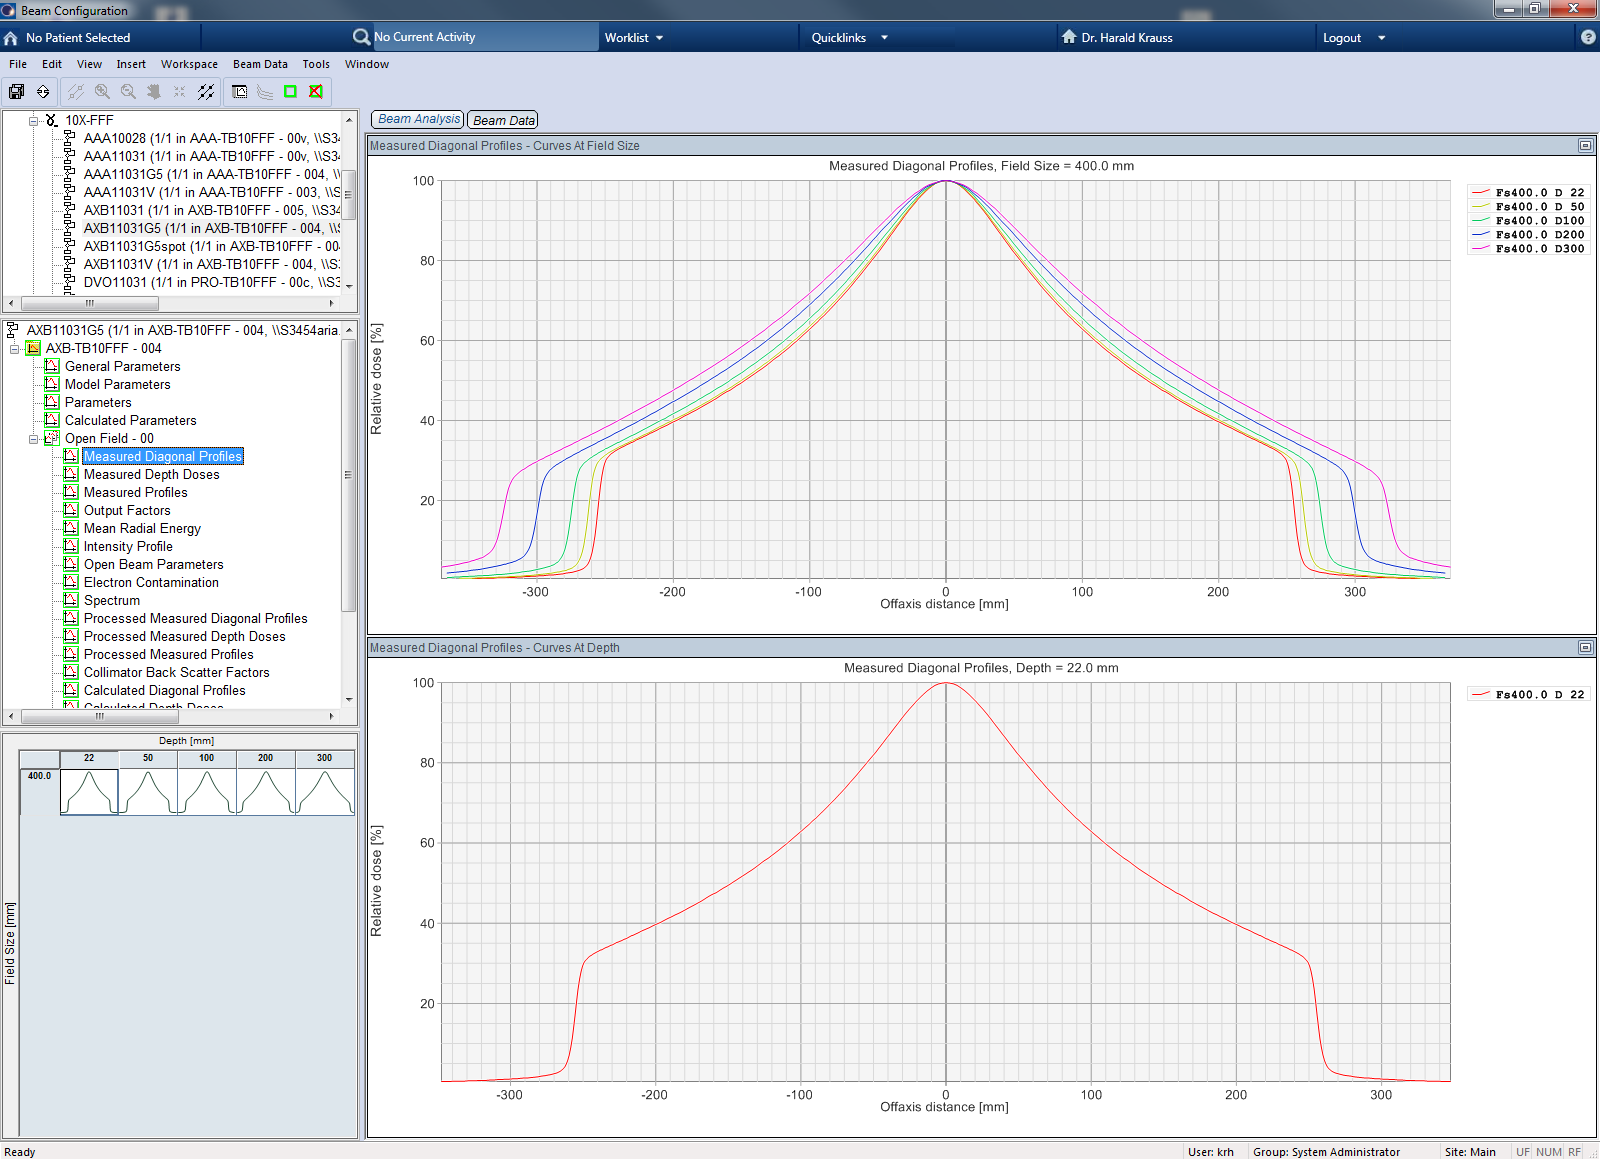
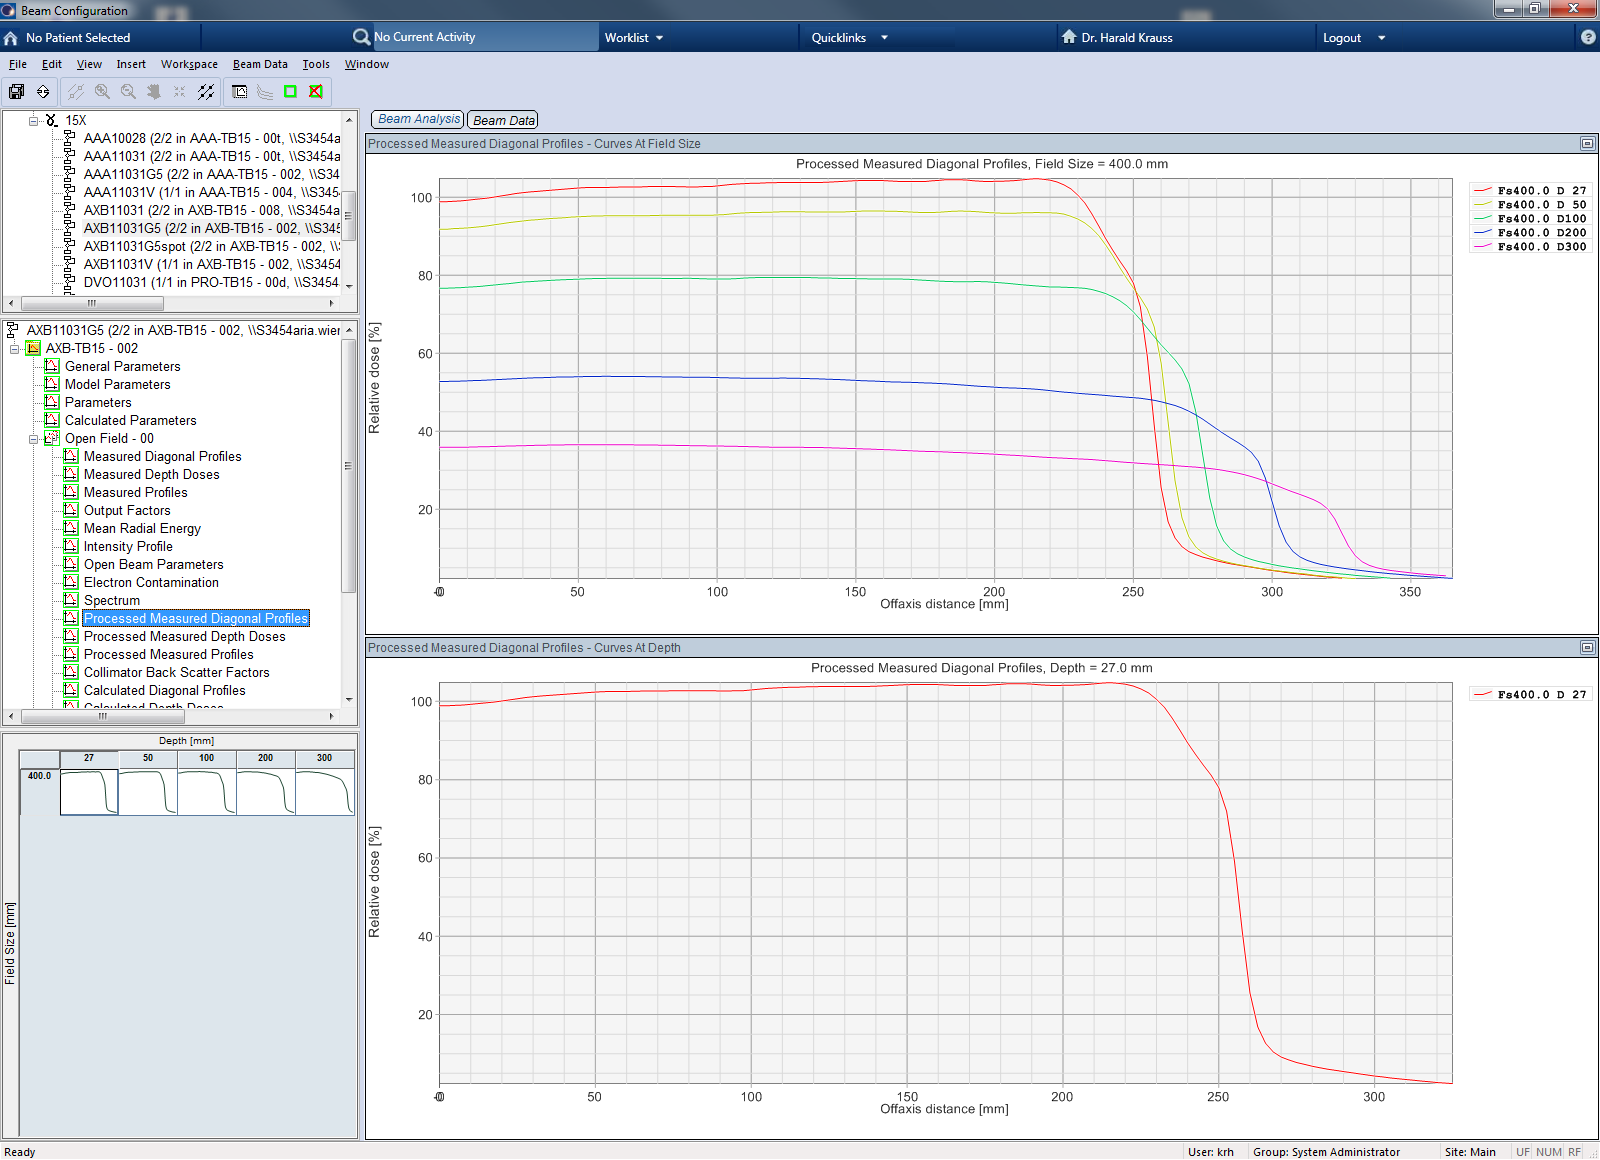
Since the diagonal profile would not fit inside the MP3 water phantom, the tank was shifted laterally, until the whole flattened region plus the left side of the beam profile could be scanned (extreme lateral scanning point: -366 mm), see screenshot:

The curves were mirrored (which gave a full, symmetrized profile) before TPS formatting. By shifting the phantom just as much as necessary, small asymmetries in the beam cancelled out when the mirroring was done. If only a halfsided profile would have been scanned, such asymmetries would have gone unnoticed.
The 31010 was positioned axially. A vertical shift of 2.2 mm upstream relative to the chamber tip was found to give the same 10 x 10 PDD as with radial chamber setup.
Scan Settings
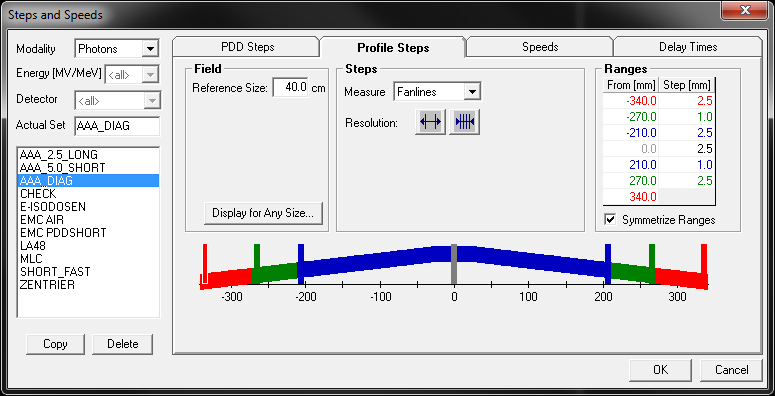
The nominal field size as entered into MEPHYSTO software was 40 x 40 cm, but the collimator rotation was not entered (this would give whong file headers during TPS formatting). Therefore, the finer 1 mm step size of the penumbra region had to be moved to the correct position by other means. This was done by defining a separate "Steps and speeds" setting for the diagonal profiles, with 40 x 40 cm as the reference field size:
Session Log
Diagonal profiles were measured on TDS1469 on July 22, 2013. Chamber centering and tank levelling were checked as usual, by measuring inplane and crossplane profiles in two depths. A 10 x 10 cm field was chosen, since this field size is more similar to the 40 x 40 cm target field size than a 2 x 2 cm field.
The collimator was then rotated to 45°, and the beam was scanned in the crossplane direction.
Post-Processing
An extra data point was added at -370 mm to the profile at 300 mm depth. Then the diagonal profiles were symmetrized and smoothed in the plateau region.
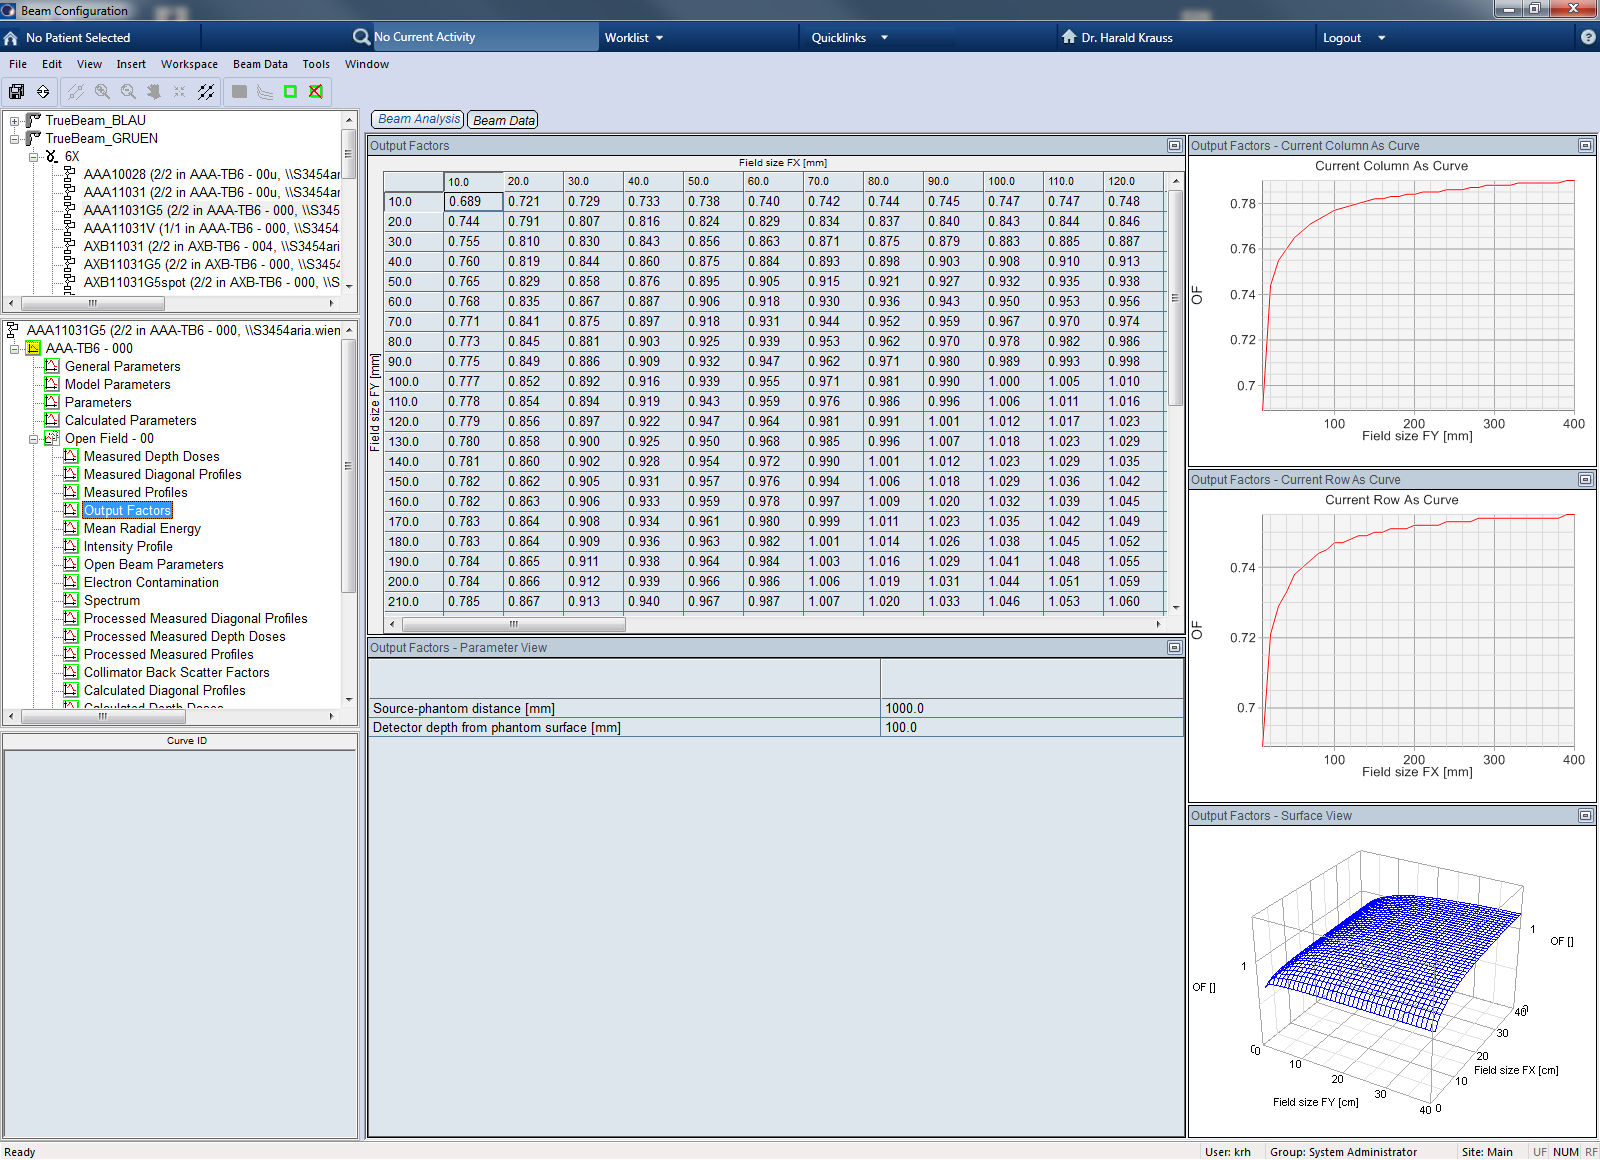
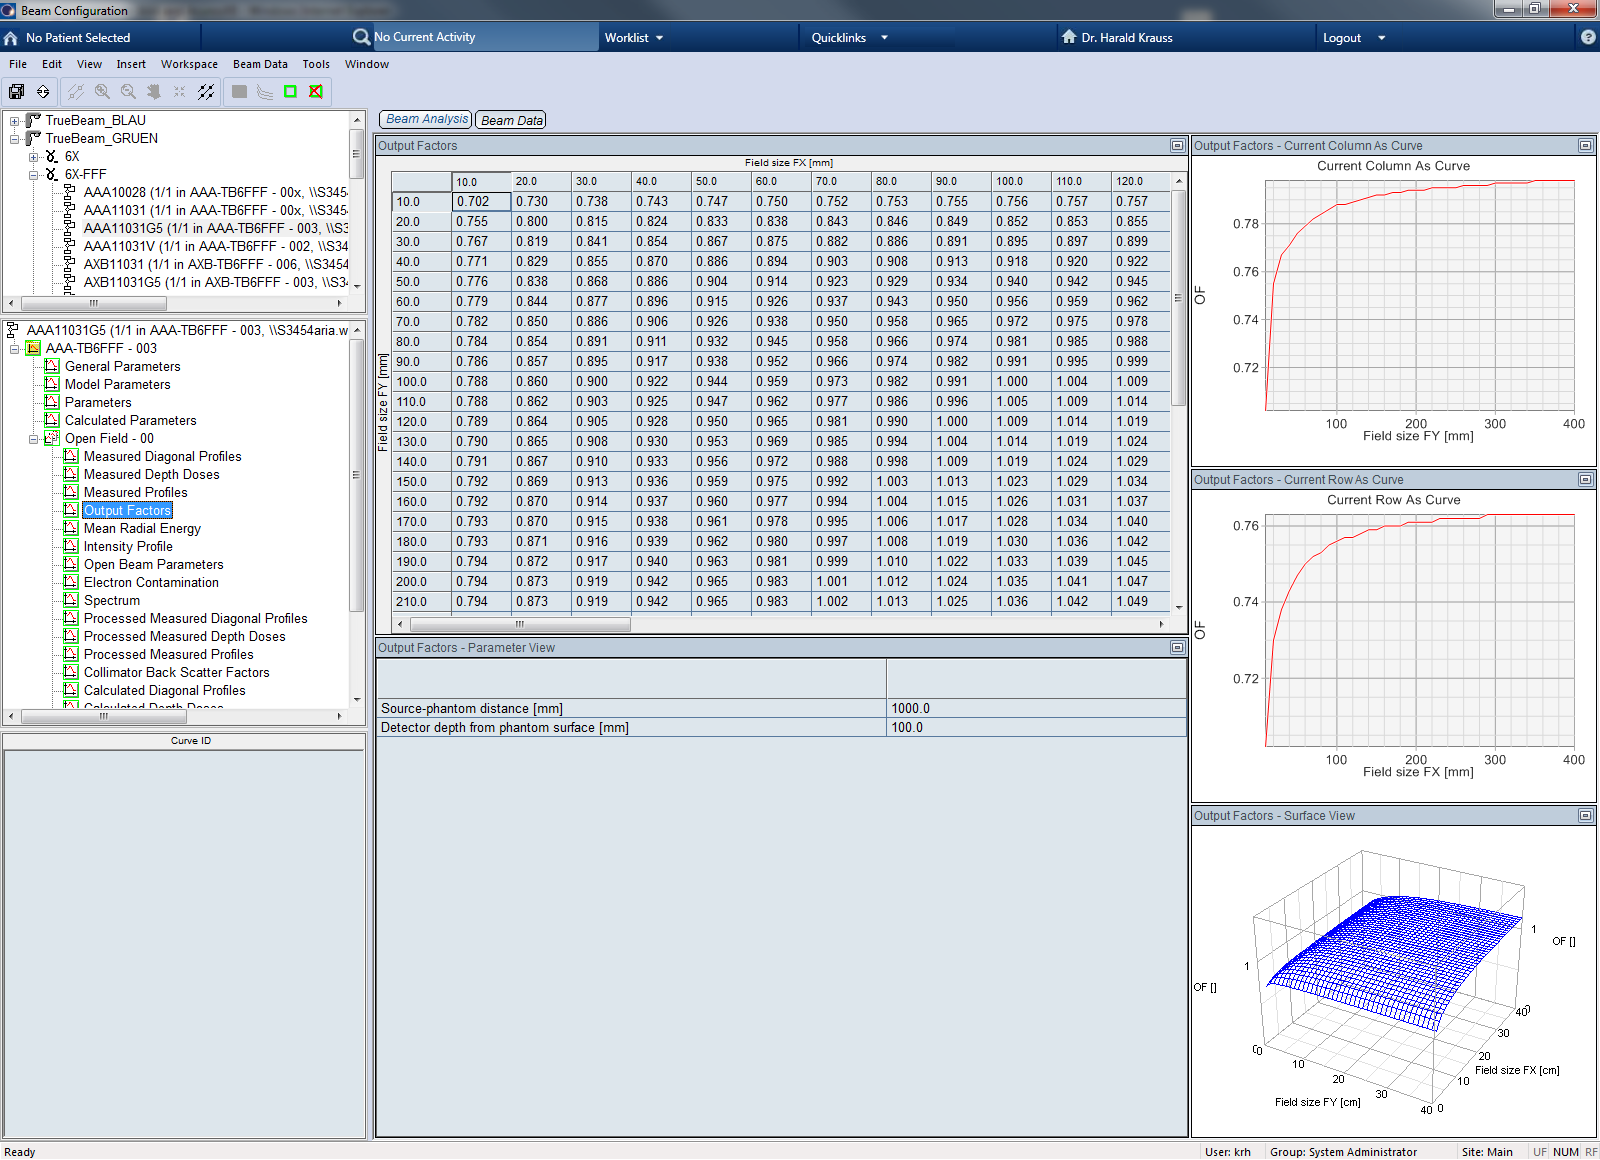
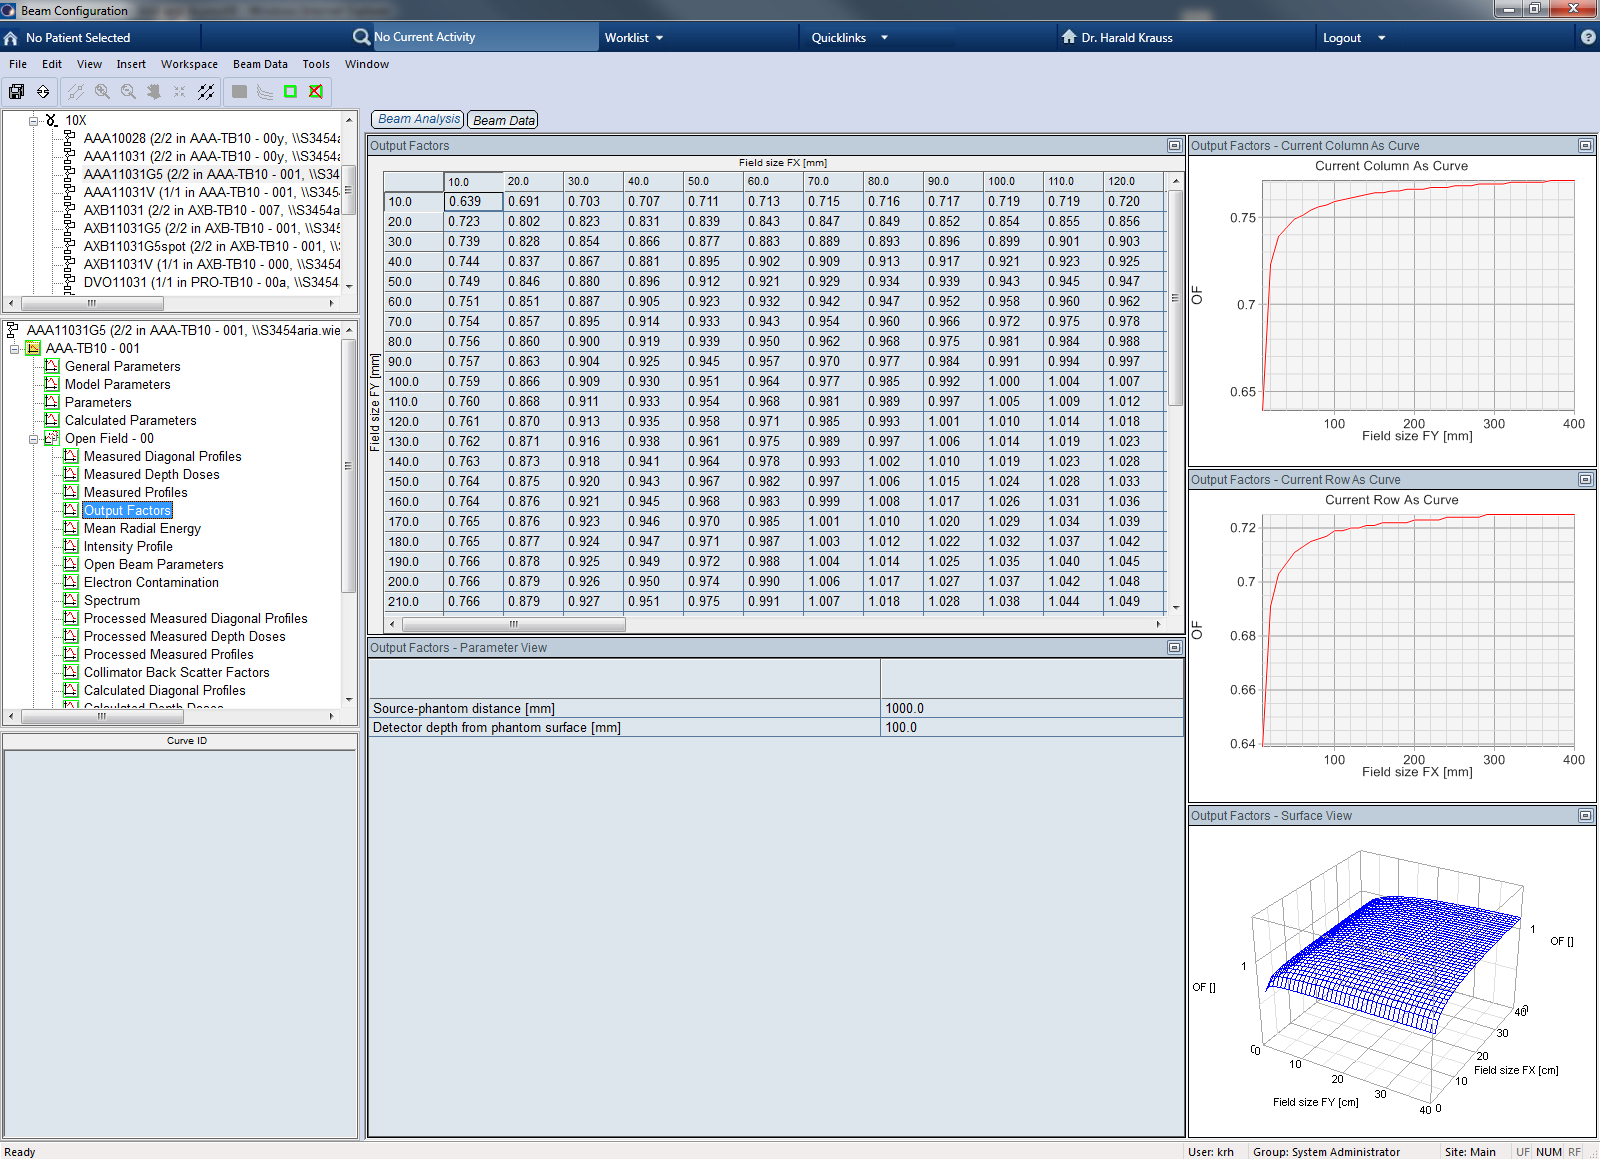
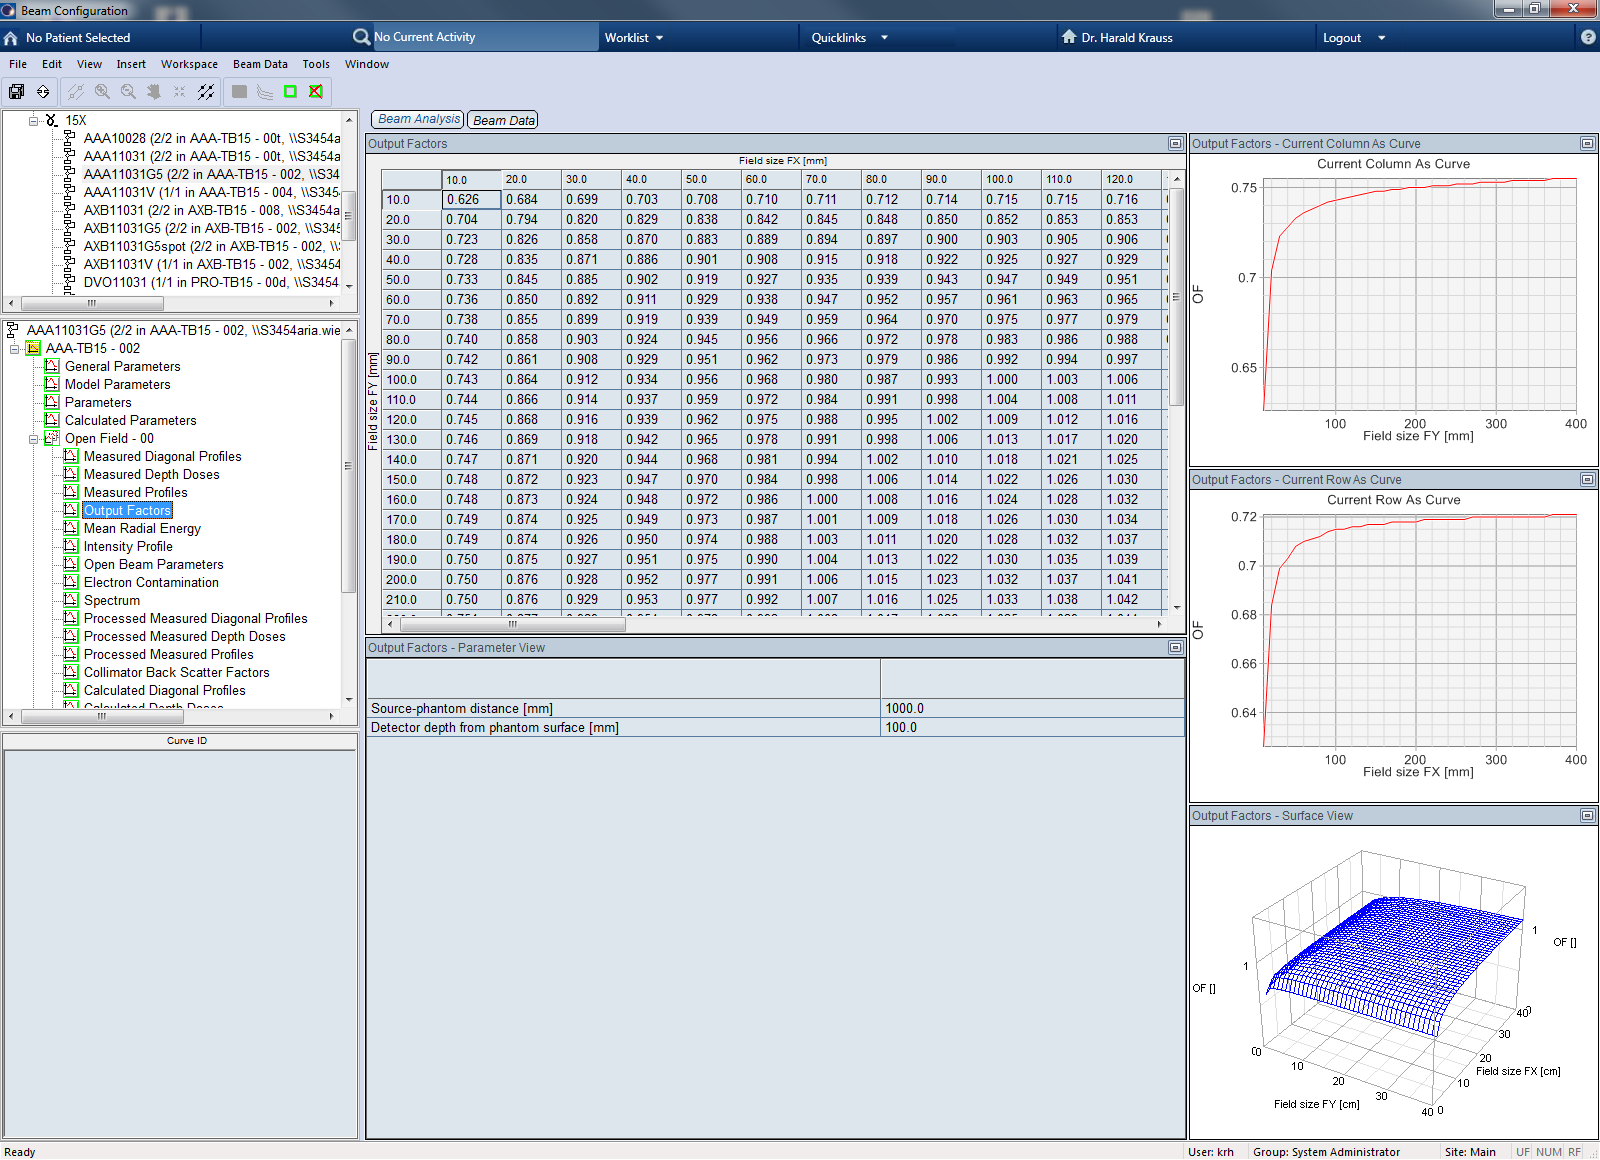
Output Factors
Output factors were measured with the Electron diode PTW TM60012 S/N 206 ("small fields") and the thimble chamber PTW TM31002 S/N 367 ("large fields").
Chamber and Phantom Setup
A depth of 10 cm was selected for all output factor measurements. The Trufix system was used for detector setup.
Both detectors were used in the axial orientation, to minimize stem and cable effects. For the 31002 chamber, a shift of 2.5 mm upstream was determined relative to the chamber tip.
Session Log
Measurements were performed on TDS1275 from Sept 3 - 5, 2012.
Output factors were measured from 1 x 1 cm to 40 x 40 cm, using two types of detectors. Small fields (where at least one field dimension is smaller than 4 cm) were measured with the diode. Larger fields were measured with the ionization chamber. According to this definition, a 3 x 40 cm field still belongs to the "small fields", whereas a 5 x 5 cm field is a "large field".
The 4 x 4 field itself ("SRF - small reference field") was measured with both detectors and used for cross calibration only:

Five to ten readings with 100 MU were taken at each field size. Dose rate was 600 MU/min for the flattend and 800 MU/min for the unflattened beams. After 10 field sizes were completed the reference field was remeasured to compensate long term drifts.
First the diode was mounted and the small fields were measured for all five photon energies. Then the larger fields were measured with the ionization chamber.
After setting up a new detector, it was precisely centered by measuring inplane and crossplane profiles in the selected depth of 10 cm. For the diode, a 1 x 1 cm field was used. For the thimble chamber, we used a 4 x 4 cm field for centering.
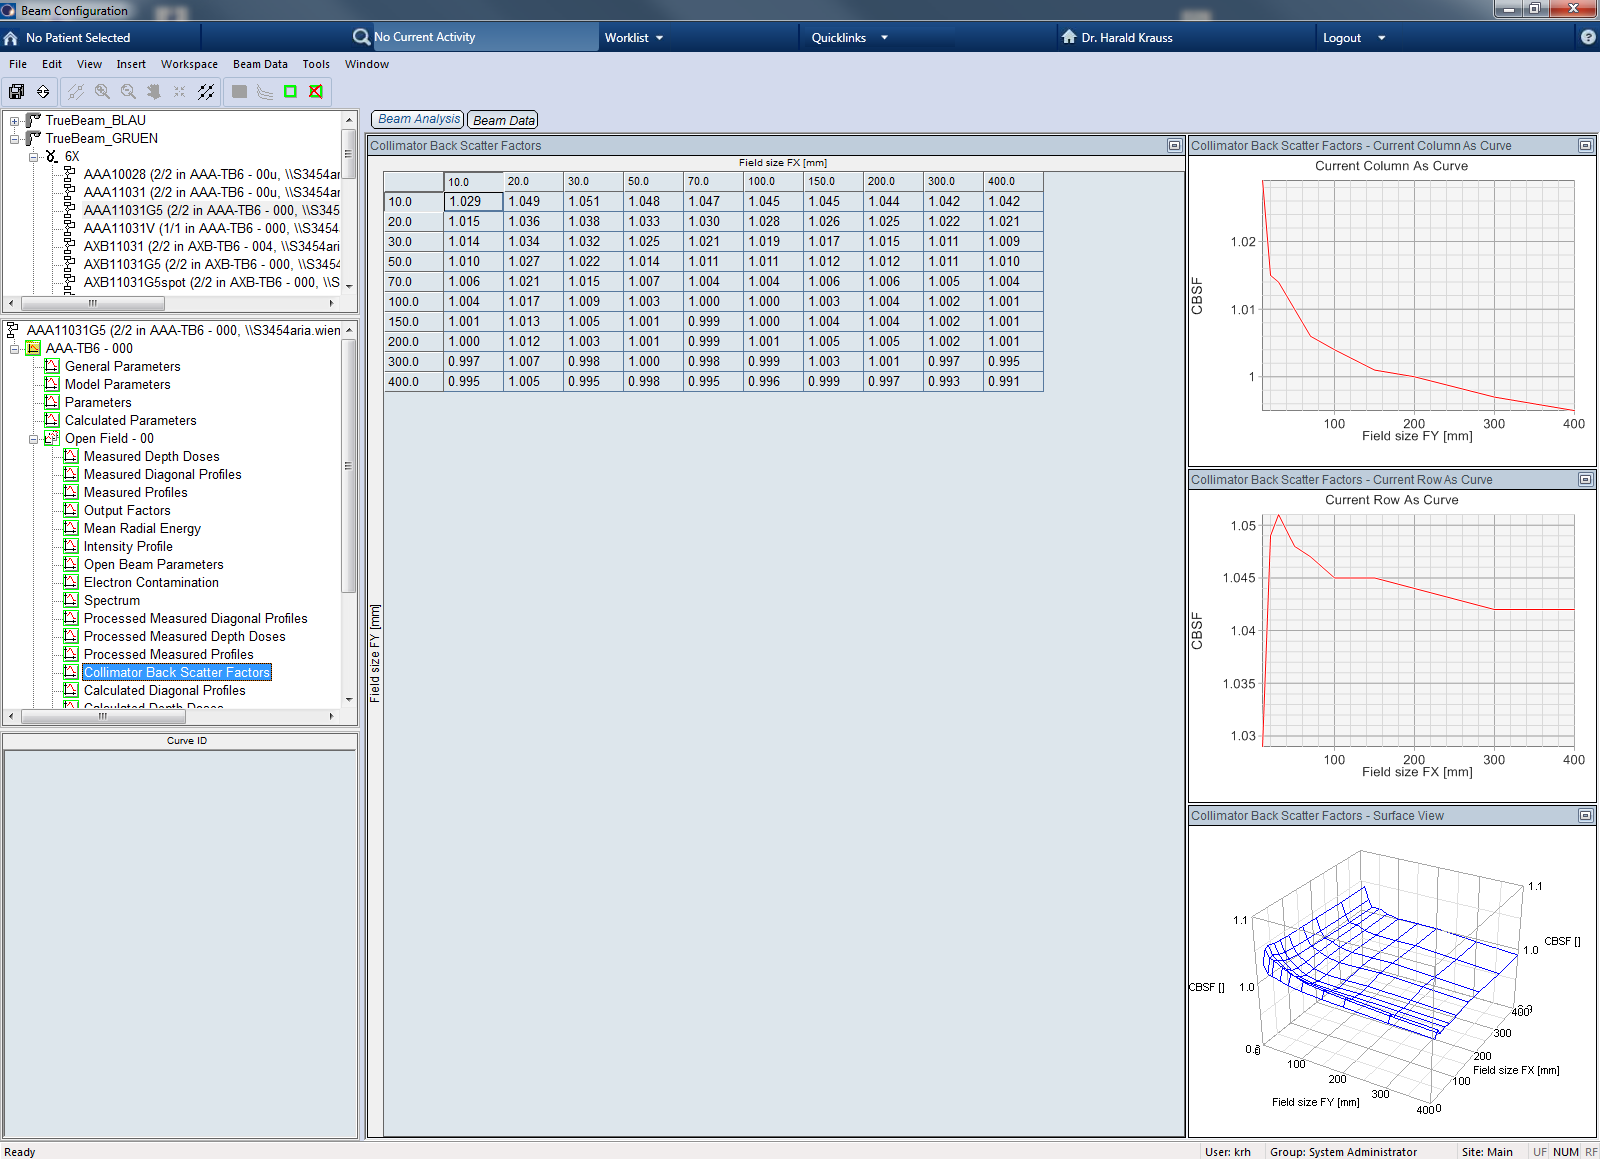
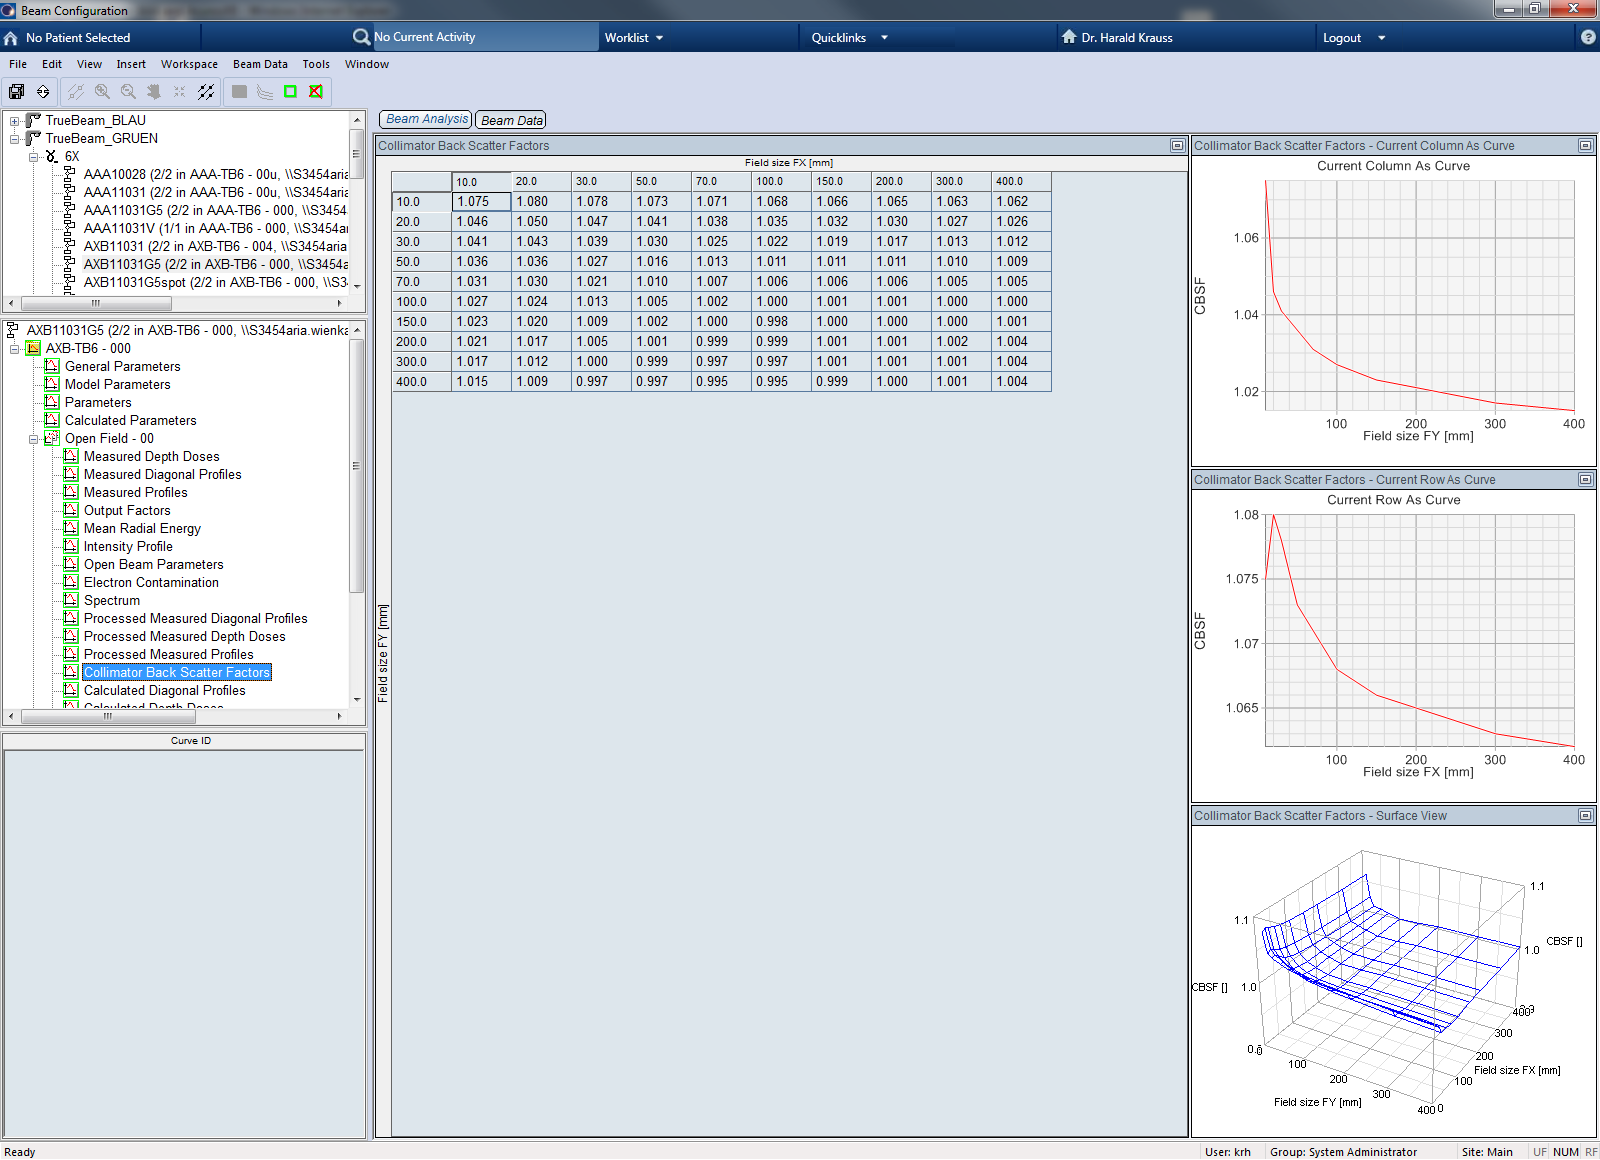
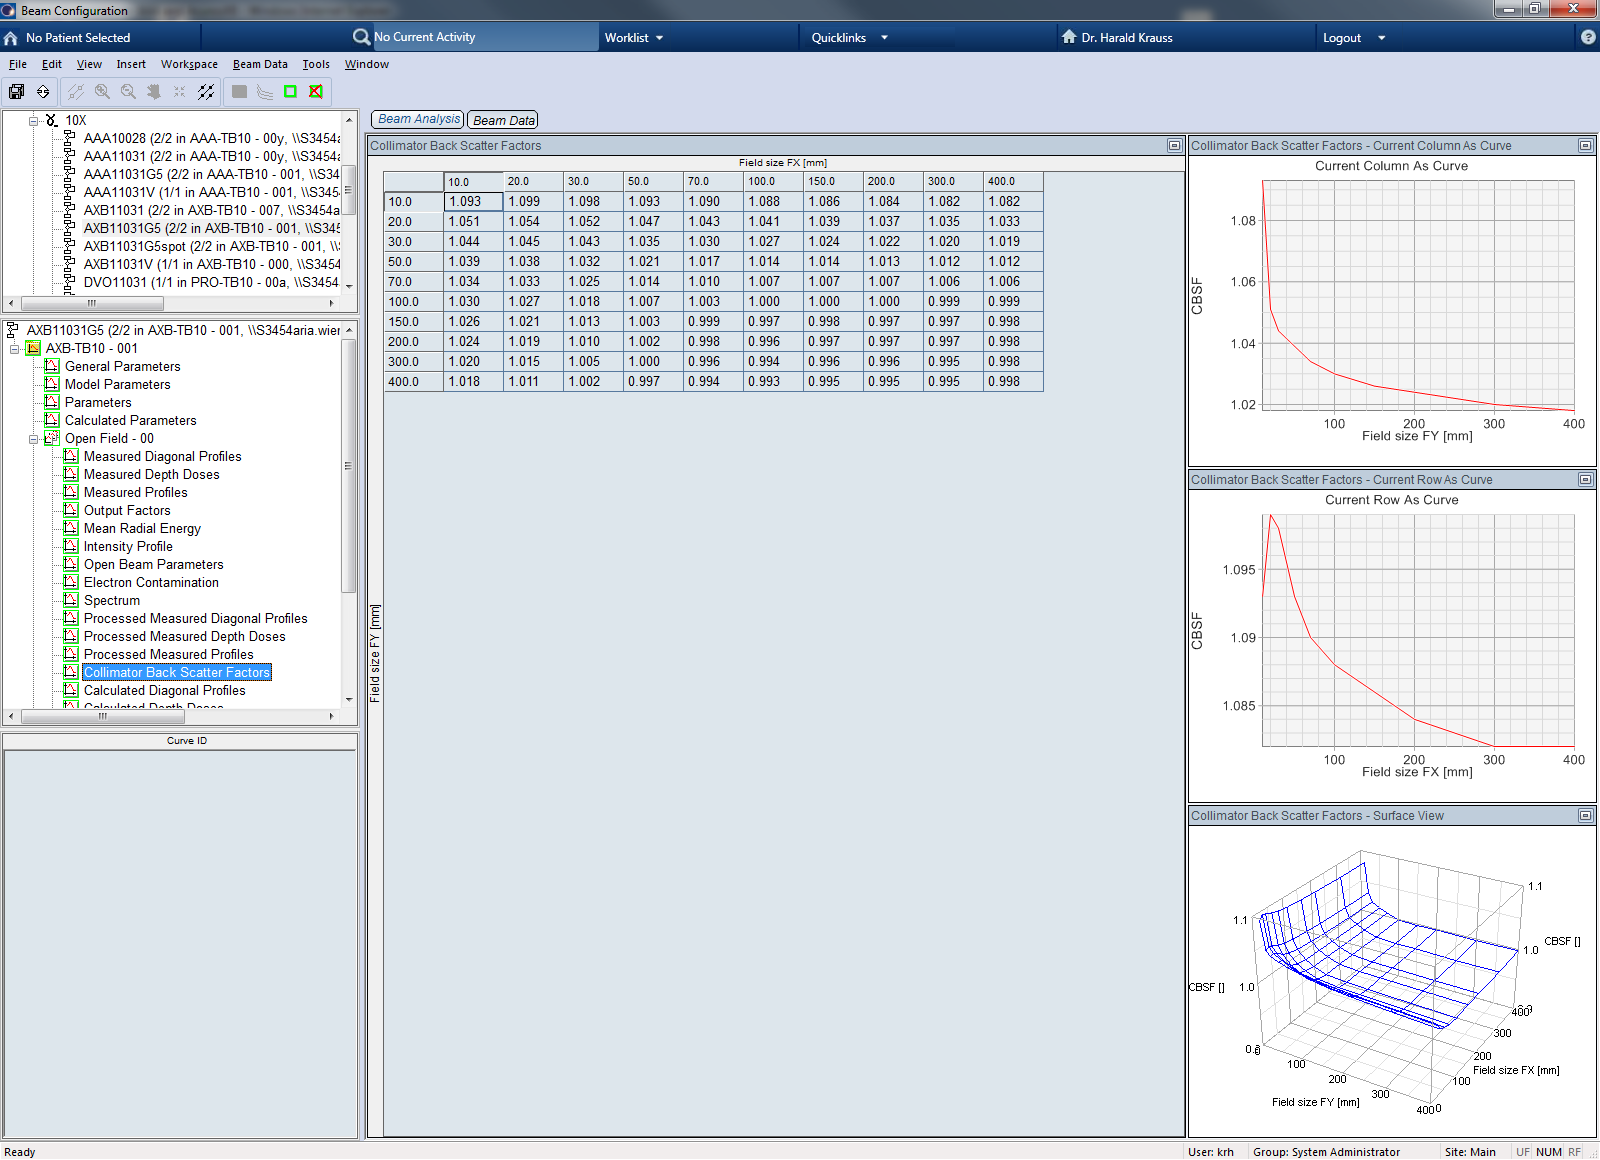
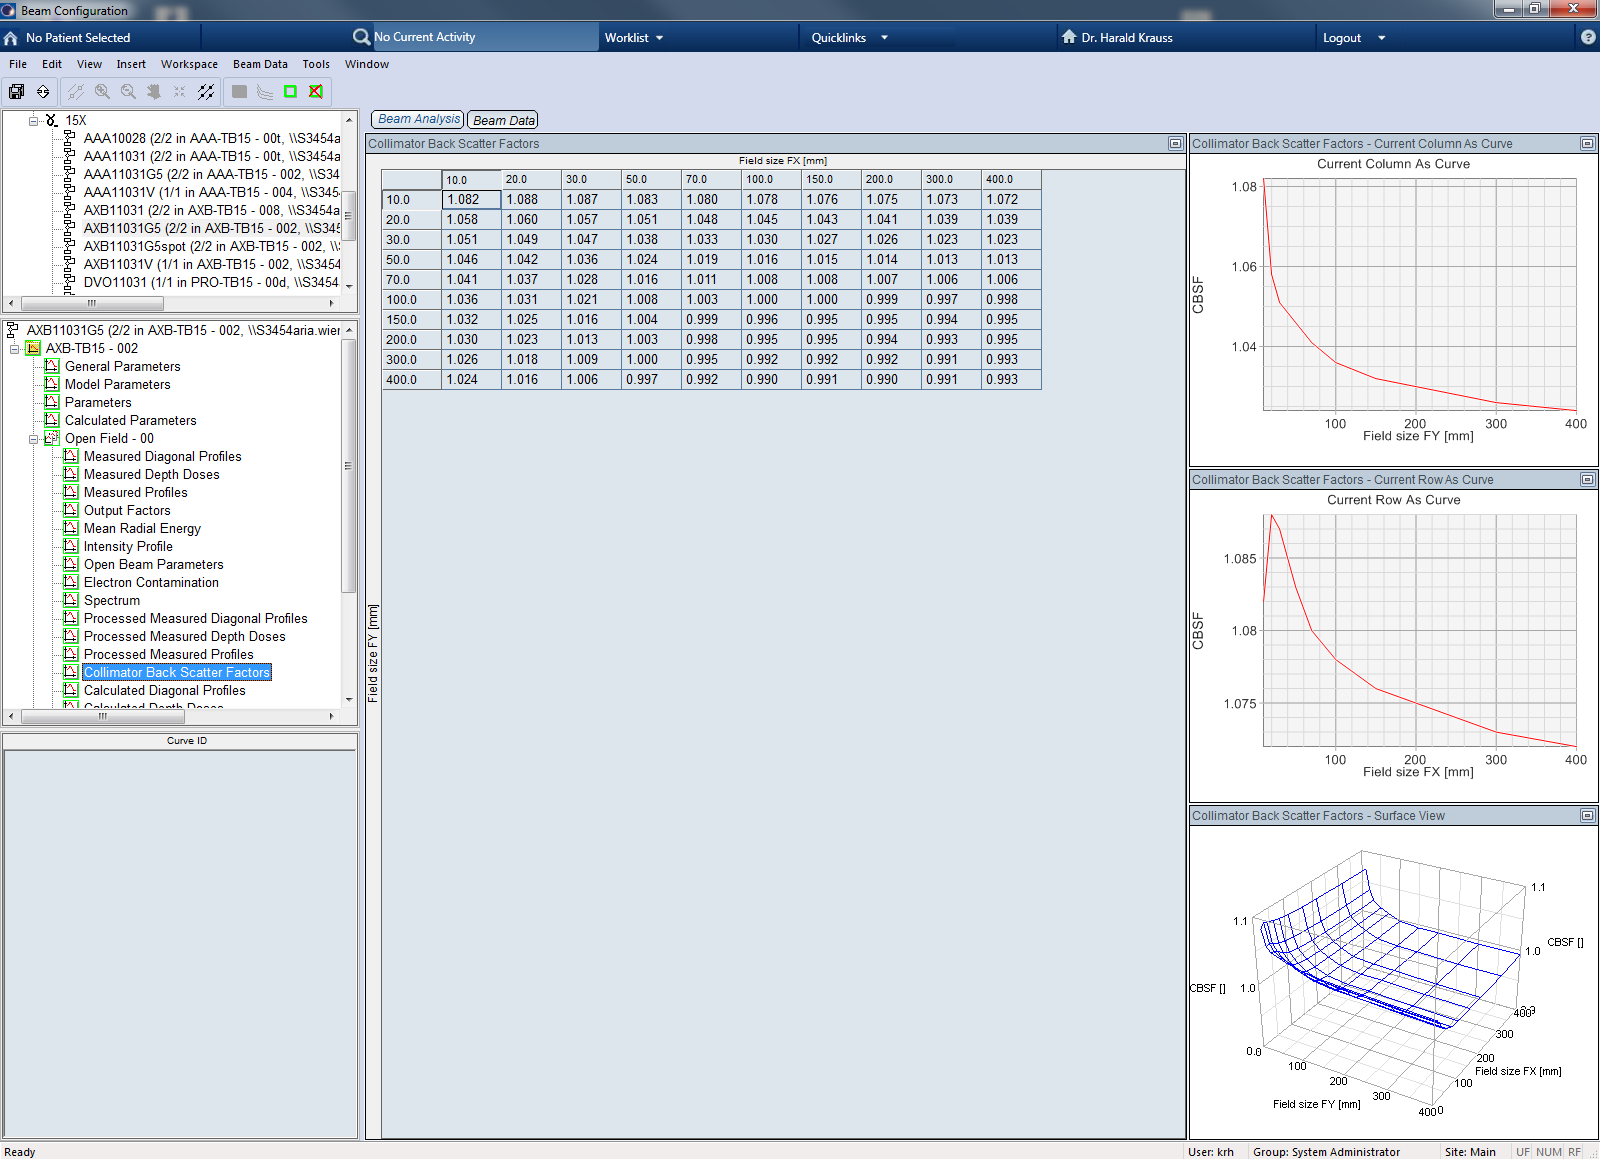
MLC Transmission and DLG
To complete the dosimetric data required by Eclipse beam modelling, we measured static MLC transmission and dosimetric leaf gap (DLG) on TDS1469, using Farmer chamber PTW TM30013, S/N 1572.
Chamber and Phantom Setup
The MP3 water phantom was set up at SSD 90 cm. The Farmer chamber was positioned at isocenter (10 cm depth) with its axis in the crossplane direction. Jaws were set to 10 x 10 cm, the collimator to 90°. So far, the setup was identical to the previous measurement on TDS1275:
Because the HD120 MLC has two different leaf types (2.5 mm in the center, 5.0 mm off-center), we wanted to get more information about the off-axis dosimetric data. While for smaller fields the central axis is clearly more important than any off-axis location, we also treat many large fields (in the context of the HD120 MLC, the term "large field" is relative: the maximum field length is 22 cm). So it makes sense to include off-axis data in the beam model as well.
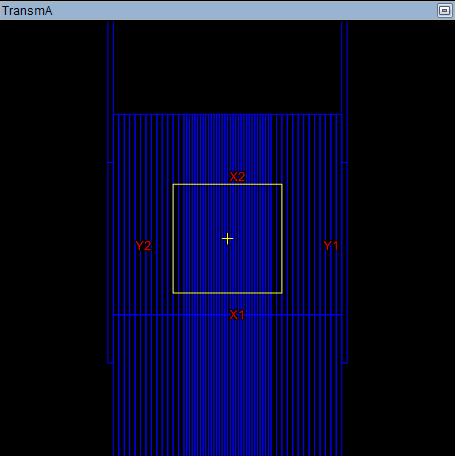
We modified the original Varian plans by shifting the 10 x 10 field to an off-axis position, where the Farmer chamber would measure under the thick leaves:
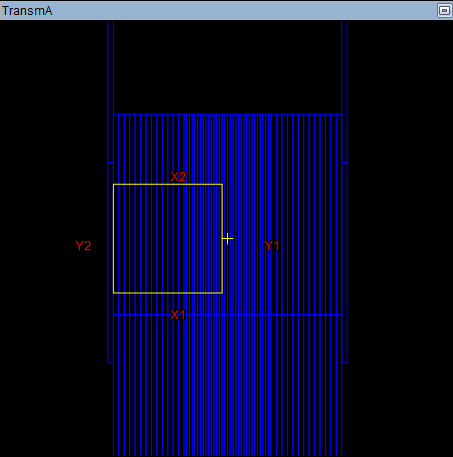
The jaws were set to Y1 = -0.5 cm, Y2 = 10.5 cm, X = 10 cm. Transmission was measured at a point 5.5 cm off-axis (center of field).
Session Log
Measurements of static MLC transmission and DLG were performed on Aug 14, 2013 for carriages A and B, both in the CAX position and off-axis. While the maximum difference between the A and B transmissions was only 0.02%, the difference between the thinner central leaves and the thicker off-axis leaves was between 0.08% and 0.12%, see table:
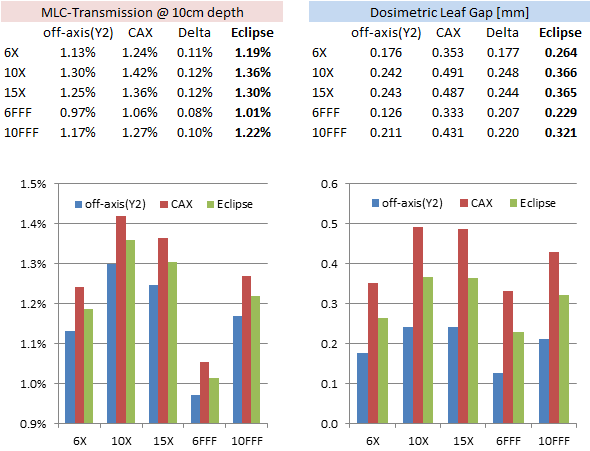
In the table, each off-axis and CAX transmission value is an average of A and B. All transmission values were corrected for saturation.
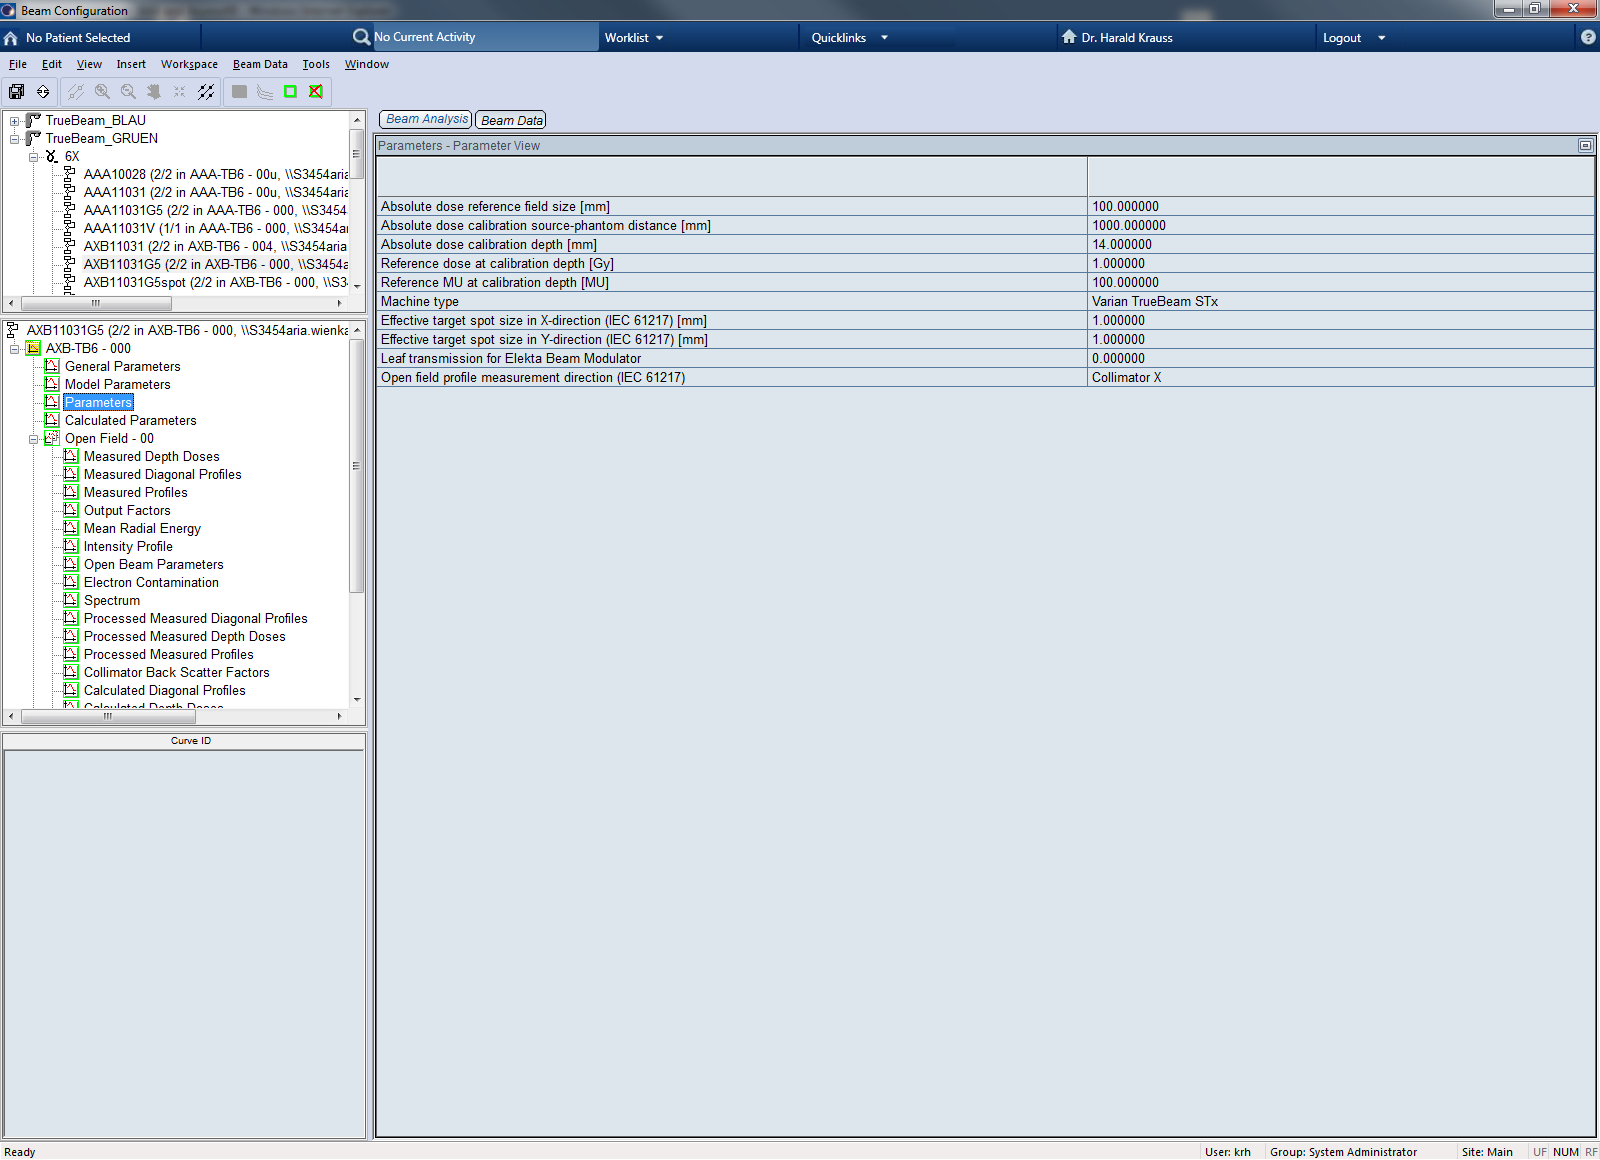
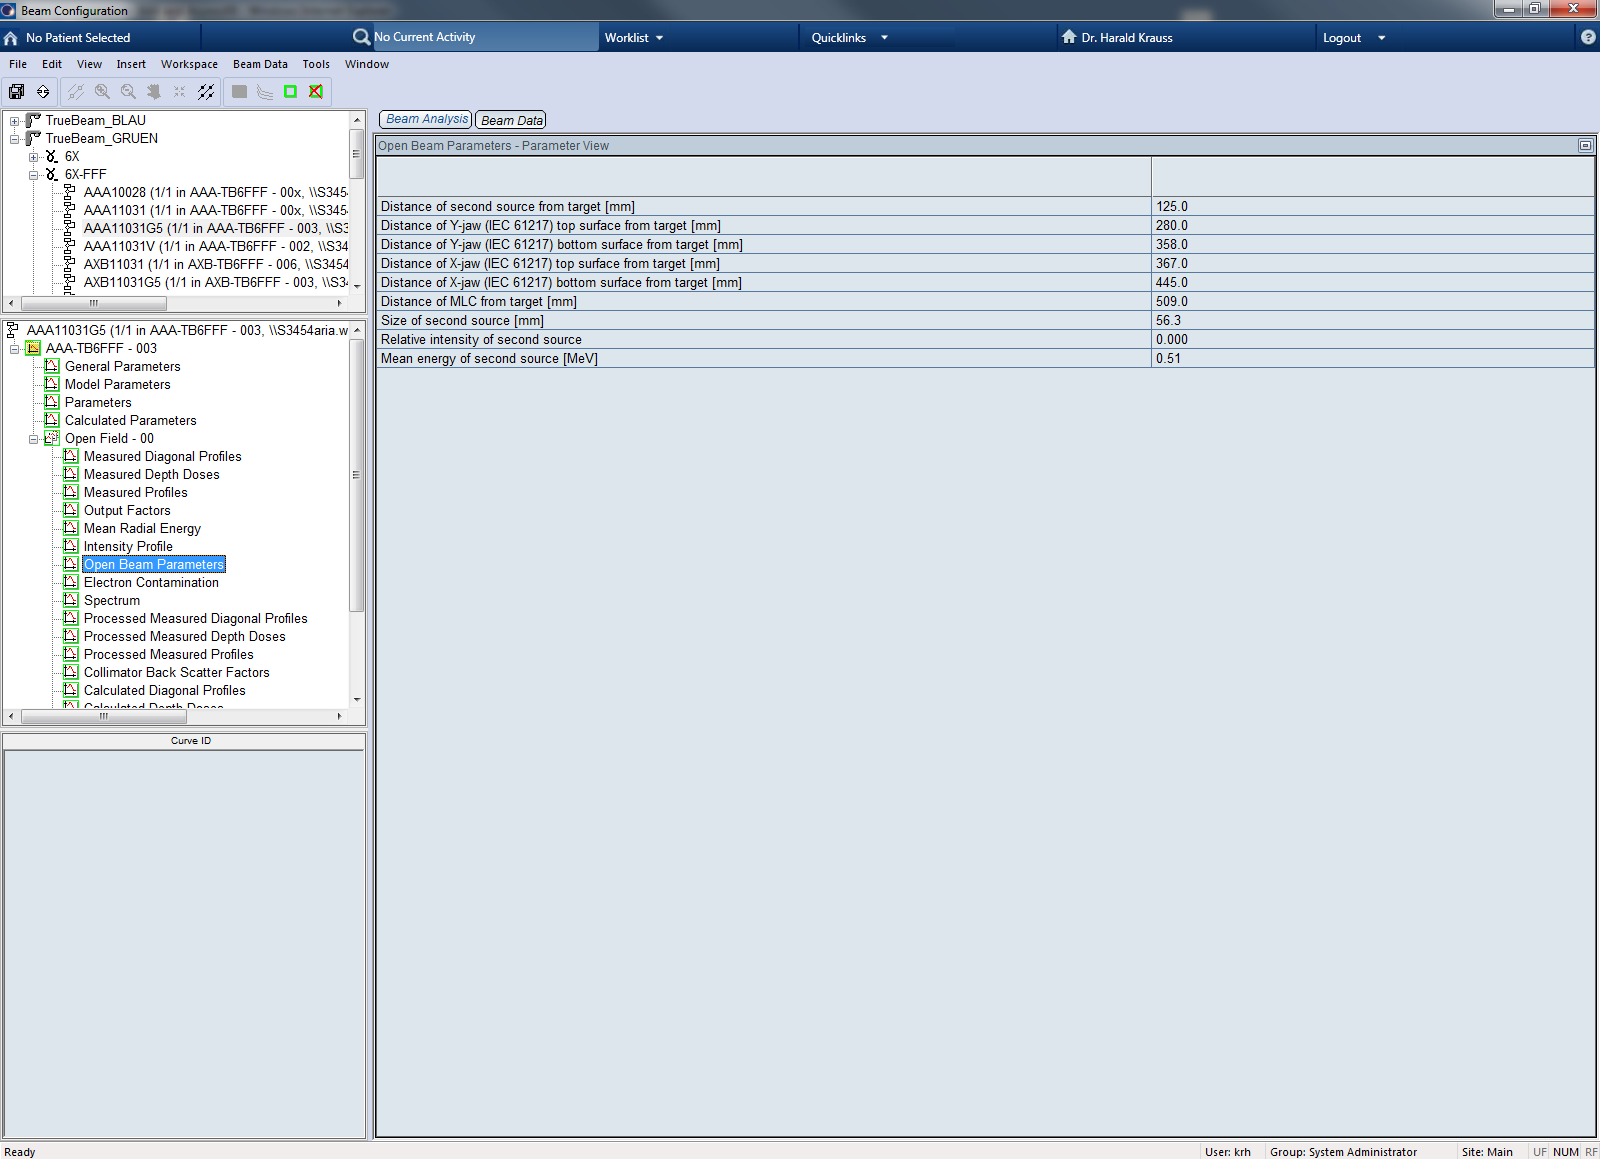
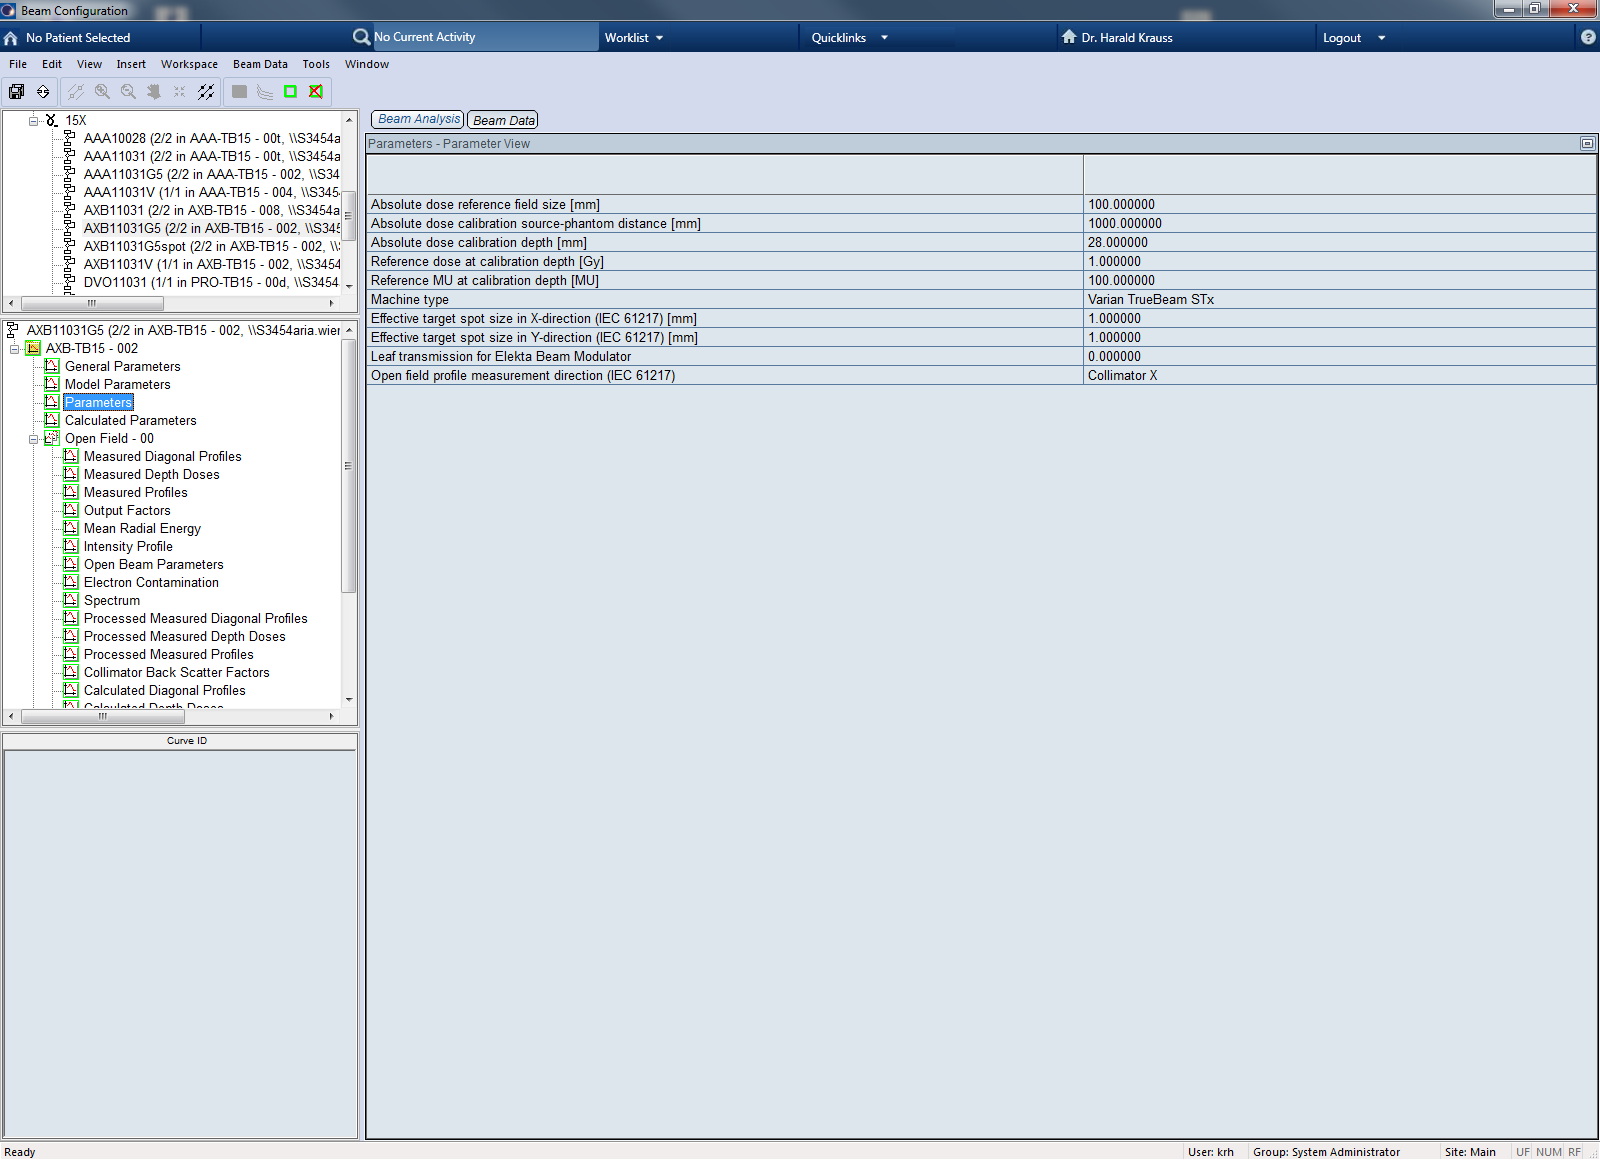
The average of the off-axis and CAX values (for both MLC transmission and DLG) was entered in Eclipse Beam Configuration > Dosimetric Data. This data replaces tha values presented earlier.
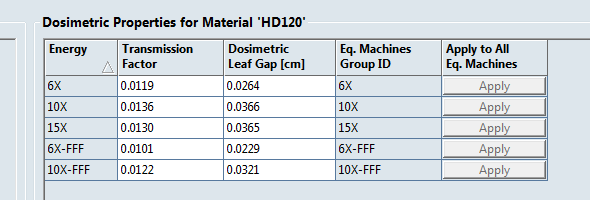
Update, January 2014: In ARIA13, Dosimetric Data have moved from Eclipse Beam Configuration to RT Administration. Data for all energies are now presented in a single table, which gives better overview:
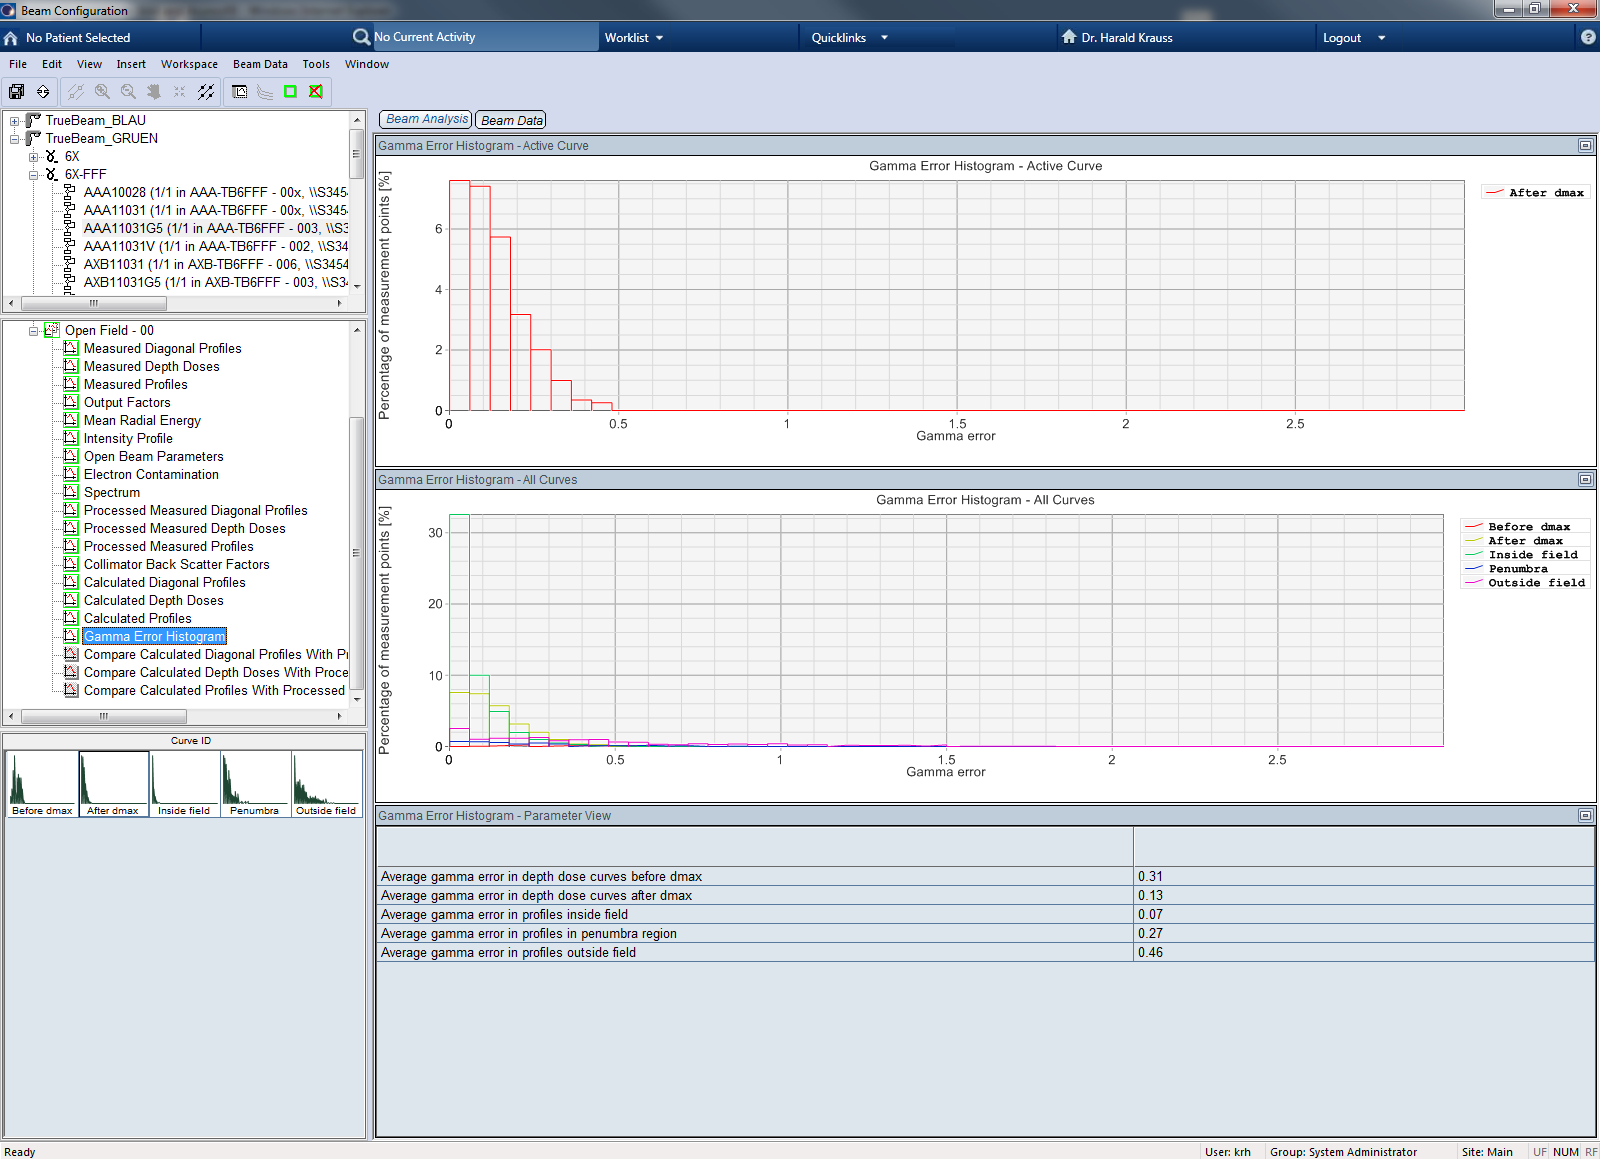
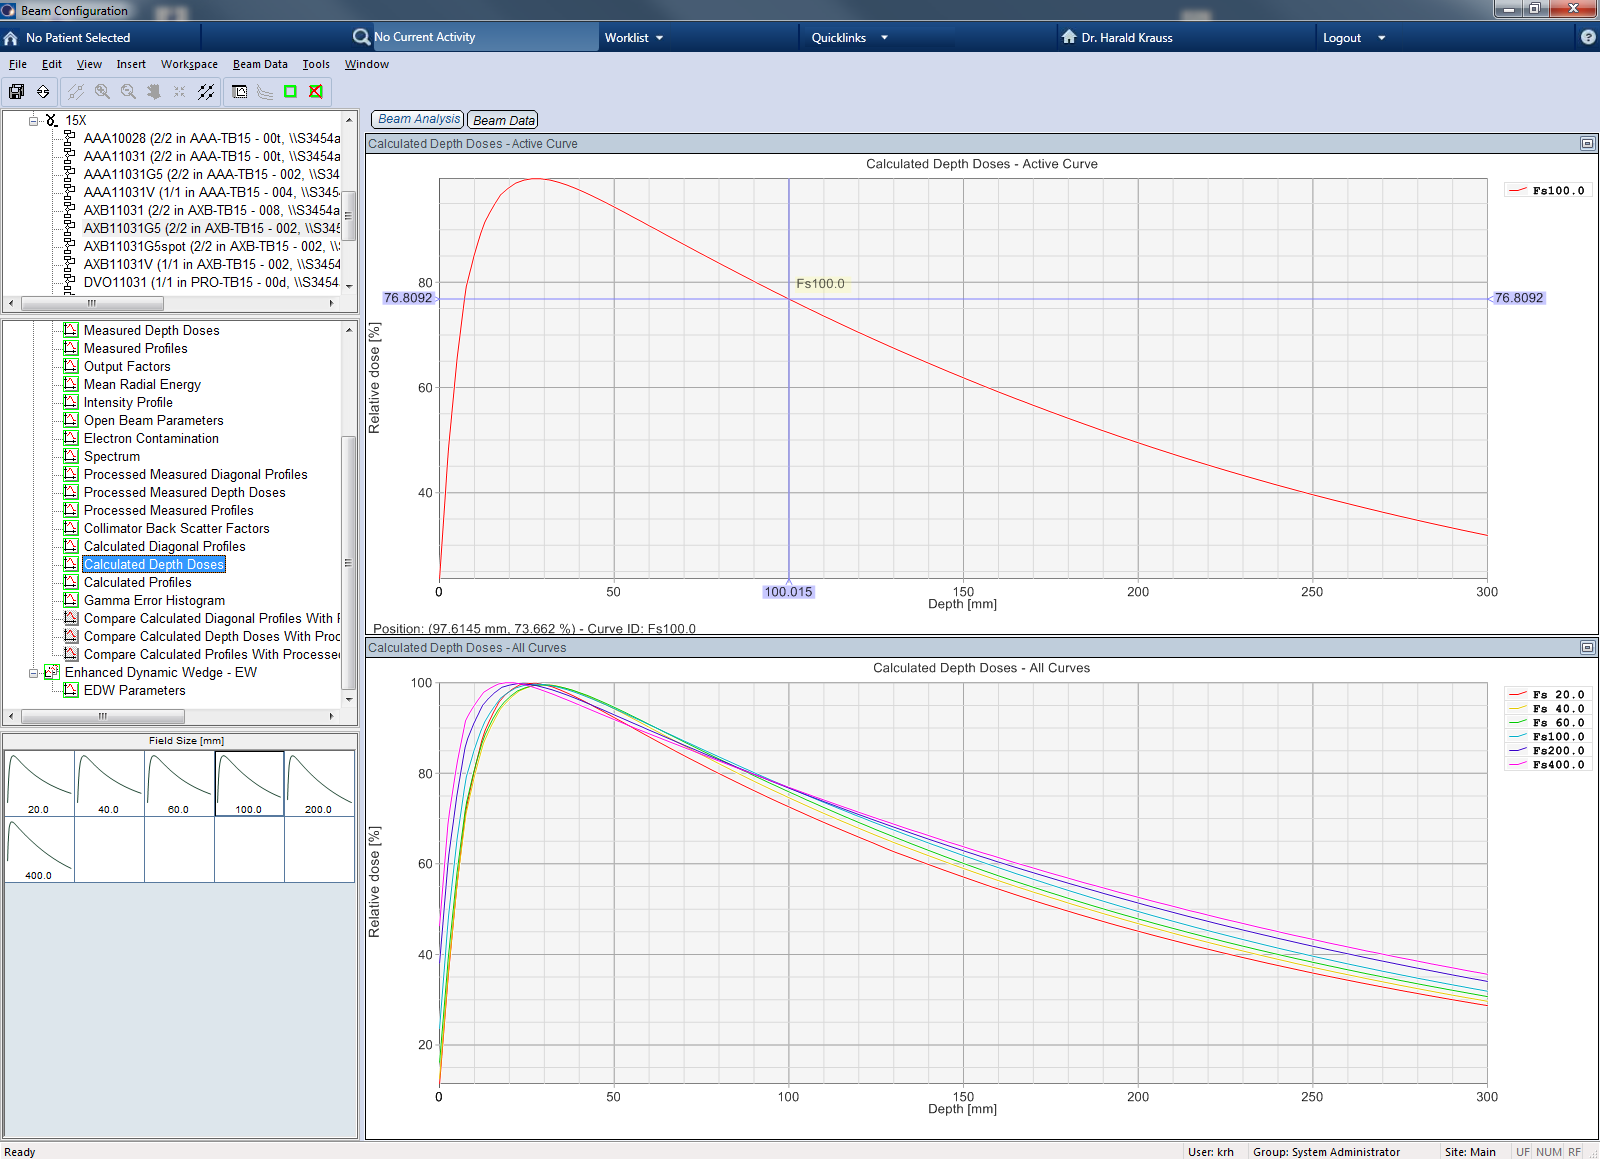
Discussion
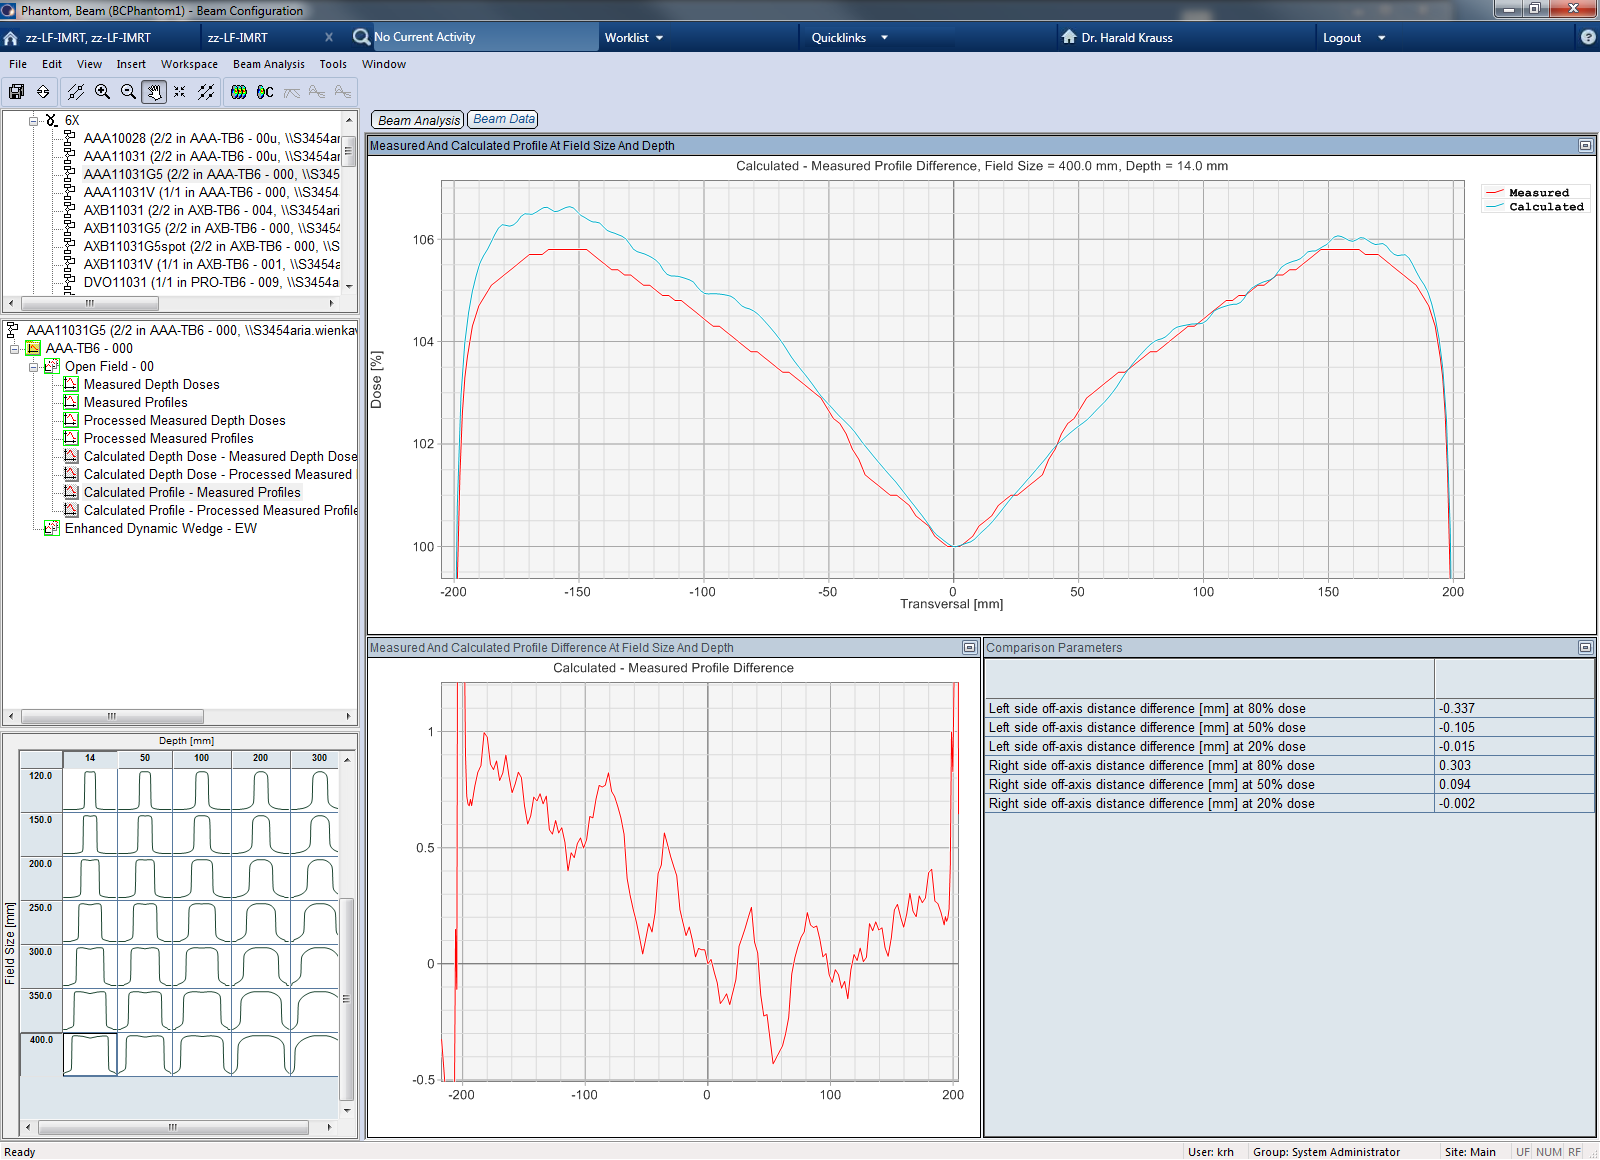
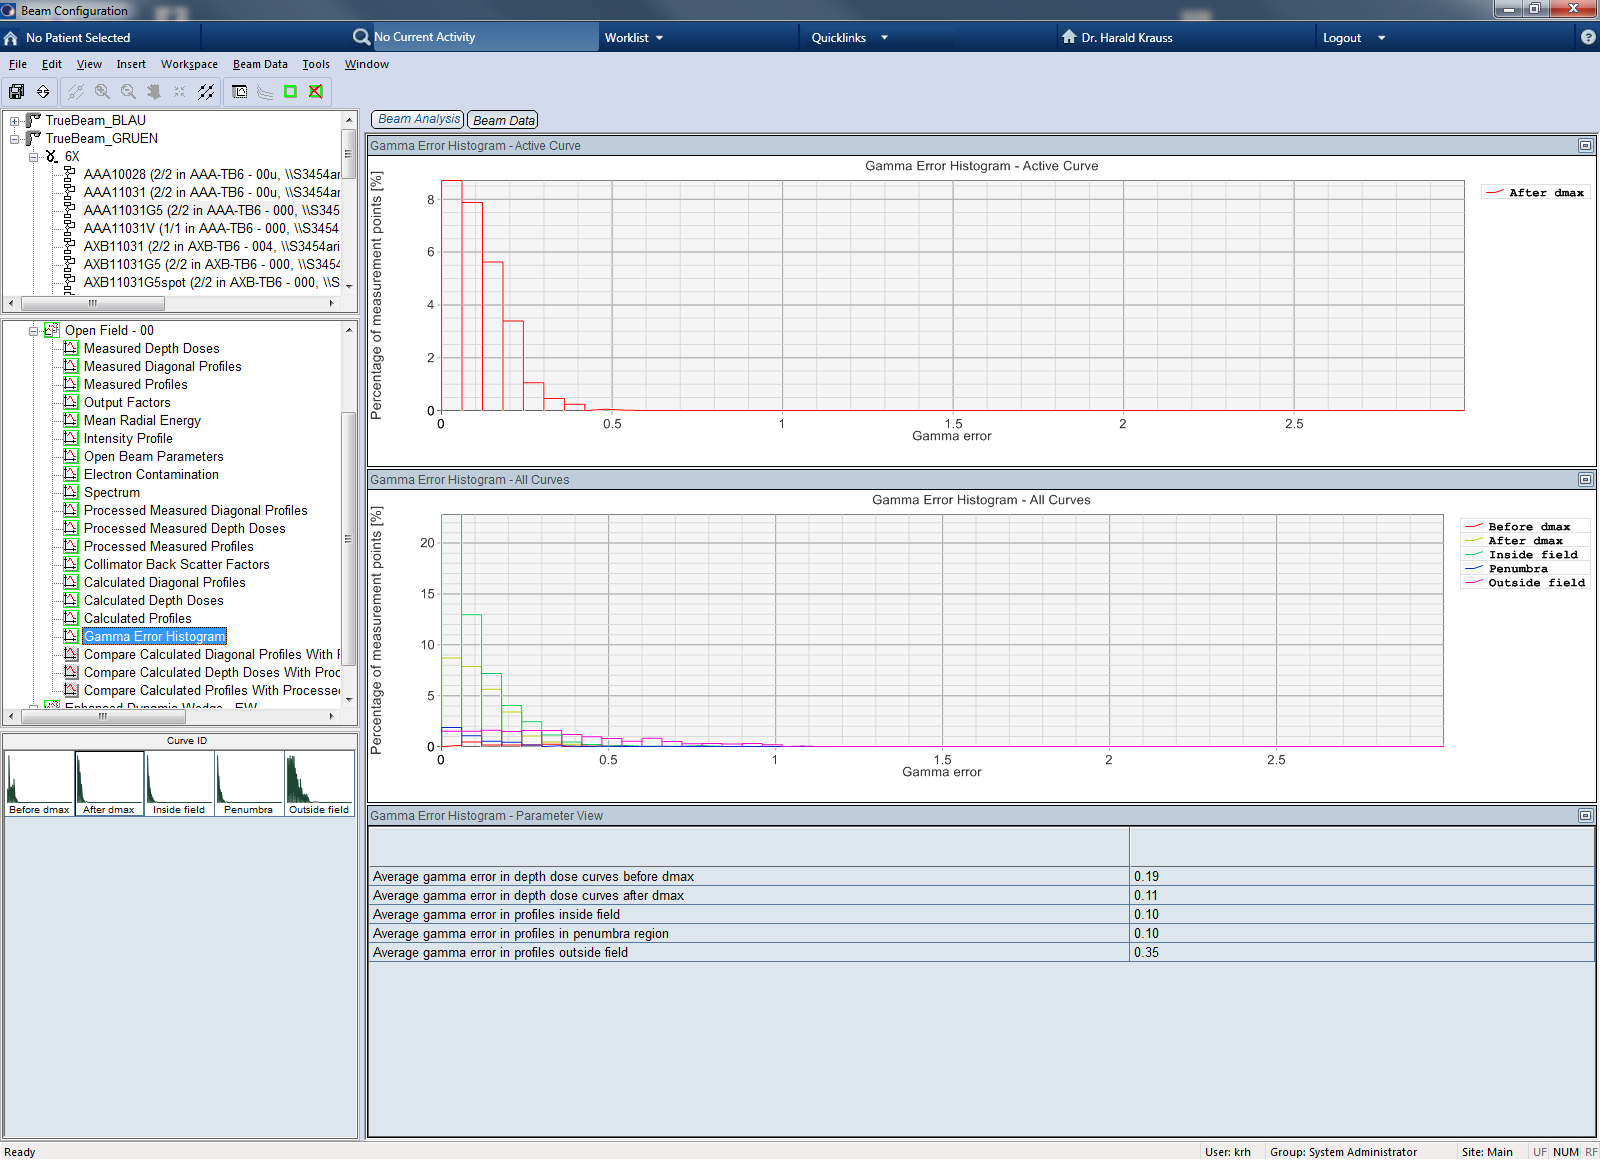
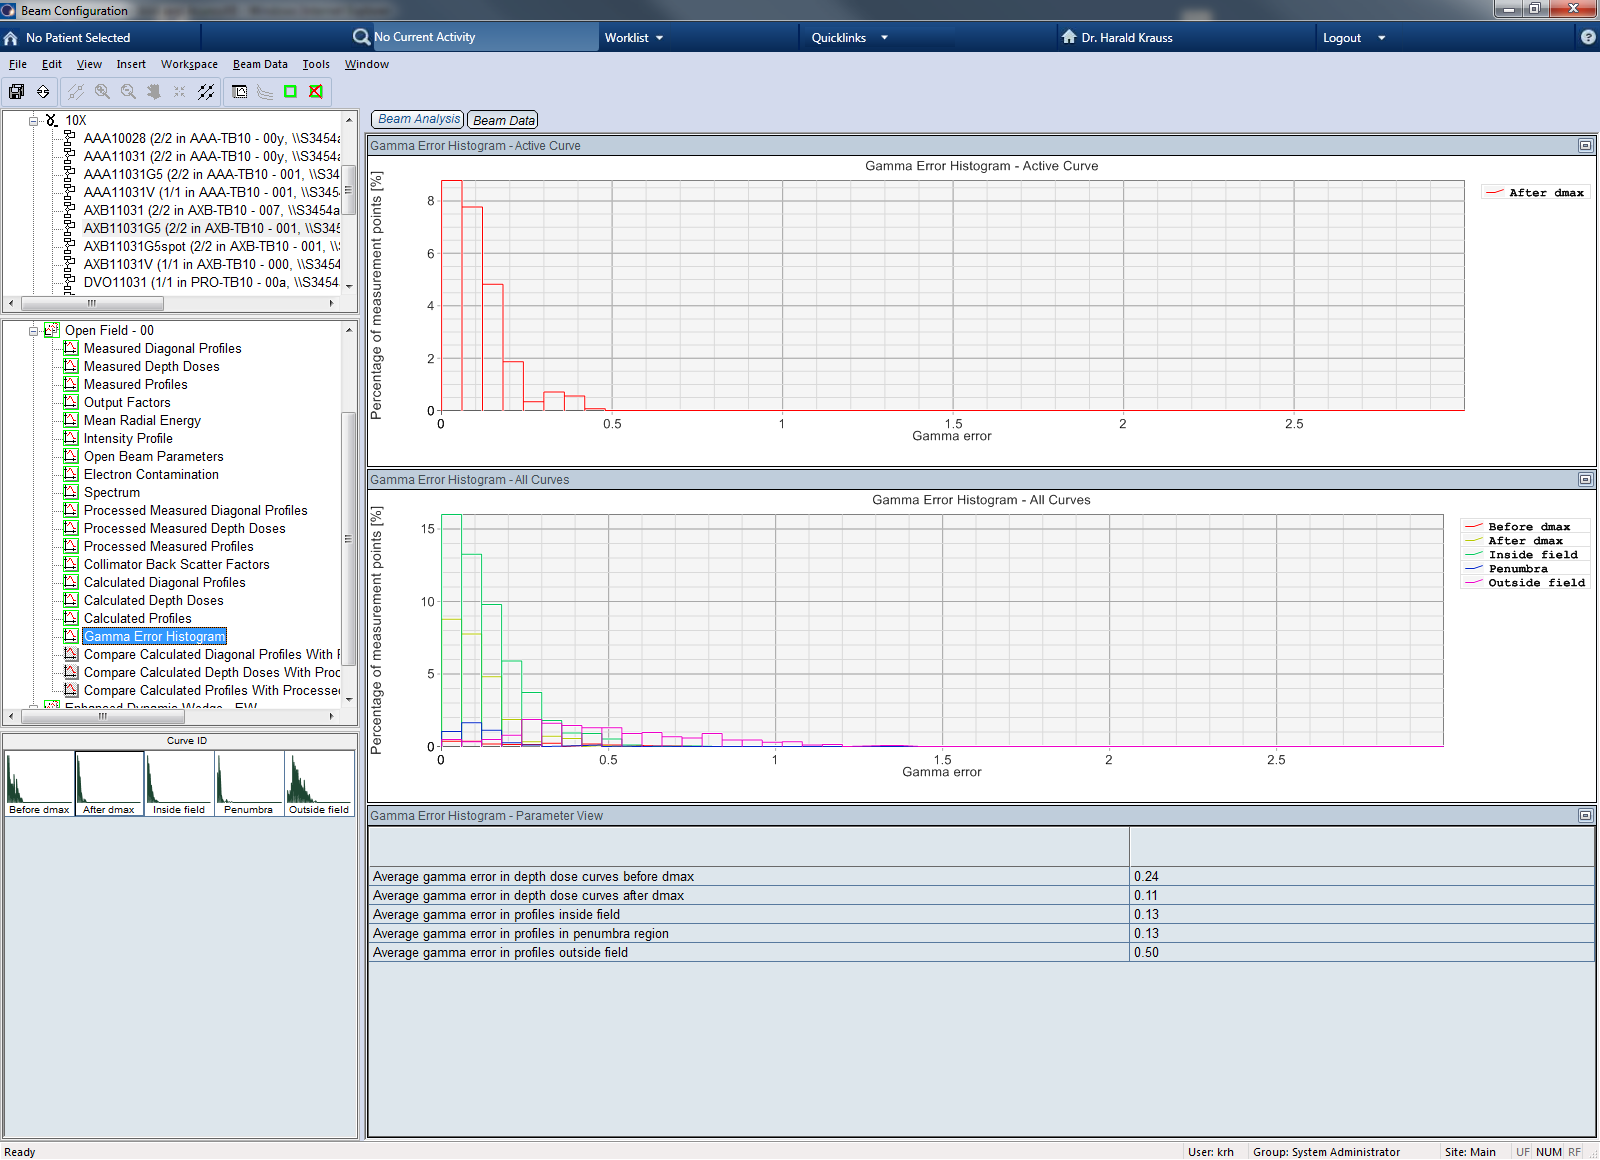
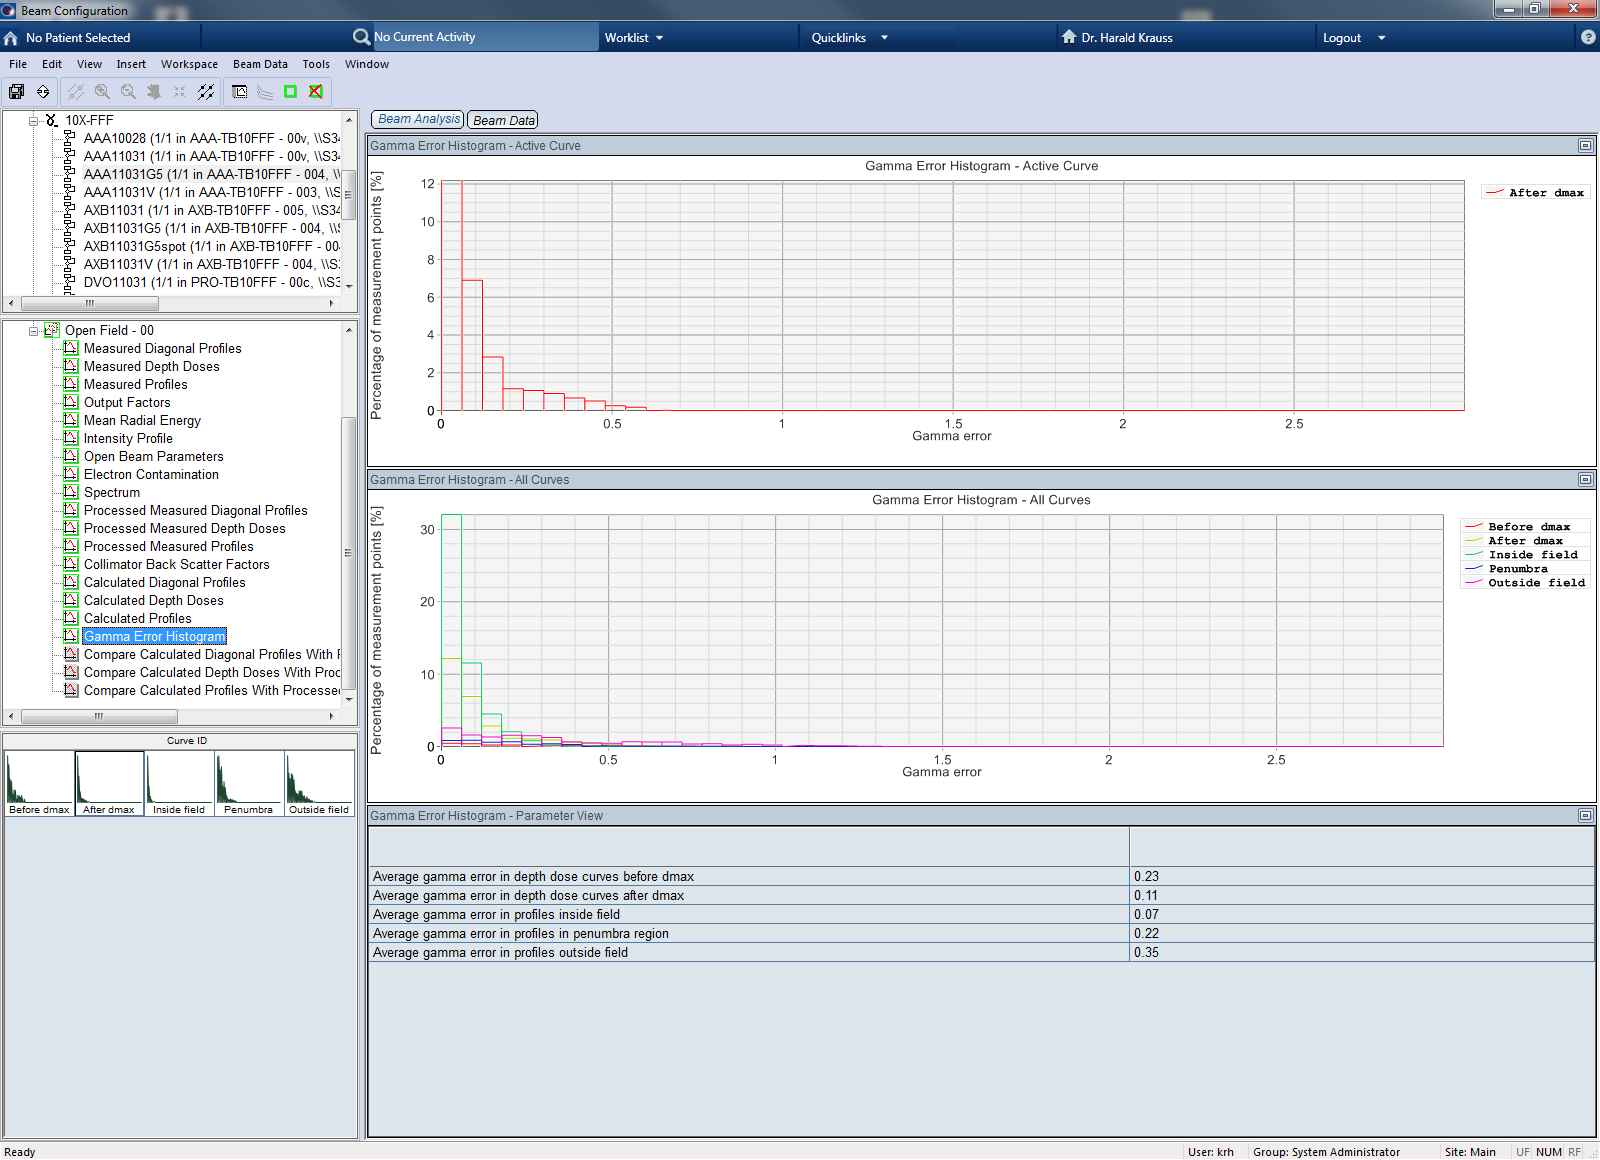
The choice of the PP15 for most curve data is a compromise. We are aware that the recommended field size range of the PP15 is (2 x 2) ... (30 x 30) cm2 according to PTW. Dose in the tails is a little too high compared to a "standard" 31010 with a volume of 0.125 cm3, due to cable effect (which cannot be completely avoided), and possibly some overresponse to low-energy photons. On the other hand, the AAA beam model which Eclipse generates based on the input data is "traditionally" too low in the tails (again compared to a 31010). This also explains the higher Gamma values in the out-of-field region. In favor of the PP15 are (relatively) sharp penumbra and small volume effect, and (relatively) high signal compared to a smaller 31014 ("PP14") or 31016 ("PP3D"). And it is an ion chamber, which fulfills the basic recommendation of Varian.
Notes
1There is a lot of debate about the "true" EPOM shift. See for instance Legrand 2012 and references therein. Our Trufix manual says that for thimble chambers, PTW implemented the "0.5 r" shift.
2It would not be necessary to symmetrize profile before import. During the configuration prcess, Eclipse takes an average of the left and right profile halves anyway. The advantage of symmetrized profiles is that the display of measured profiles in Beam Analysis workspace is also symmetric.