eMC - Measurement of the Beam Characterisation Set and Configuration of Eclipse

Beam data measured on-site in the water phantom are needed for the configuration of the eMC algorithm. This is because all clinical beams differ a little with respect to energy spectrum and beam profiles. If this were not so, it would suffice to import generic "Golden Beam Data" and configure the calculation model with this data.

Only a few curves and reference doses (in cGy/MU) are needed. All measurements can be performed on one day.

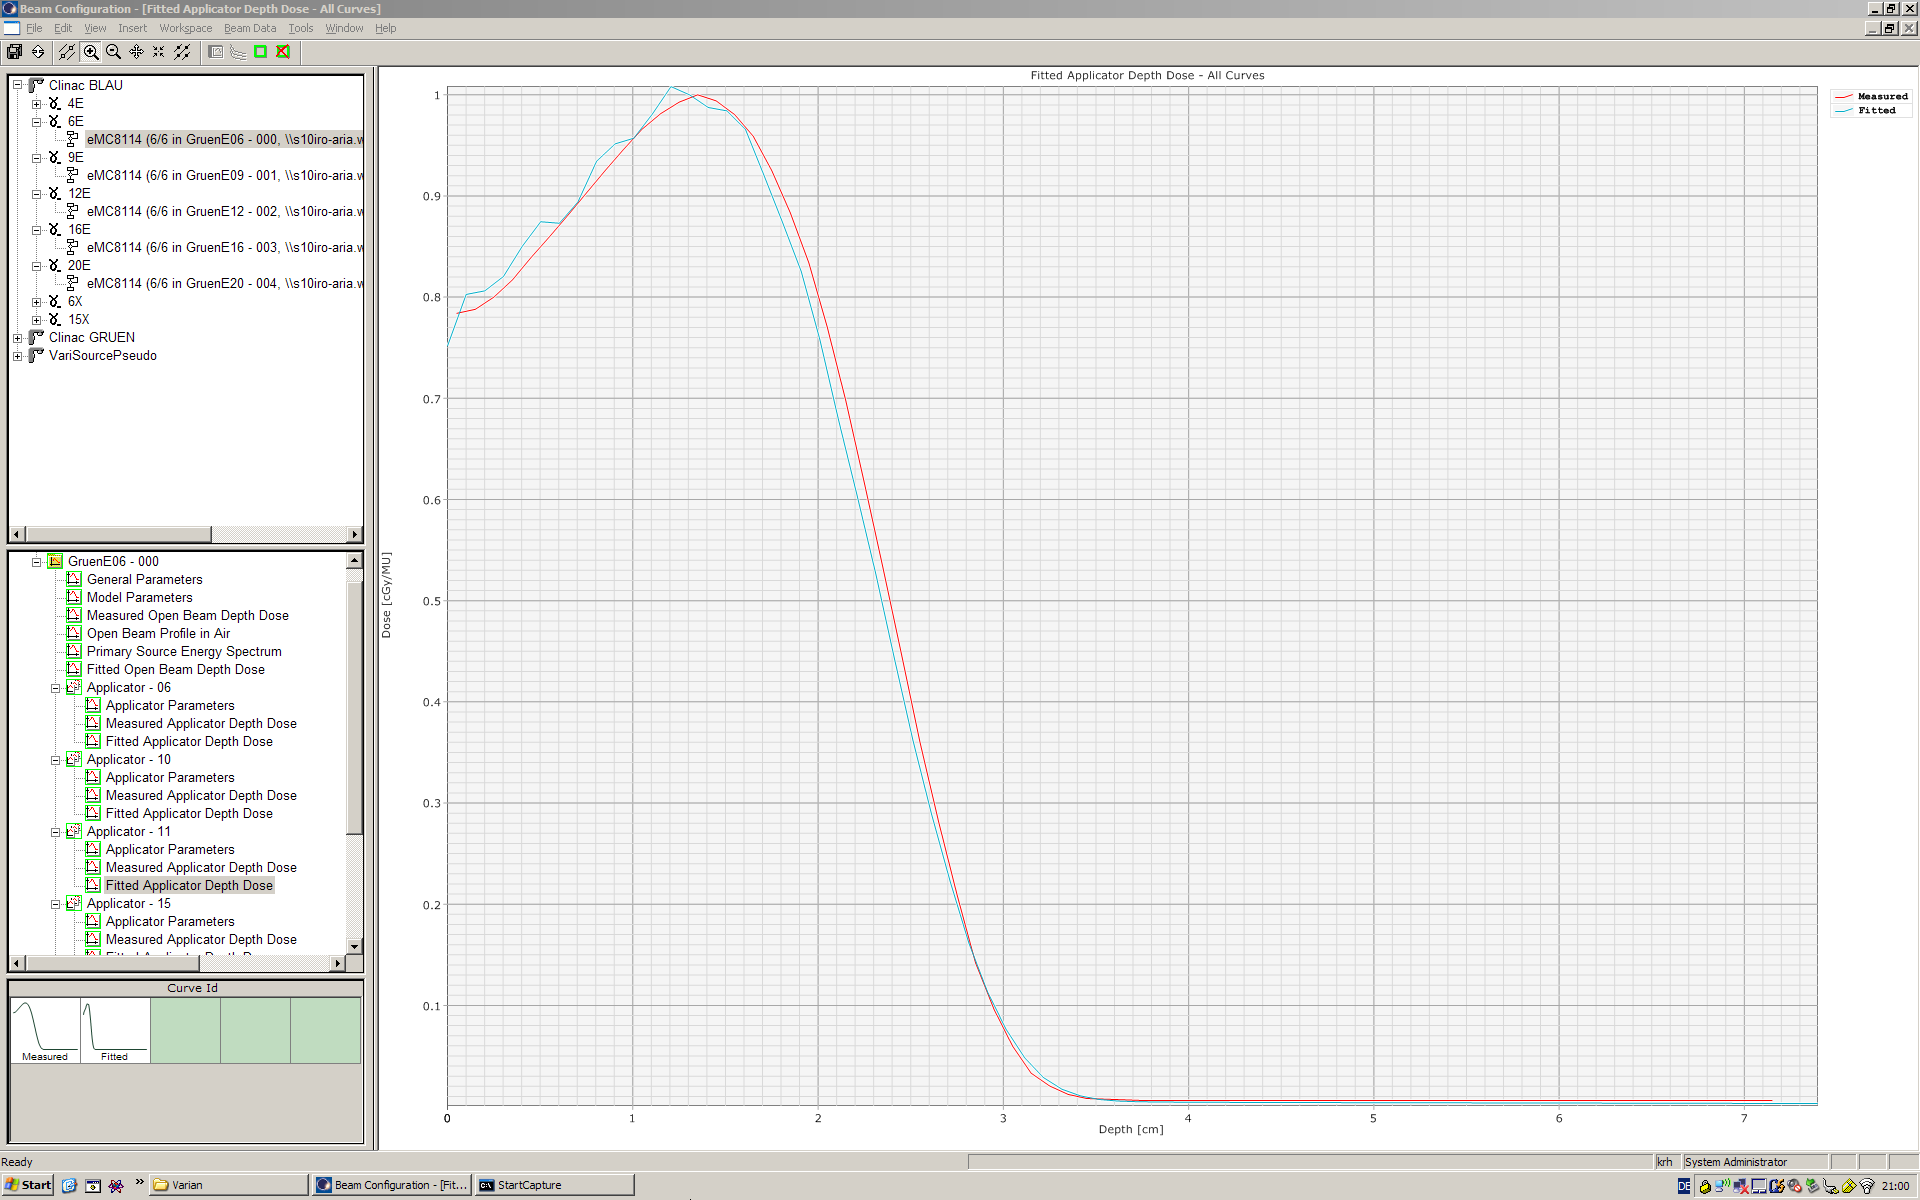
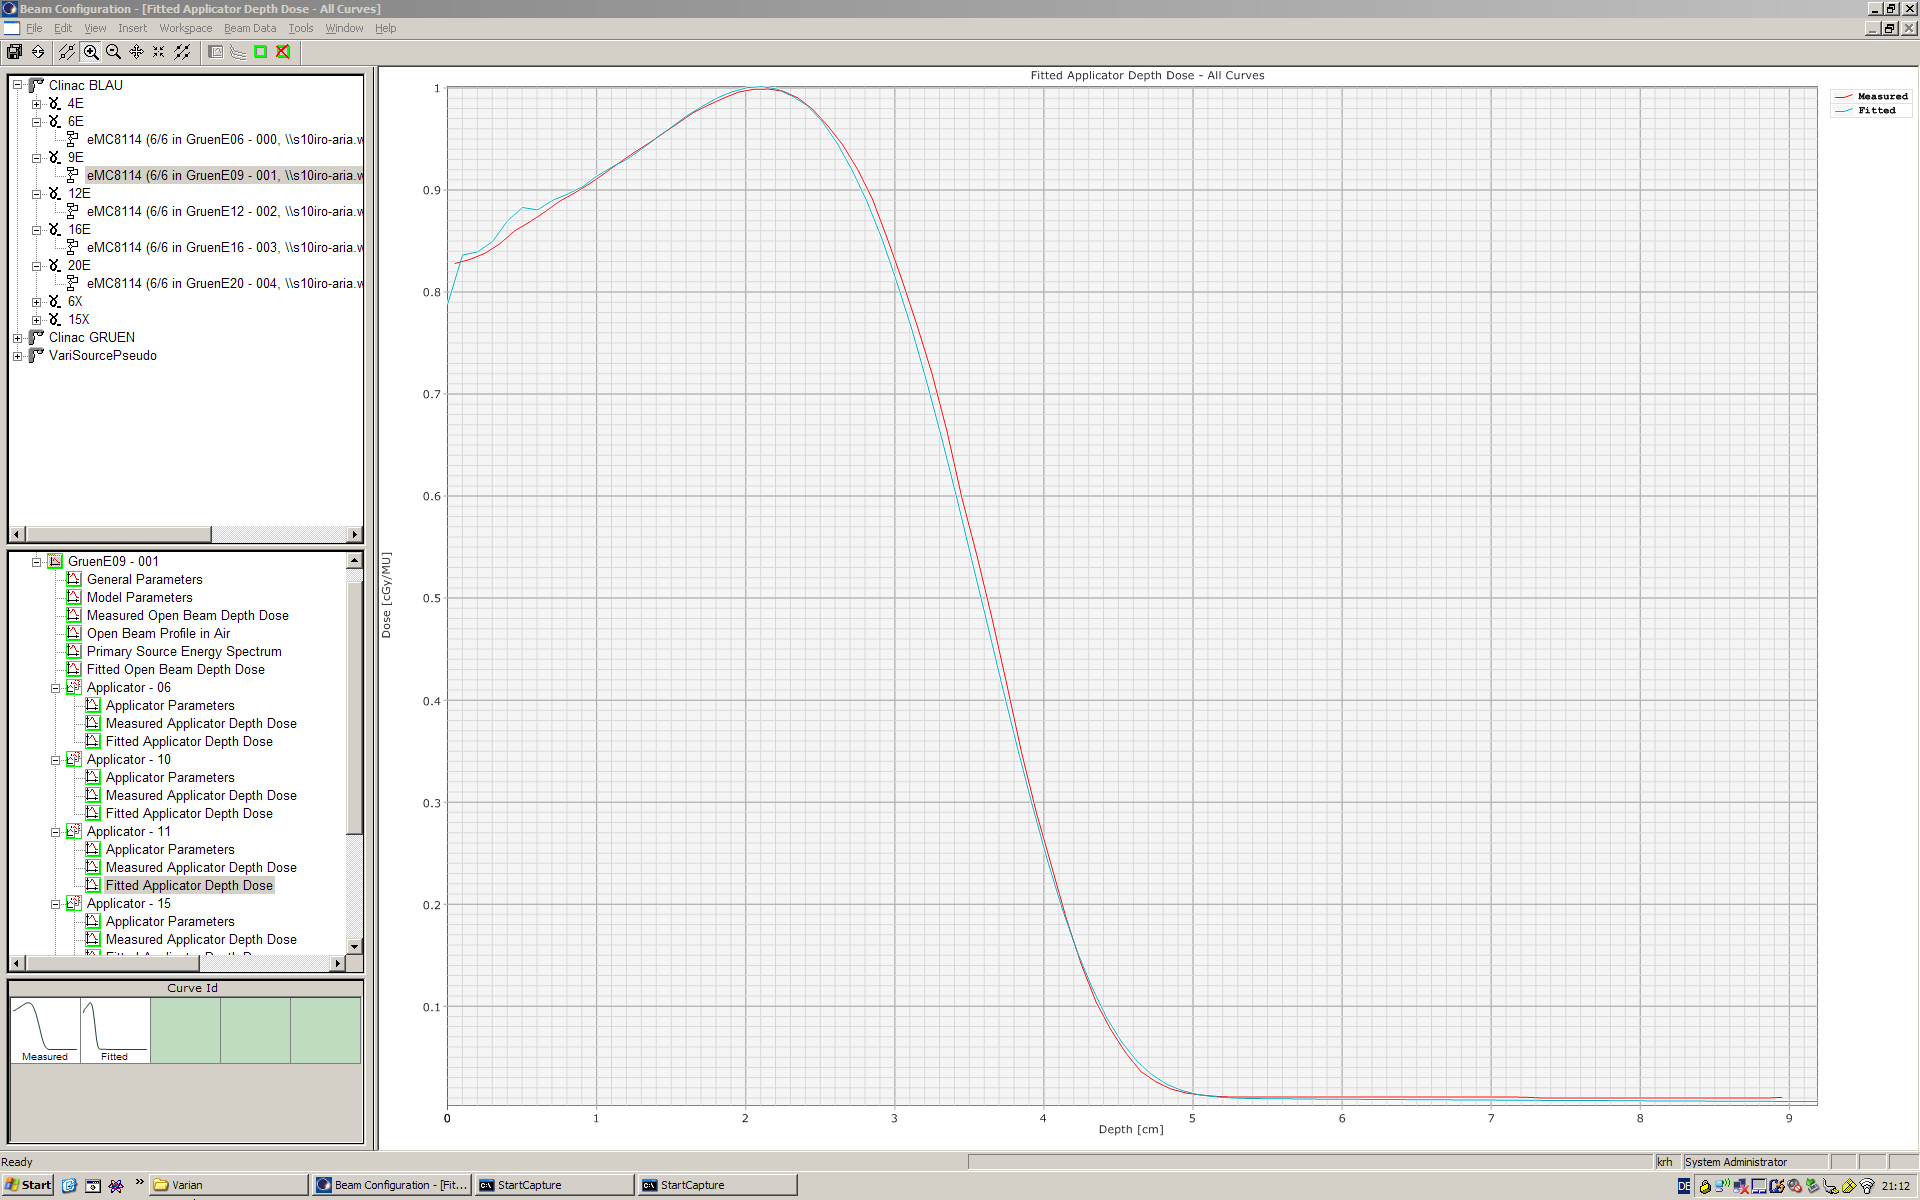
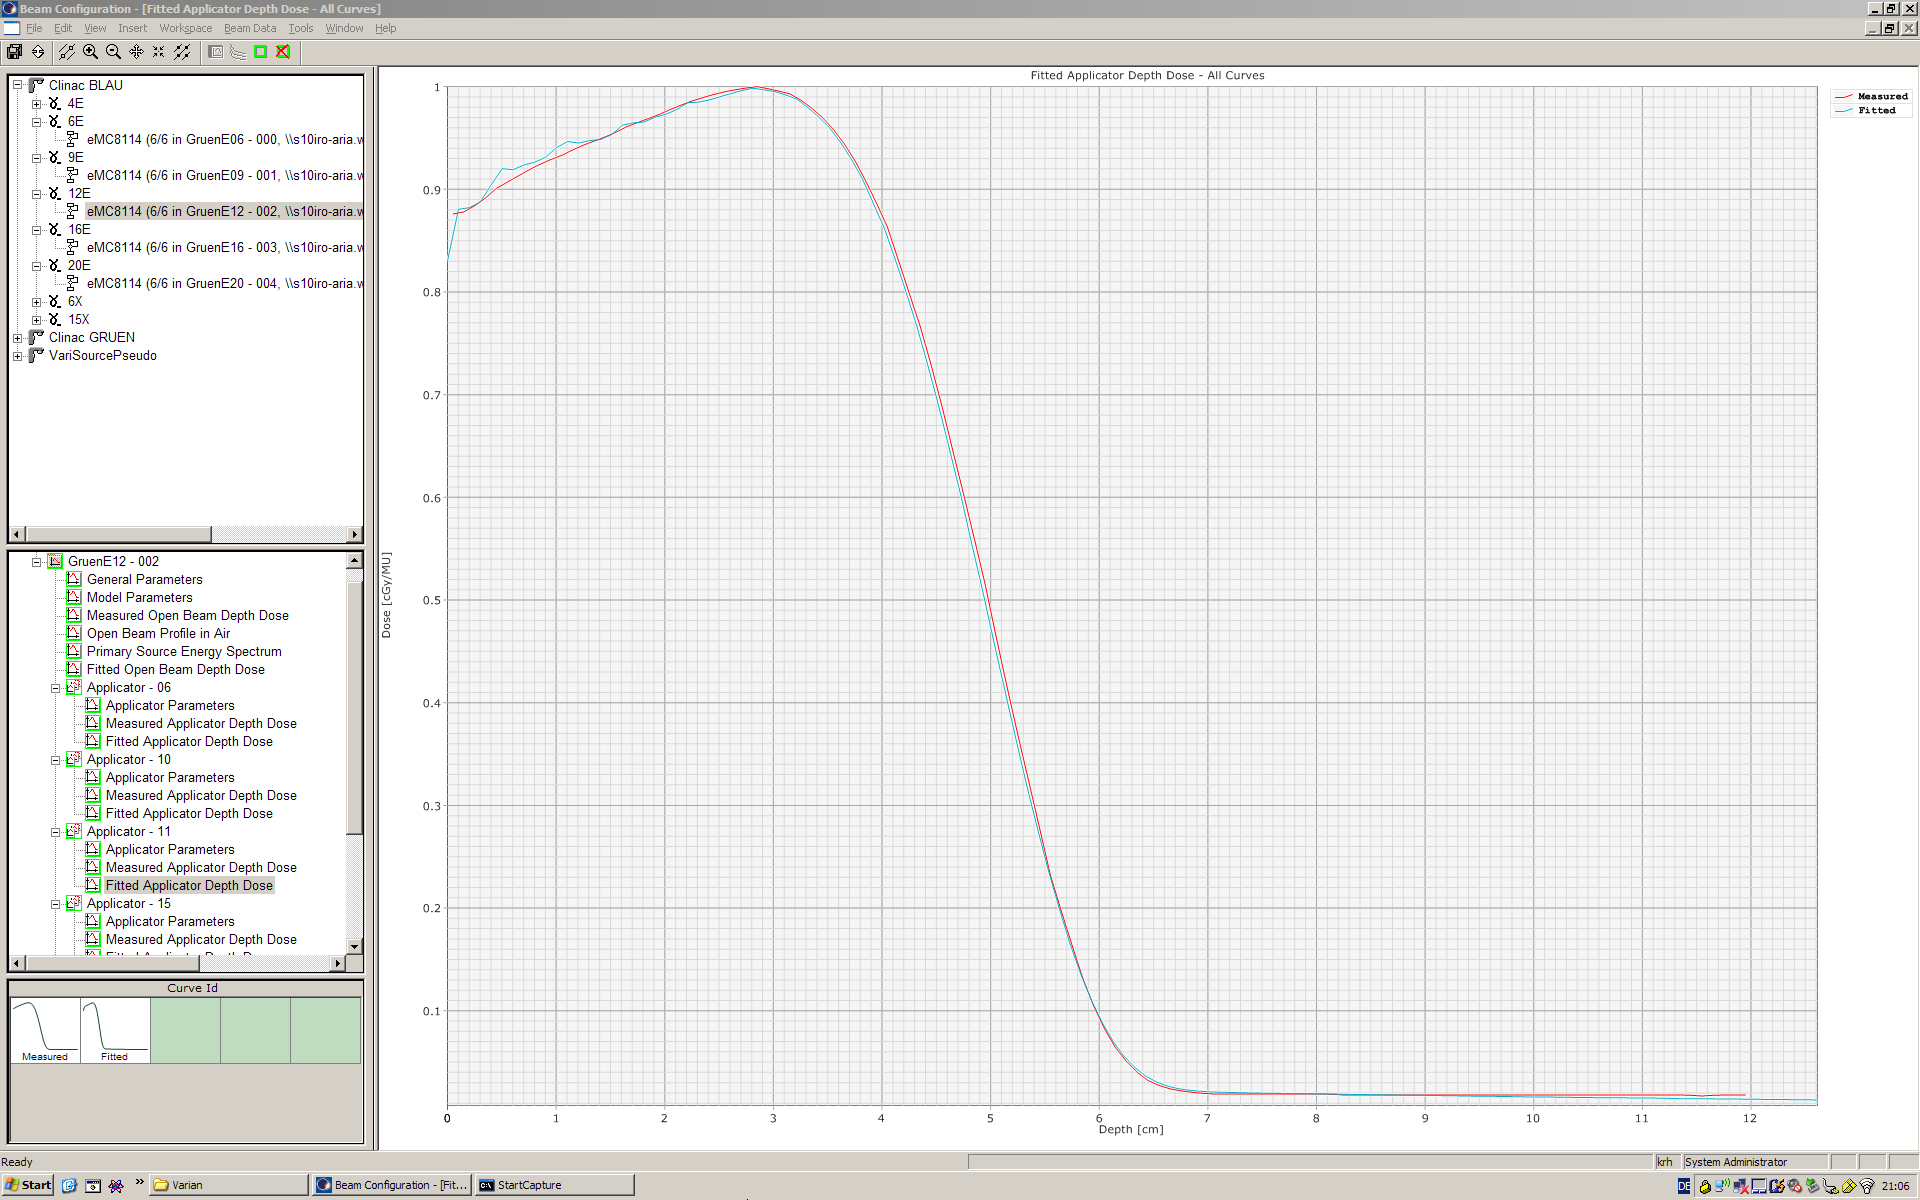
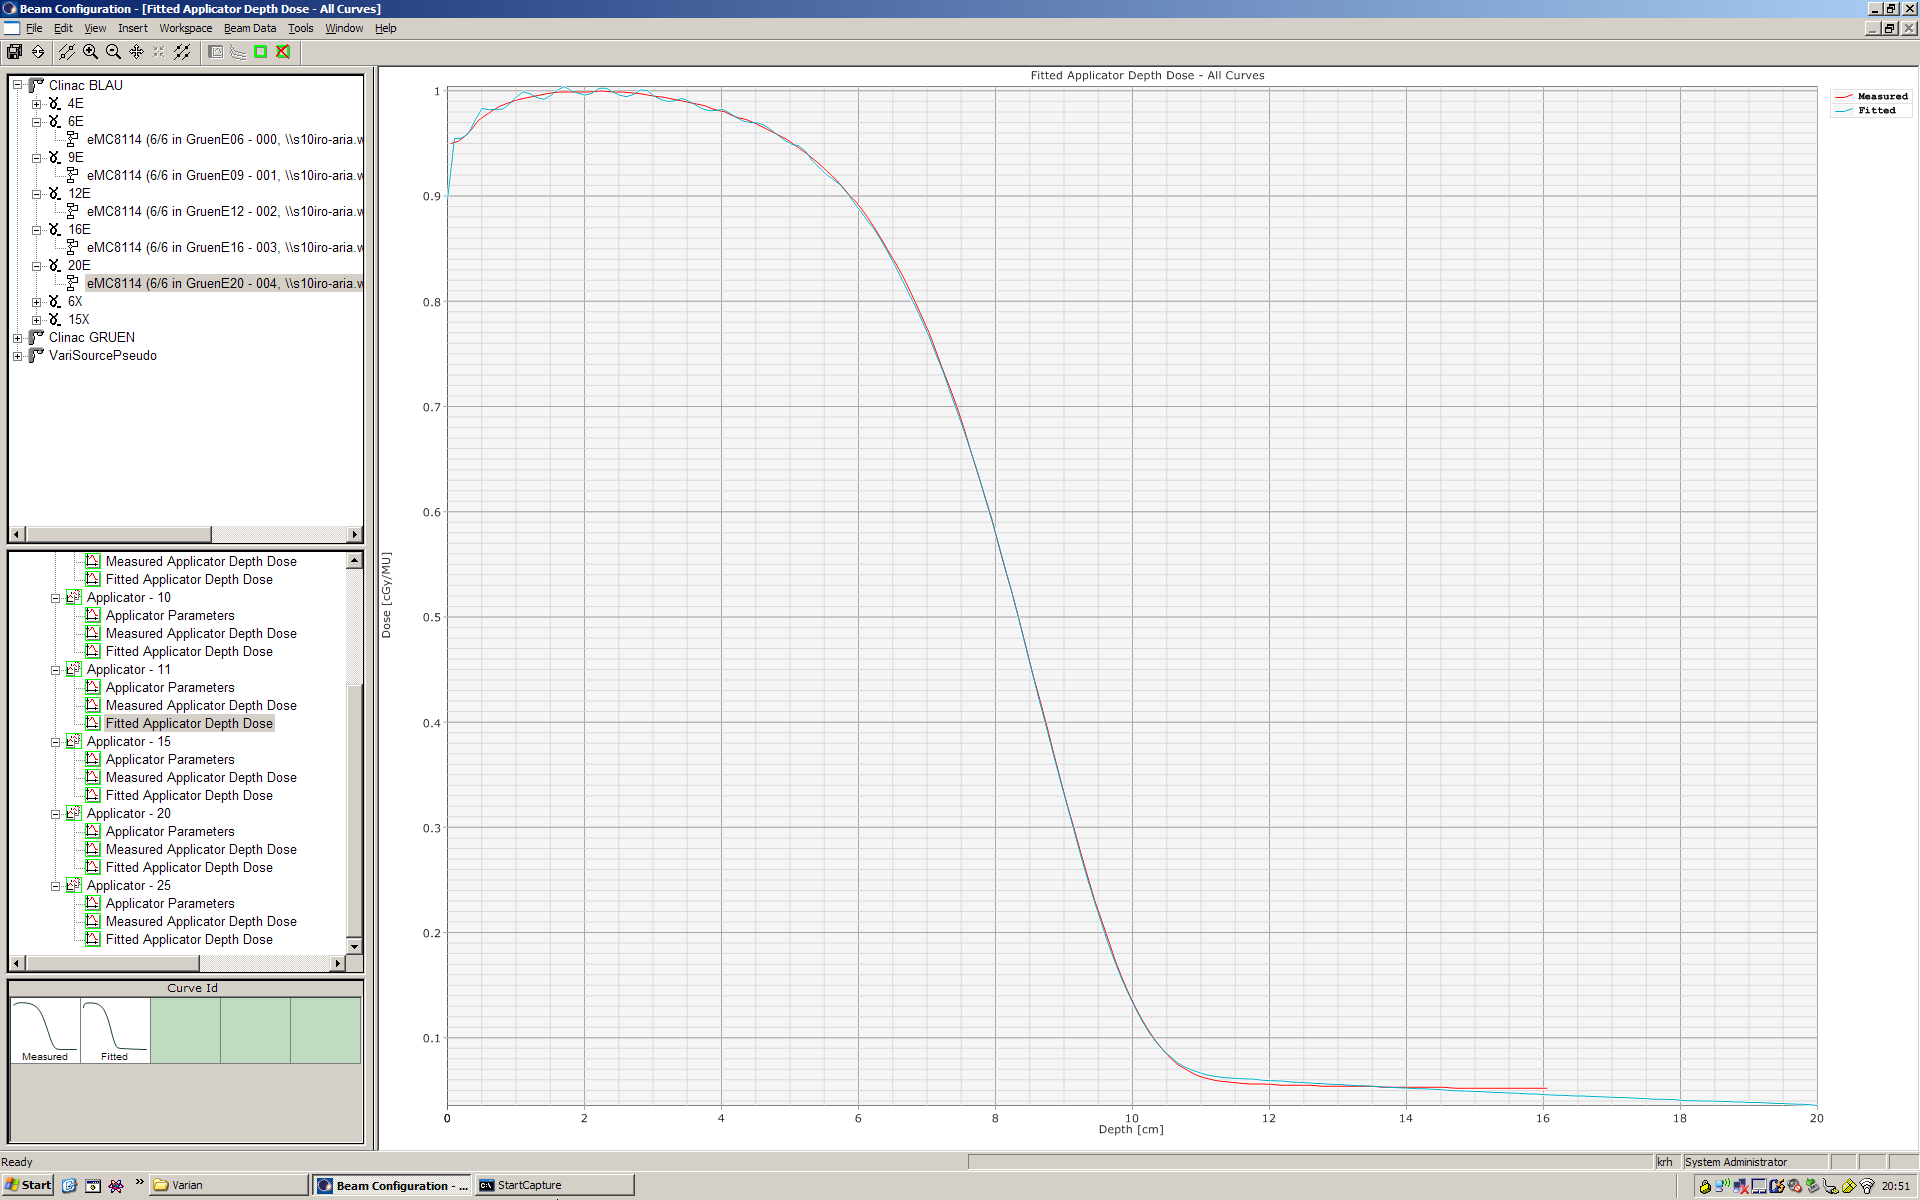
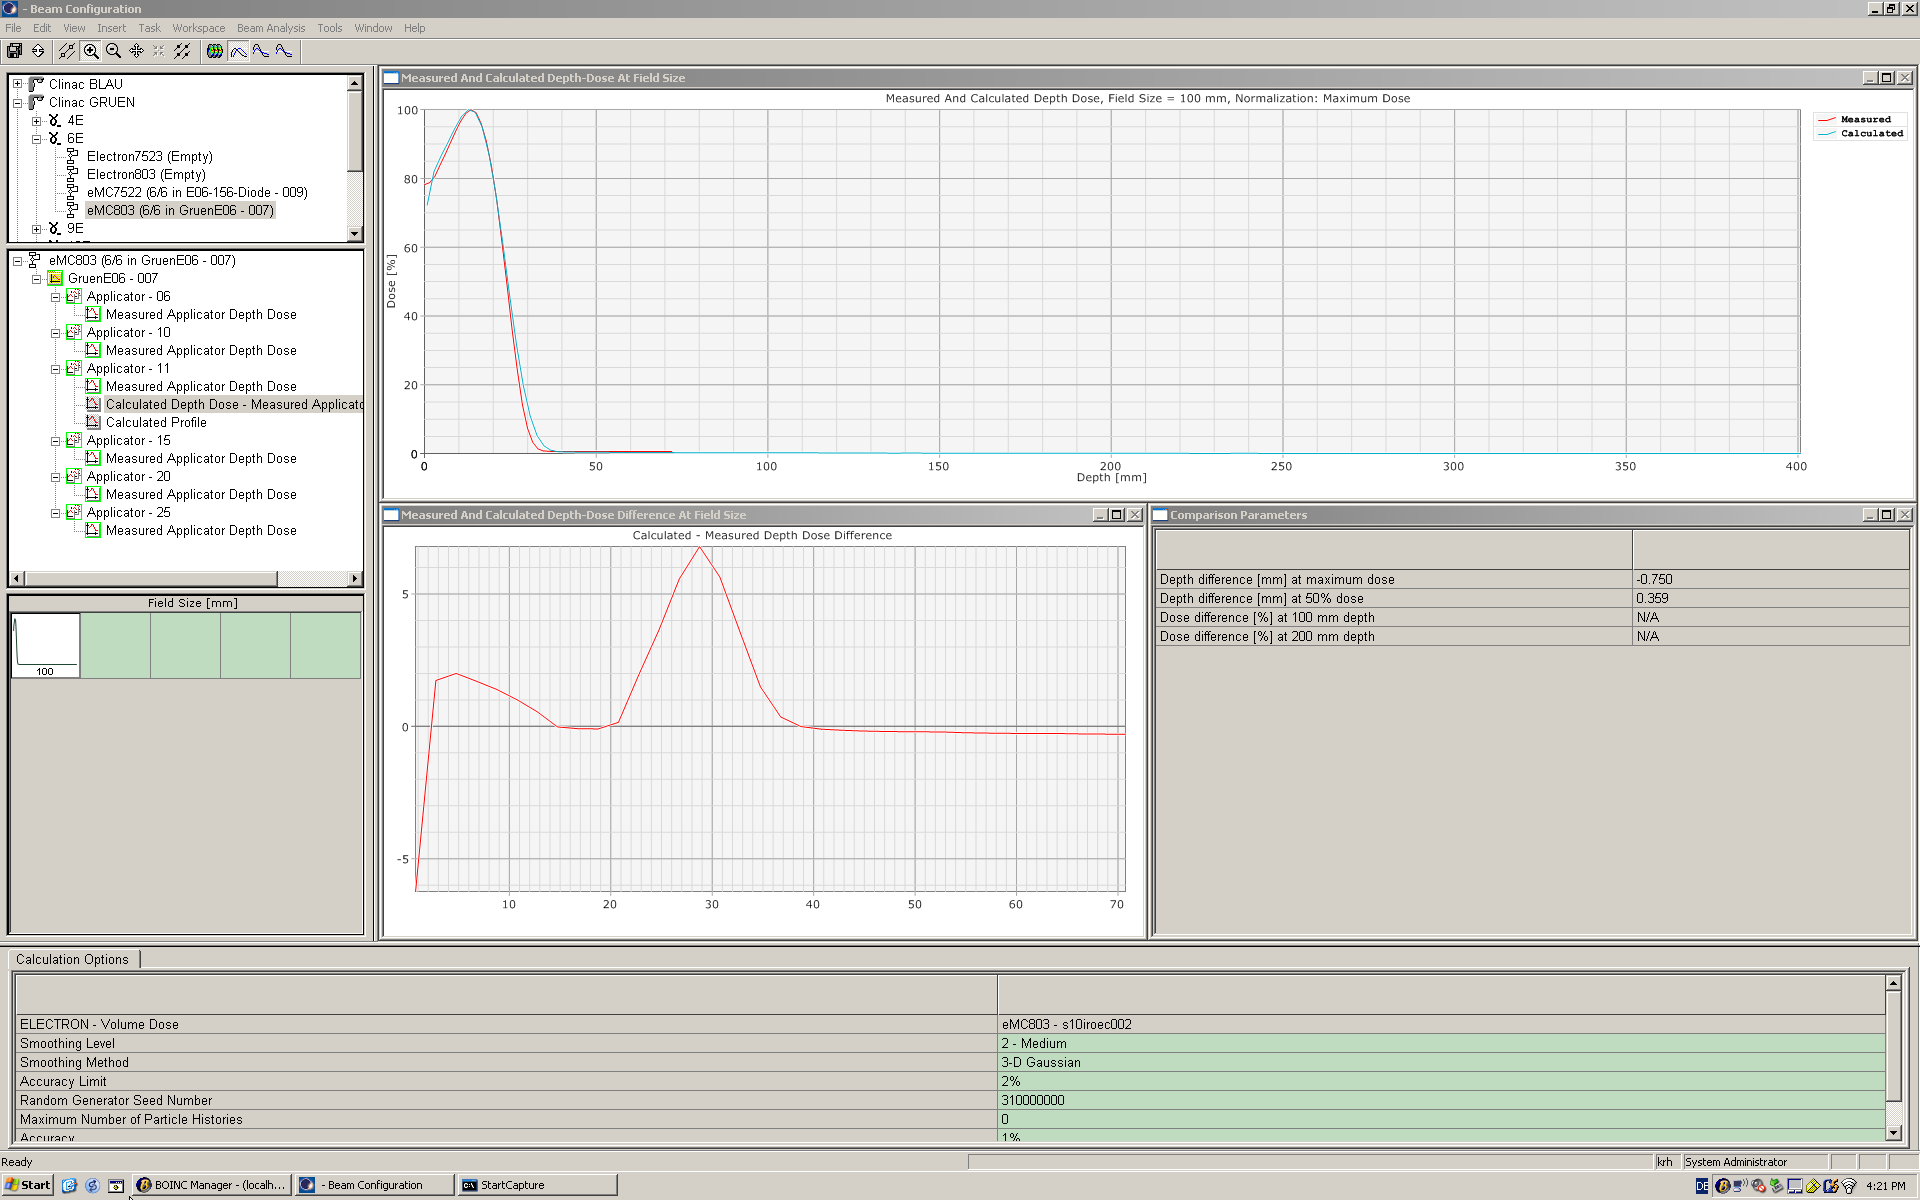
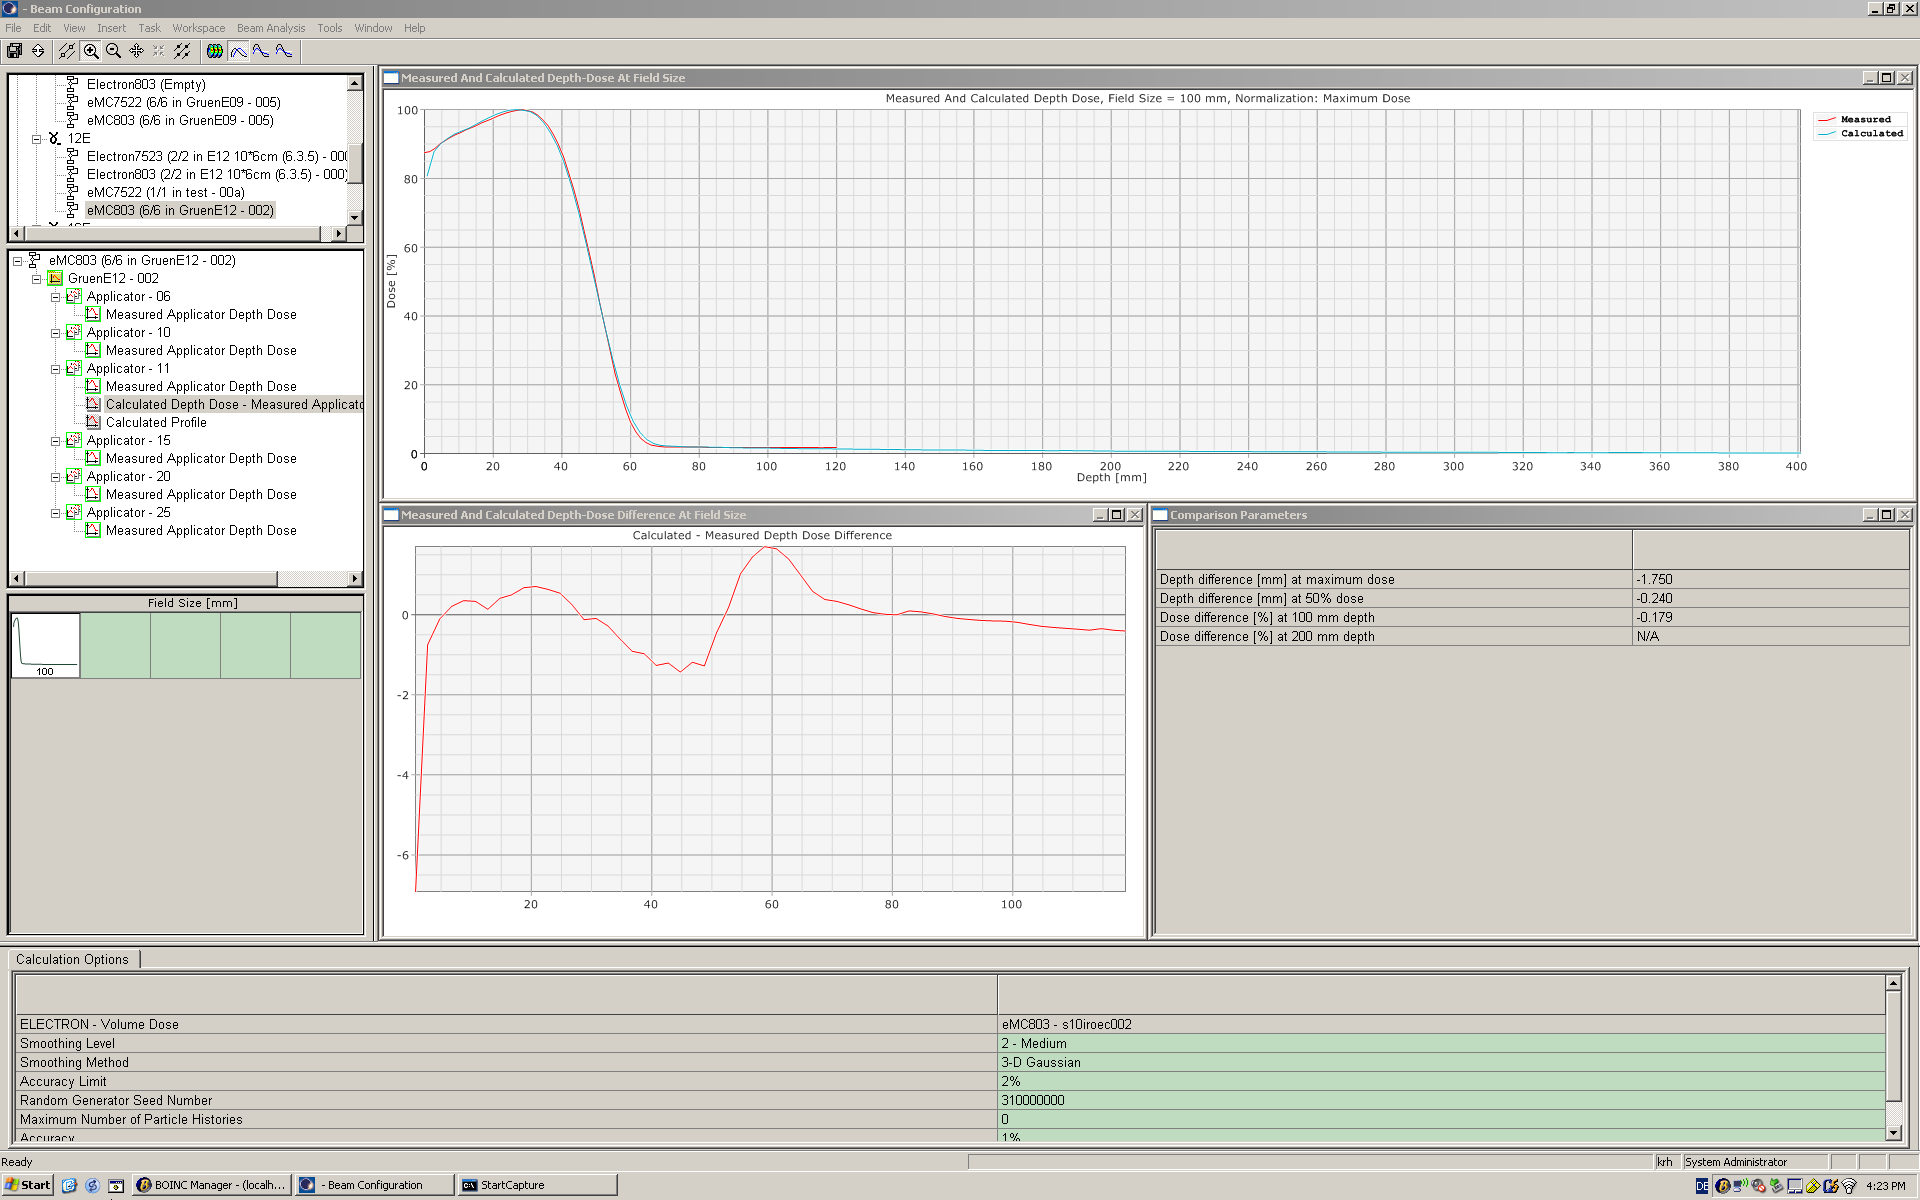
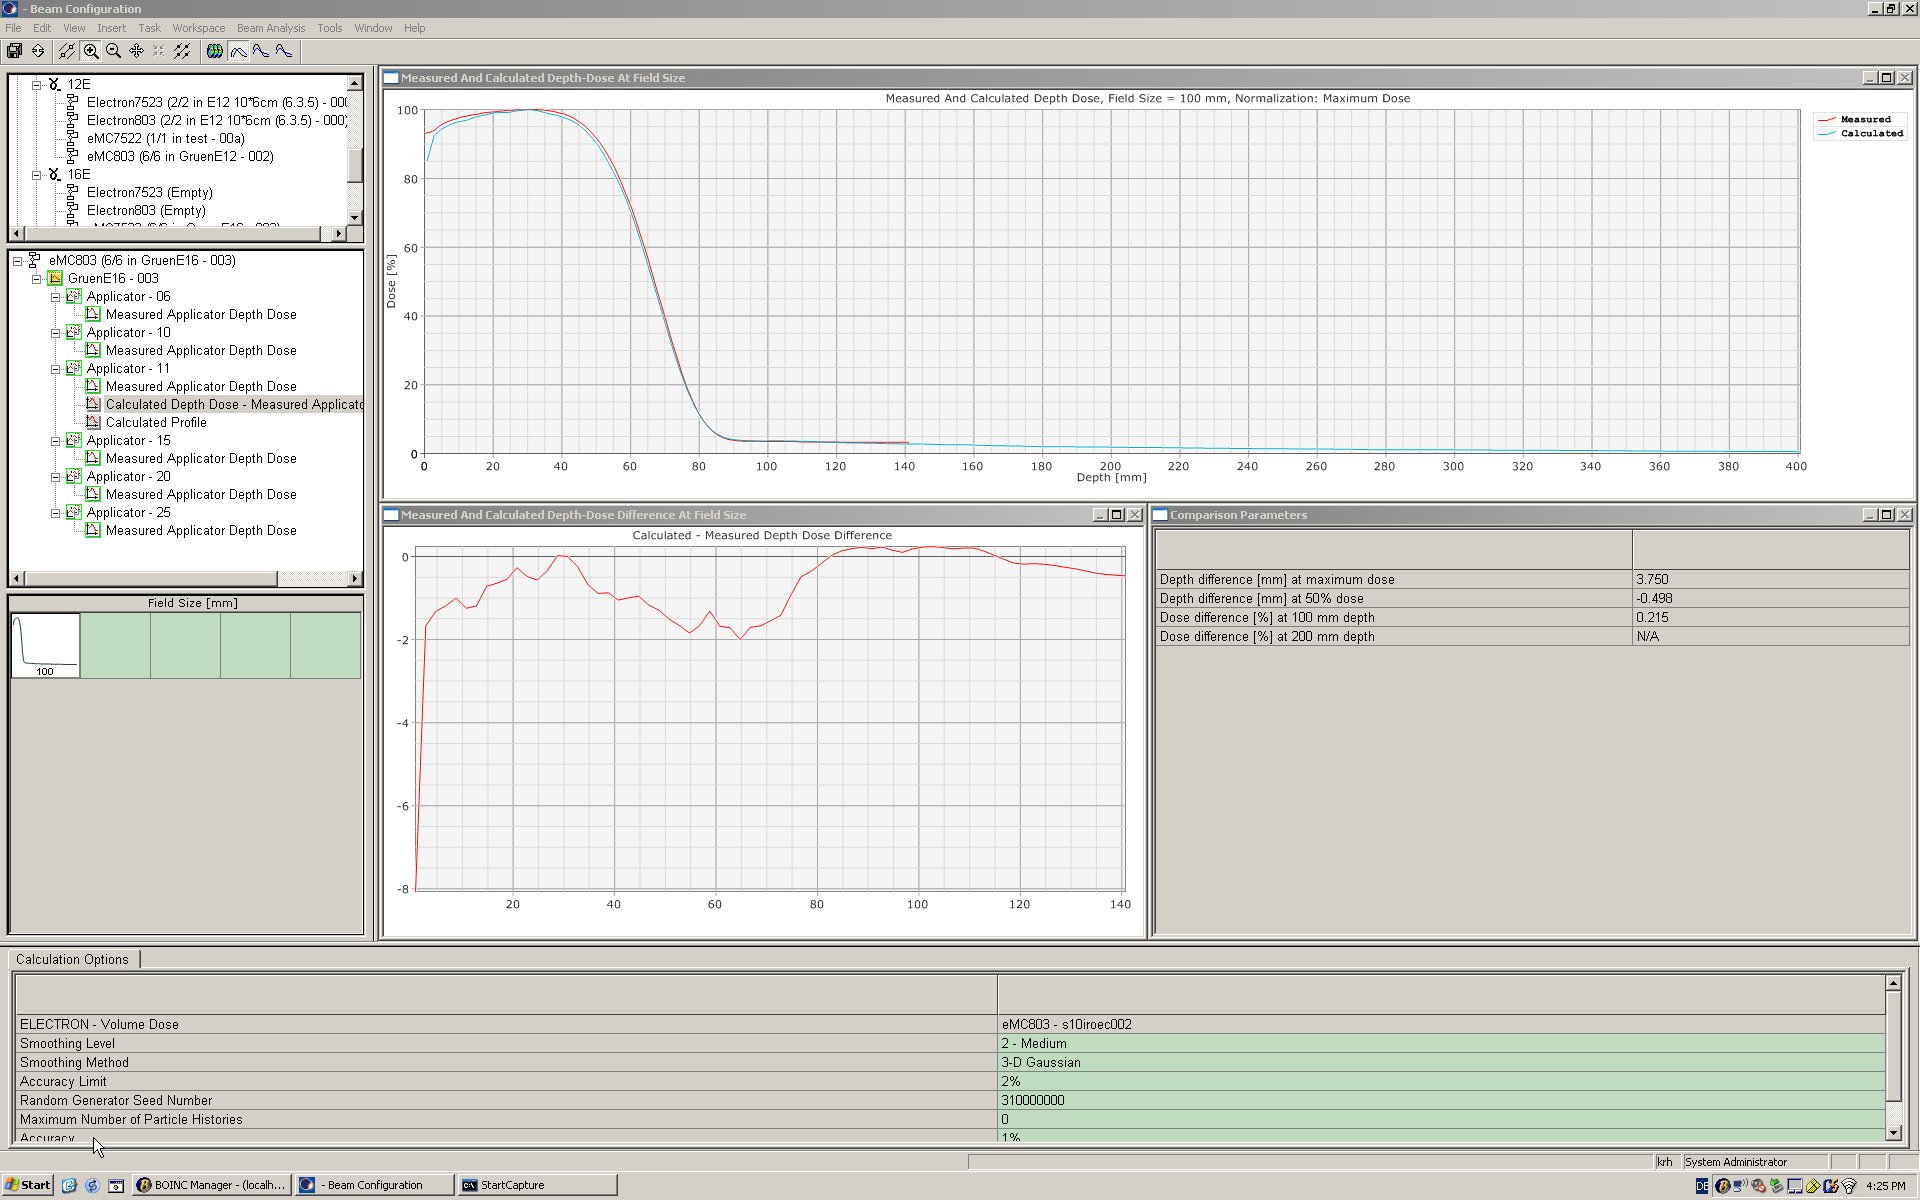
  1. For each energy/applicator combination, a depth dose curve, measured in the water phantom, plus the absolute dose at some reference depth (usually dmax) in cGy/MU is needed.
  2. The same is needed for each energy and open beam (usually 40x40cm). The applicator is removed.
  3. For each energy, without applicator a beam profile in Air, 5cm above isocenter (SSD 95cm), has to be measured.

in-Air profile 16MeV

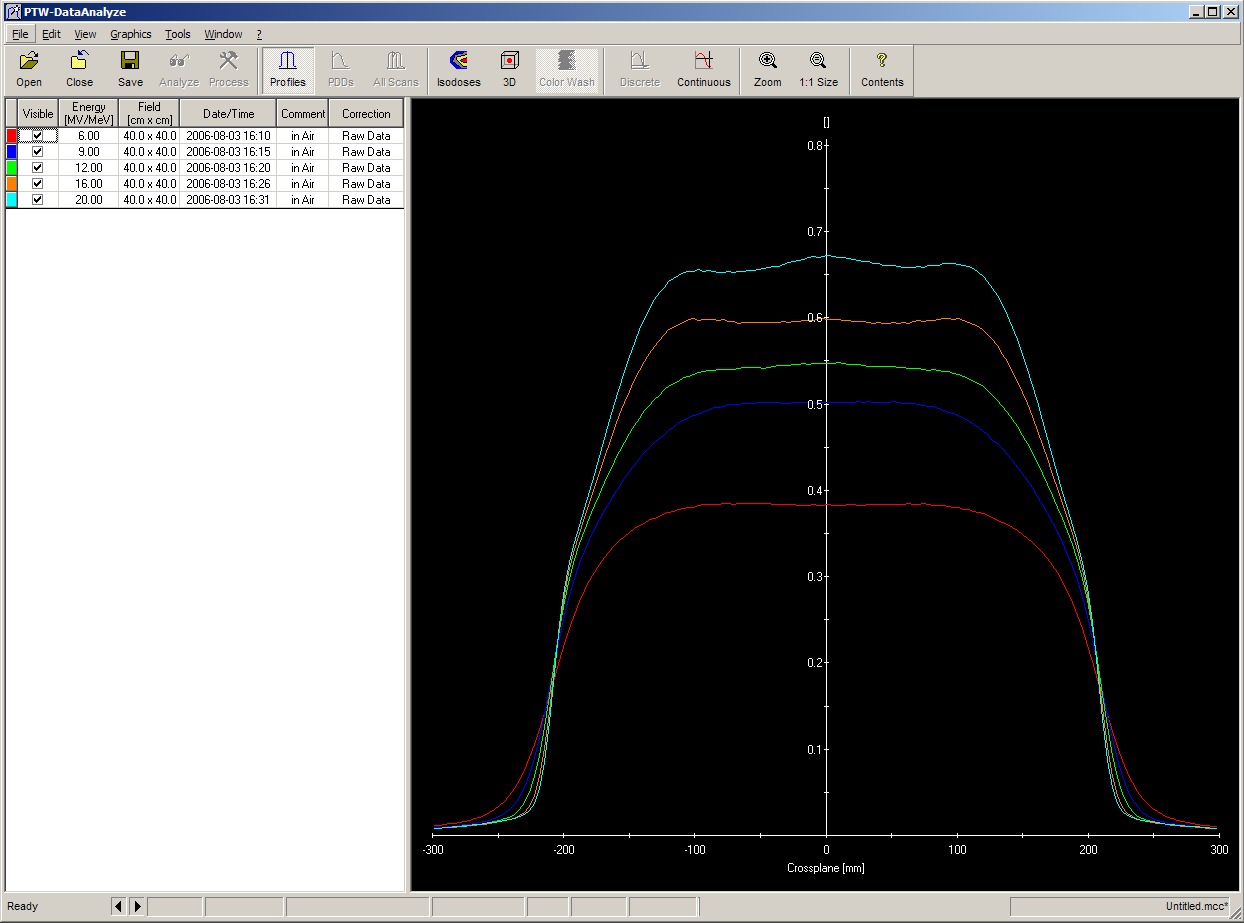
Typical in-Air profiles without applicator.

The ideal ionization chamber for the depth dose curves is a plane parallel chamber (e.g., PTW model 34001, the "Roos" chamber). The in-air profiles can be measured with a solid state detector or a small-volume thimble ionization chamber.

For 5 energies (6, 9, 12, 16, 20MeV) and 7 applicators/field sizes (6x6, 10x6, 10x10, 15x15, 20x20, 25x25, open) this gives 35 depth dose curves, 35 reference dose values and 5 cross profiles in air.

If ionization chamber is used for the depth dose, the raw measured depth ionization curves have to be converted to depth dose curves before importing them in Eclipse.

Fitted Applicator Depth Dose

When "Calculate Beam Data" is selected, the Beam Configuration module fits the model to the measured depth dose curve. The result is the Fitted Applicator Depth Dose (FADD) . But this is not the depth dose curve you would get when calculating this field on a water phantom! Why not? See the instructive explanation from Varian Finland.

6 MeV
9 MeV
12 MeV
16 MeV
20 MeV

Chi2: 0.003900

Chi2: 0.002094
Chi2: 0.001128
Chi2: 0.000762
Chi2: 0.001119
This is an animation of the same curves (the FADDs). The red curves are measured, the blue curves eMC-calculated:


Beam Analysis Depth Dose

In Beam Analysis Workspace, where dose is calculated on a simulated water phantom, the five configured energies have the following depth dose distributions for a A10 (10x10cm) applicator:

6 MeV
9 MeV
12 MeV
16 MeV
20 MeV

Drawn in red are the measured curves, the calculated curves are in blue. Click the images to see the full Beam Analysis screen with more information about the match between calculation and measurement. (Note: "Applicator 11" means 10x10cm, since the "Applicator 10" is reserved for the 10x6cm field size.) These are the depth dose curves you would get in the patient or a water phantom.

The eMC models our medium energies best. The agreement could be better for the

  • lowest energy (6MeV) and all field sizes (see 10% region) and
  • the highest energy (20MeV) and small field sizes (e.g., 6x6cm, not shown here)

One reason could be that in the current implementation, the EGSnrc precalculations for the MMC database have been carried out for monoenergetic electrons in certain steps (0.2, 0.4, 0.6, 0.8, 1.0, 1.5, 2.0 ... MeV), which might not be fine enough.

back to eMC Overview