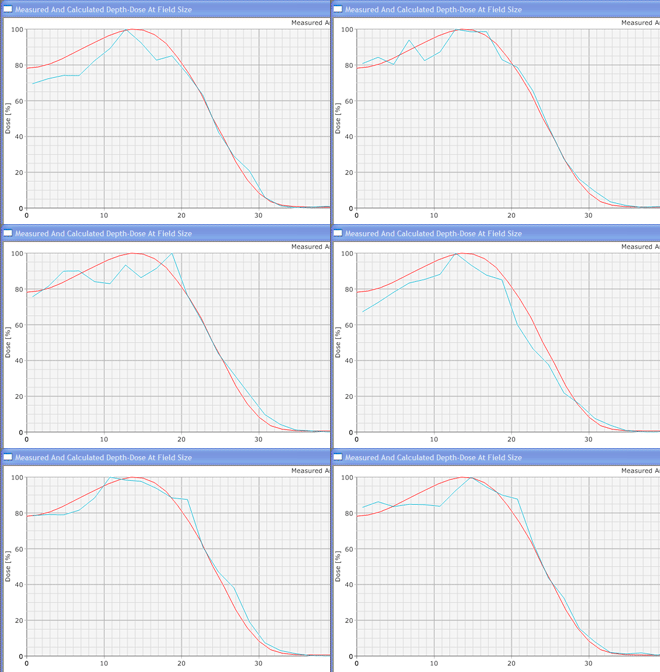
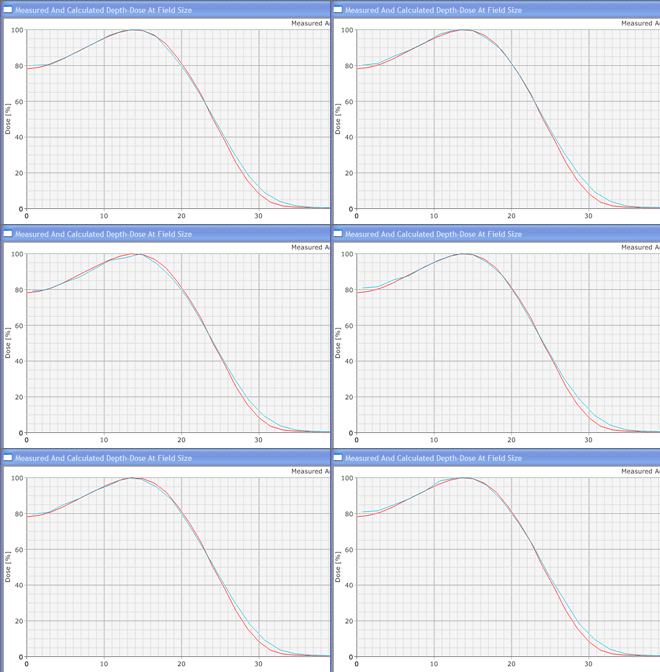
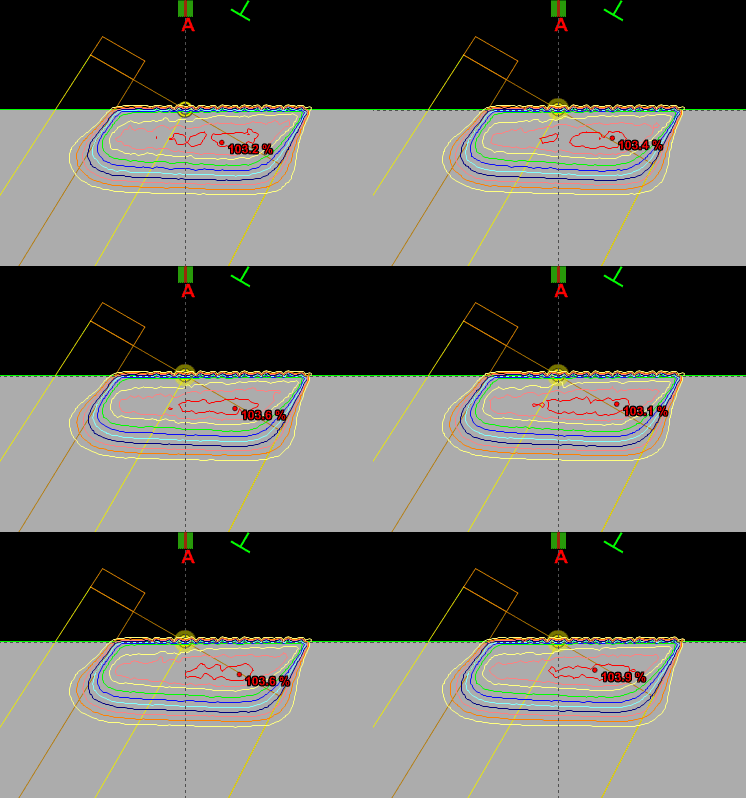
In contrast to conventional deterministic model-based algorithms like the Pencil Beam Convolution algorithm, Monte Carlo algorithms are nondeterministic: they use random numbers (see below). However, by making the number of calculations ("particle histories") very large, the accuracy can be controlled. MC methods in radiotherapy use a more or less detailed modelling of the accelerator's treatment head, and follow a large number of (several million) particles on their way from their origin (the target, the flattening filter, the wedge etc.) through air and the patient tissue to the places where they scatter and where they deposit their energy (after an energy dependent cascade of scattering events). The tiny energy depositions in the irradiated volumes are added up, forming a threedimensional dose distribution just like in conventional dose planning. (For a general information about the Monte Carlo Method, see for instance: http://en.wikipedia.org/wiki/Monte_Carlo_Method and the references therein.)
The transport model of the eMC is the Macro Monte Carlo (MMC) method (Neuenschwander, see reference below). By using this method, the eMC adresses the key issue of Monte Carlo dose calculation: Calculation speed. However, calculating a 20x20cm Electron field (20MeV) with 1% accuracy and 2mm grid still may take about an hour or so in a typical clinical environment like ours. But fortunately, such large field sizes and high energies (higher energy makes Eclipse process more interactions) are not so common. More about that in later sections.
Another method implemented by eMC is the Local-to-Global method: it is not necessary to handle the basic interactions on a microscopic scale directly in the patient model. Precalculated microscopic interactions (local scale) are used during the macroscopic dose calculation (global scale).
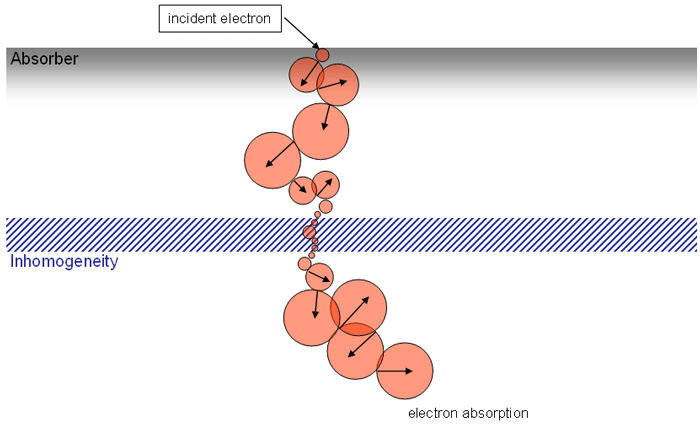
How does it work? When the calculation is started, the patient CT data is preprocessed: each voxel is binned into one of five categories according to mass density (Air, Lung phantom, Water, Lucite, Solid bone phantom). The voxels are labeled with a "sphere index" defining macroscopic spheres of different sizes. In regions of homogeneous material, sphere size is larger. Each sphere defines one transport step along the electron's track.This speeds up the calculations: if you know the next 5cm of tissue are made of water, there is no need to calculate from "one atom to the next".
Since an image says more than 1000 words, here is how this looks like:

In homogeneous regions, spheres are large. When the interaction path comes closer to an inhomogeneity, spheres get smaller. The local "sphere index" describes the largest sphere around the local voxel which does not reach into the inhomogeneity.
For the 5 Preset Materials, extensive precalculations using the EGSnrc code have been carried out "in the laboratory" for 30 different energies between 0.2 and 25MeV and different sphere sizes. The results from these microscopic calculations are stored in the MMC database as Probability Density Functions (PDFs).
The PDFs are stored in the TPS configuration and used during eMC dose calculation. They actually determine the path on which the electron gradually deposits its energy, "rolling the dices" after each transport step. In each sphere, the PDFs give the exit position, direction and energy of the exiting primary electrons emerging from the sphere with the parameters radius, material and incident electron energy. "Probability" also means that voxels not falling exactly in one of the 5 density categories are handled statistically: if a voxel has a mass density right between water and lucite, then during 50 out of 100 interactions it will be treated as water, the other 50 interactions as lucite. Secondary particles (photons and electrons) are also stored in the PDFs, but without position or direction.
The Initial Phase Space model describes the phase space of the beam at a plane 95cm below nominal focus (5cm above isocenter). The model contains the main photon and electron sources of the clinical beam:
- the main diverging electron beam (source: scattering foil 10cm below nominal focus)
- the main diverging photon beam (same source)
- the second diverging electron beam (source: virtual point source 50cm below nominal focus)
- the second diverging photon beam (same source)
- edge electrons (line source around opening of applicator or insert)
- transmission photons,
consisting of
- Bremsstrahlung photons produced in the cerrobend applicator insert
- main photons, passing through the applicator insert (they get beam-hardened!)
- main photons after Compton-scattering in the applicator insert
The IPS model also contains a model of the accelerator treatment head, the electron applicator details and the possible energy modes. In the current version, only Varian machines are supported.
There are many more interesting features of the algorithm, which cannot be discussed here. For those who want some more in-depth information about eMC, here is a list of literature references:
- Neuenschwander H, Mackie RT & Reckwerdt PJ: MMC – a high performance Monte Carlo code for electron beam treatment planning. Phys. Med. Biol. 40 (1995) 543-574
- Janssen JJ, Korevaar EW, van Battum IJ, Storchi PR & Huizenga H: A model to determine the initial phase space of a clinical electron beam from measured data. Phys. Med. Biol. 46 (2001) 269-286
- Ding GX, Duggan
DM, Coffey CW, Shokrani P, Cygler JE: First macro Monte Carlo based
commercial dose calculation module for electron beam treatment planning
- new issues for clinical consideration. Phys. Med. Biol. 51
(2006) 2781-2799


