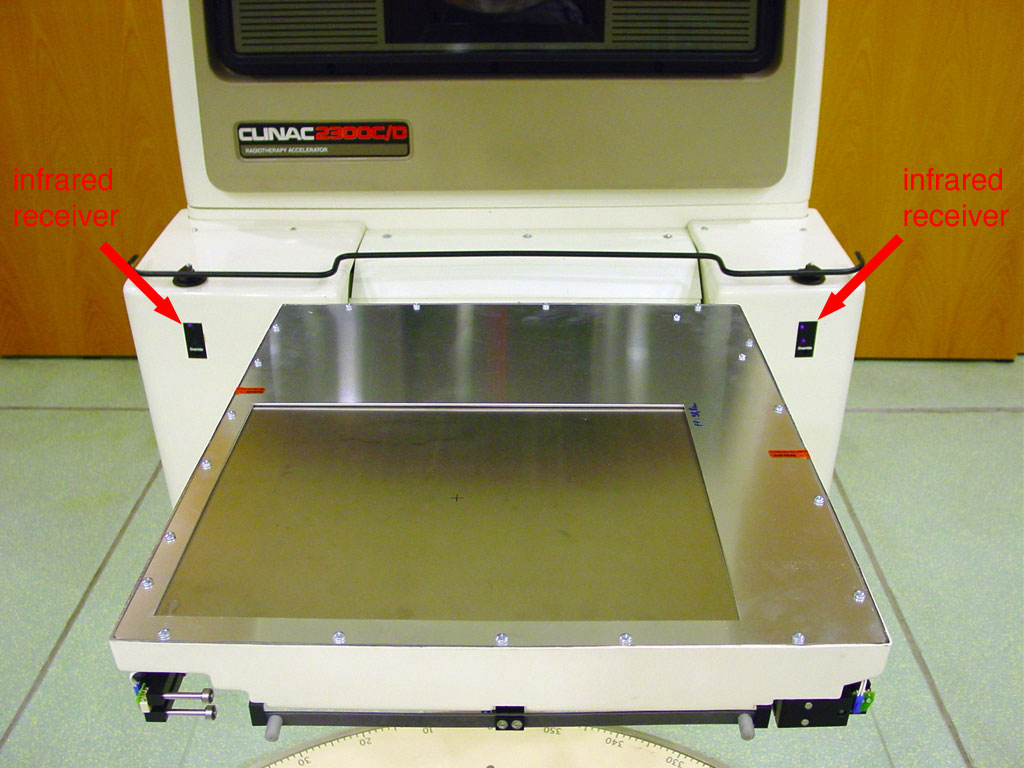
Fig.1:
aS500 detector on the 1996 Clinac 2300C/D with collision cover removed (Click on images to enlarge).
The aS500 (IDU11) is an amorphous silicon Portal Imaging detector, and was installed on our linacs for the first time in Feb 2004. The image size is 512x384px, the detector size is 40x30cm. The newer system (aS1000) has an IDU20 Image Detection Unit with 1024x768px but the same detector size. These imagers were installed in 2006.
|
Fig.1:
aS500 detector on the 1996 Clinac 2300C/D with collision cover removed (Click on images to enlarge). |
The detector cassette is mounted on a mechanical arm (R-arm) which is remotely controlled with an infrared-pendant. The R-arm can move the detector in all directions. The minimum distance from focus is 105cm, the maximum distance is 183cm. NOTE: a current (>2006) Clinac would have robotic Exact-arms, which are orders of magnitude more precise than our old R-Arms.
In contrast to the older liquid-filled imaging detectors (LC250), the aS500 both has a higher resolution and a faster readout. Resolution and speed are necessary to acquire fluence images of sliding window treatments with good quality. See the following images.
 |
 |
Fig.2:
The first clinical IMRT fluence images (LC250, Dec. 2000). Note the stripe
artefacts due to slow readout. |
Fig.3:
The first prostate IMRT (already with aS500). Note the infinite number
of intensity levels (in contrast to step-and-shoot techniques). |
Speed is a basic requirement for IMRT verification, when leaves move at up to 2.7cm/s. The limits of the acquisition system can be seen in the following example. Leaves are moving at 2.0cm/s, the Image Acquisition System (IAS2) is requested to perform continuous acquisition with 1 frame average (the minimum value in our system configuration). This is the weekly DMLC checkout sequence (210MU@DR300). The duration is 42s, and 28 images are acquired (one image every 1.5s). But how long did the image readout itself take?
 |
Continuous image acquisition during weekly DMLC-QA (see text). Click images for increased size. |
One can see that the moving 5mm slit is tilted, which is a readout artefact. From the tilting angle (0.65°), the readout speed can be calculated. The bottom leaf pair seems to be ahed in direction of leaf movement by 2.27mm over the length of 20 leaf pairs (200mm in isocenter). Therefore, the vertical readout for the full image takes slightly more than 0.1s.
 |
Apparent tilting of the sliding window and calculation of image readout time. Lenghts are in [mm] at Isocenter distance. Tilting angle is exaggerated by rotating the image. |
When the collimator is rotated by 90°, no tilting is visible. This proves that readout is vertical and the apparent tilting at collimator 0° is an artefact:
 |
29 leaf pairs (1cm leaf width) fit on the imager at SSD140cm when collimator is rotated. |
One effect that is of no importance for basic imaging but which may cause trouble for dosimetric measurements if not taken into account properly is ghosting and scatter. Images acquired after some break show less signal in previously irradiated or non-irradiated areas than images acquired in the middle of a continuous acquisition sequence. During irradiation, scatter in the imaging detector increases the pixel values in areas in the periphery of the detector. Note however that the continuous acquisition mode discussed here is different from the integrating mode used for IMRT fluence image acquisition: continuous acqusition gives a series of static port images, whereas the integrating mode accumulates all frames and displays a single image after treatment is complete.
Here the same sequence is inverted and window level adjusted. One can see that the first frame is darkest, and overall pixel value increases from frame to frame. The interleaf transmission is not visible until the gap has swept over the field once:
 |
Visible increase of signal over acquisition time. |
A region of interest outside the irradiated area is monitored over the 28 frames. Scatter signal increases in waves, depending on the distance to the moving radiation slit.
 |
 |
With increasing frame number (= increasing time) the signal in the periphery increases. The upper image shows the region of interest (blue). The lower image shows the mean pixel value inside the ROI. |