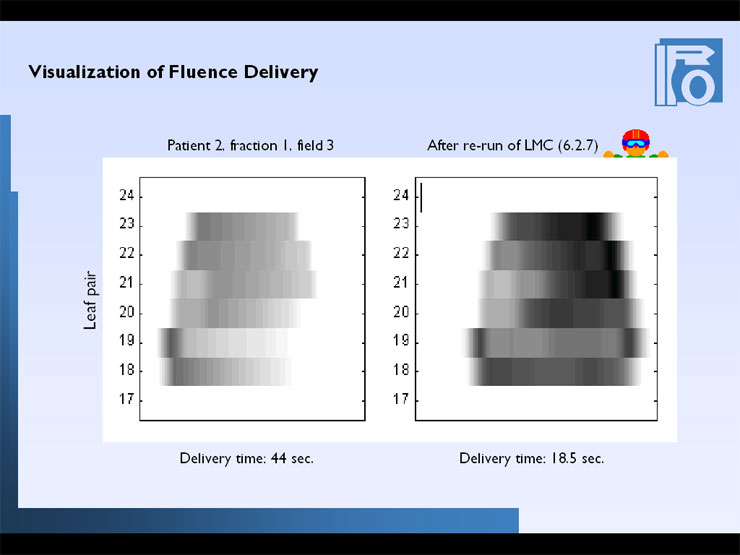
Finally, I want to show you how the logfiles can be used for visualization of fluence delivery. This shows how a film will get darkened by radiation (if we could watch it), again in real time. On the left, calculated from the logfiles of a real patient treatment (planned with CadPlan 6.1) This is the treatment where you saw the rapidly fluctuating dose rate pattern some slides ago. On the right, the same field, recalculated by the newer LMC of CadPlan 6.2. You see the big improvement in treatment time. Again only in the end you can see the effect of the beam holds.
fluence delivery visualization download area