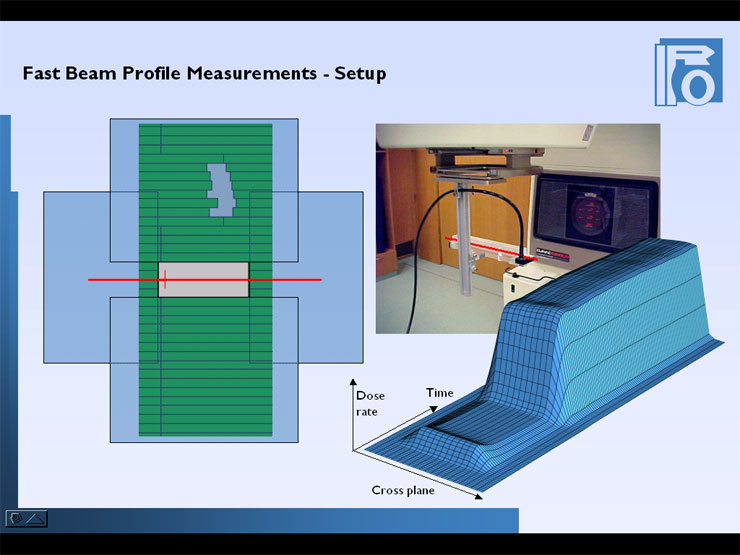
This is a snapshot of a sliding window. First we shifted this to a different location without changing the dose rate behavior. Then we cut a static opening into all shapes of the MLC motion file. The sliding window is covered by the jaws and now the beam profiles can be measured along this line, as a function of time. This is the setup for crossplane measurements. This shows you dose rate during the execution of a sliding window generated with CadPlan 6.2, roughly the first 1.5s of beam, to give you a feeling for the dimensions. The array is capable of measuring 100 profiles per second, so this gives 150 curves for this plot. Important is that doserate reaches the user setting quickly and stays there most of the time.