
A Treatment Planning System (TPS) is usually configured with beam data such as
- beam profiles,
- depth dose curves,
- output factor tables,
which are measured on-site in a large water phantom.
Each TPS has certain requirements regarding the set of field sizes to be measured, the scanning depths, step sizes and so on. If the TPS vendor does not give a recommendation regarding the detector, the choice is up to the Medical Physicist(1).
Looking at the physics of small and large fields in high energy photon beams, one can easily see that it is difficult to select a single detector which measures the beam "as it is" for all field sizes:
- Field penumbra is artificially broadened due to the finite size of the detector. This "volume effect" should be watched out for if the "detector is larger than 1/4th of the lateral field dimension" (taken from the PTW Small Field Dosimetry Application Guide, which can be found on the PTW website).
- Large fields have a significant content of low-energy scattered photons, which increases with depth. The detector should not overrespond to low-energy scattered photons.
- Small fields are characterized by lateral electronic disequilibrium, if the radius of the field is smaller than the mean lateral range of the secondary electrons.
- When fields get smaller, the energy of secondary electrons in the center of the field (the central axis) increases. The lack of low-energy electrons on the central axis is a result of compton scatter, because more electrons are scattered outward and fewer electrons come in from the field edges.
- In large fields, a beam-hardening at the central axis can be observed which is due to the flattening filter. Where the filter has its largest thickness (at the central axis), the photon spectrum is hardest. If a large field size (40 x 40 cm) of high energy (15 MV) is scanned at shallow depths with a detector that overresponds to low energies (diode), relative dose values at large radial positions (where the spectrum is softer) will be too high.
- Scanning depth dose curves down to 30 cm means that local dose rate varies by a factor of 6. The detector should therefore have a low dose-rate dependence.
- In pulsed beams of modern linacs, it is the dose per pulse that counts, not the averade dose rate. Depending on the linac vendor and the pulse generation pattern, nominal (average) dose rates between 100 and 1000 MU/min may have the same dose per pulse (DPP), since they are acheived by variing the pulse frequency, not the dose per pulse. The detector response should not depend on dose per pulse or dose rate.
Semiconductor Issues
Semiconductor detectors like p-type diodes have a very small sensitive volume. This should make them optimal for small field output factor measurements. But silicon is not water-equivalent - its atomic number (Z=14) is higher than the effective atomic number of water. This leads to different problems.
The photoelectric effect, which dominates at low energies, is proportional to Z3. In other words, Silicon over-responds to scattered photons of low-energy due to its high Z and the photoelectric effect.
The 60008 Photon Diode
To shield off the low-energy scattered photons, the PTW 60008 "Photon Diode" is equipped with a small steel cap behind the sensitive semiconductor. The cap is efficiently shielding the detector against low-energy scattered photons in large fields. But for very small fields (1x1 cm), it is reported to lead to an overresponse due to electron backscatter from the metallic cap back into the sensitive volume (M. Schwedas et al., Z. Med. Phys. 17 (2007) 172-179). This artificially increases the 60008-measured output factors in small fields compared to water-equivalent Diamond Detectors or radiochromic film.
The 60012 Electron Diode
For output factor measurements in small fields, the unshielded PTW 60012 "Electron Diode" is a good choice, if neither film nor Diamond are available. The design is similar to the Photon Diode, but the 60012 is unshielded: the metal cap is replaced by a polymer plastic, which eliminates the electron backscatter of the 60008.
The 60012 should only be used for field sizes up to 10x10 cm (when output factor tables are measured, the 60012 should be matched to a large volume ionization chamber at around 4 x 4 cm, see below). For larger fields, the over-response to low-energy scattered photons may lead to a +7% error in the output factor of a 6 MV, 40x40 cm field.
The 31016 PinPoint3D Chamber
Maybe small-volume ionization chambers are the Holy Grail? Rather not. Air-filled chambers like the PinPoint3D (PTW 31016) have a very low signal (4.06 10-10 C/Gy) compared to the 60008 Photon Diode (8.0 10-8 C/Gy), due to their small volume (0.016 cm3). This means that for the same dose, the semiconductor's signal is 200 times stronger! And for large fields, PinPoint chambers have similar problems like the Electron Diode: they overrespond to low-energy photons.
The Liquid Solution?
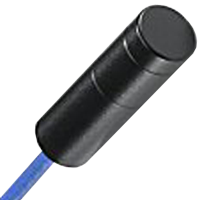
The microLion (micro Liquid Ionization) chamber is a promising new design which may avoid all these problems. Its sensitivity is quite high (approx. 10-8 C/Gy), and it is nearly water equivalent. Therefore the perturbation of the field should be low.
In a series of experiments, the microLion chamber shall be compared to established detectors such as
- the 31002 ionization chamber (0.125 cm3)
- the 31016 PinPoint3D chamber
- the 60008 Photon Diode
- the 60012 Electron Diode (only output factors)
- the 34001 Roos chamber (only depth dose curves)
with respect to
- beam penumbra
- output factors
- depth dose curves.
Furthermore, the following question shall be adressed: "Which detector should be used for the different tasks, if complete beam data for the Eclipse TPS (Anisotropic Analytical Algorithm, AAA) have to be measured?"
On the PTW website they once had a detector comparison chart. In April 2009 it contained the following information:
| Property | 31002 | PinPoint | microLion | Diamond | 60008/60012 |
|---|---|---|---|---|---|
| Radiation Quality | PH & EL | PH | PH | PH & EL | PH/EL |
| Field Size [cm] | 2 … 40 | 2 … 30 | 1 … 20 | 1 … 20 | 1 … 40 |
| Spatial Resolution | o | + | ++ | + | ++ |
| Low Energy Depend | o | o | o | ++ | -- |
| Dose Rate Depend. | + | ++ | + | o | o |
| Temperature Depend. | ++ | ++ | o | + | o |
| Dose Stability | ++ | ++ | + | o | - |
++: advantageous, --: disadvantageous
In August 2011, the contents on the PTW site were found to be a little bit different (changes with respect to the 2009 table are printed in bold):
| Property | 31002 | PinPoint | microLion | Diamond | 60016/60017 |
|---|---|---|---|---|---|
| Radiation Quality | PH & EL | PH | PH | PH & EL | PH/EL |
| Field Size [cm] | 3 … 40 | 2 … 30 | 1 … 20 | 1 … 20 | 1 … 40 |
| Spatial Resolution | - | o | + | o | ++ |
| Low Energy Depend. | ++ | ++ | o | o | -- |
| Dose Rate Depend. | ++ | ++ | o | o | + |
| Temperature Depend. | ++ | ++ | o | + | o |
| Dose Stability | ++ | ++ | + | o | - |
It is reasonable that new detector models (60016/60017) have different ratings than older designs (60008/60012). A new model number means a change in design, whatever the change is. But there are also some differences between the two tables for the same detectors. It looks like (even within PTW) such ratings are not time-independent(2)! So don't take them too seriously.
Here, we want to present our own view regarding the pros and cons of different detector types. Special attention shall be paid to the new microLion chamber, because only few publications exist on the 31018 (see literature on the side bar).
Beam Penumbra
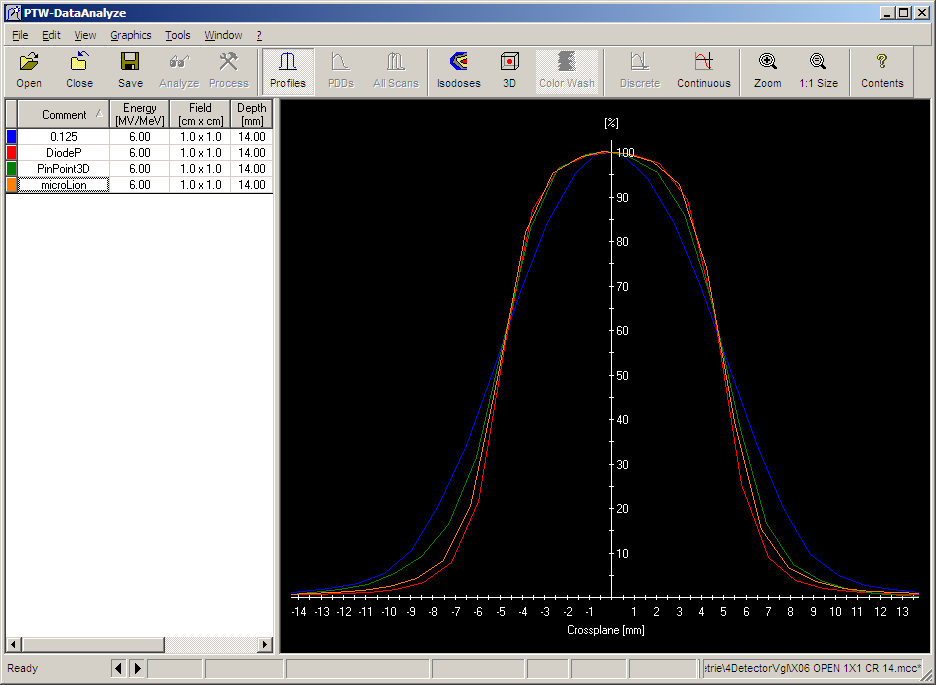
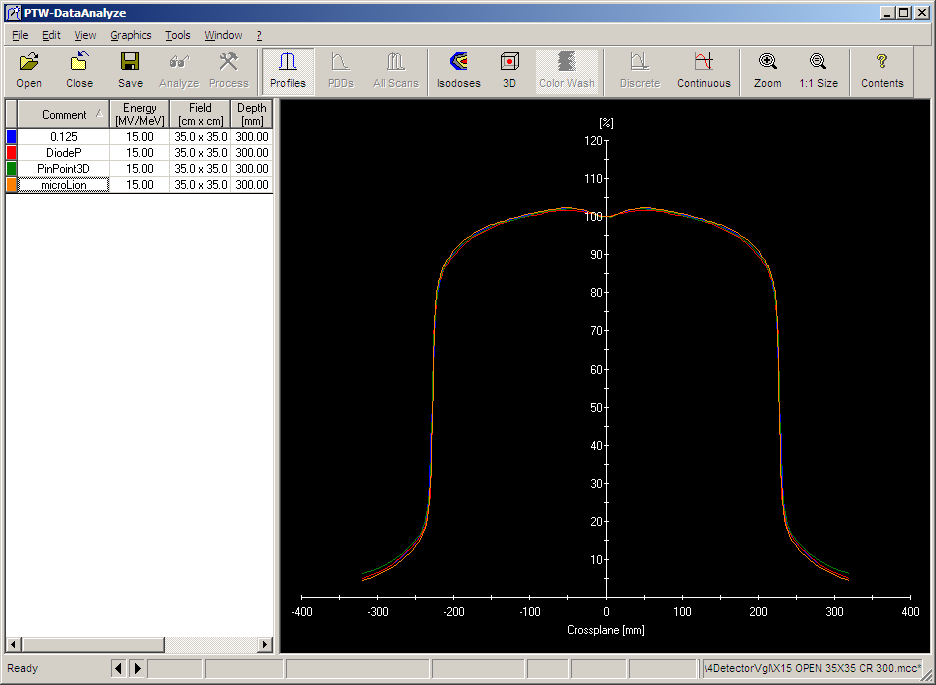
The penumbra width of an open beam is mainly related to detector size. Cross profiles were measured in the MP3 water phantom for three different field sizes. The SSD was 100 cm. The 31018 microLion chamber and the 60008 Photon Diode were irradiated with the detector axis parallel to the beam axis, the other two chambers were irradiated radially.
The following chart shows the 80%/20%-penumbra widths for a 6MV photon beam. Profiles were measured in dose maximum (14 mm depth). Step size in the penumbra region was 1 mm. A plot of the 1x1 cm scans can be found here.
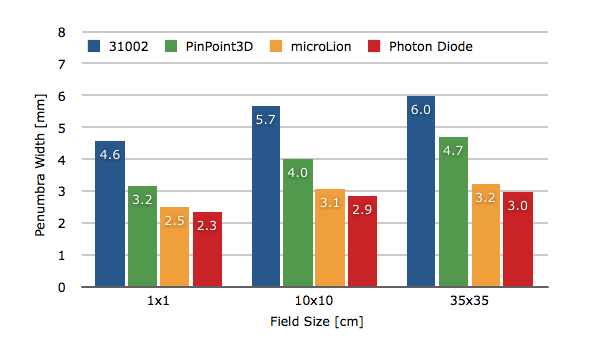
As expected, the 31002 chamber gives the widest penumbra due to the largest volume effect of all detectors. The 31016 PinPoint3D has a cubic volume (2.9 mm length, 2.9 mm diameter), therefore the orientation with respect to the beam should have no impact on penumbra width. The microLion chamber has a sensitive volume of 2.5 mm diameter and 0.35 mm thickness which is larger than the dimensions of the Photon Diode's semiconductor disk (1x1 mm, 2.5 µm thick). This explains the results.
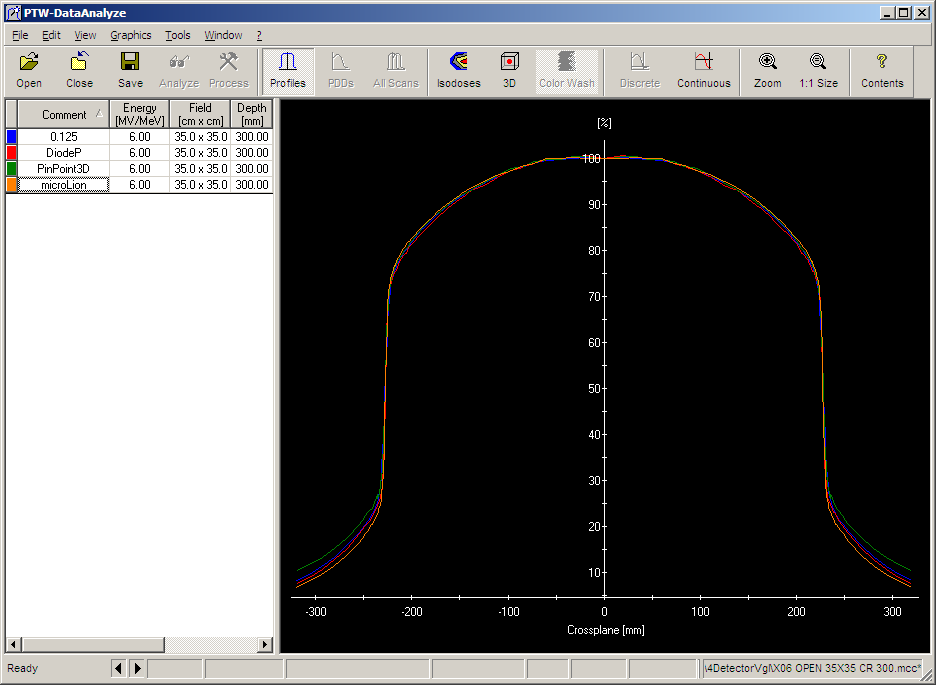
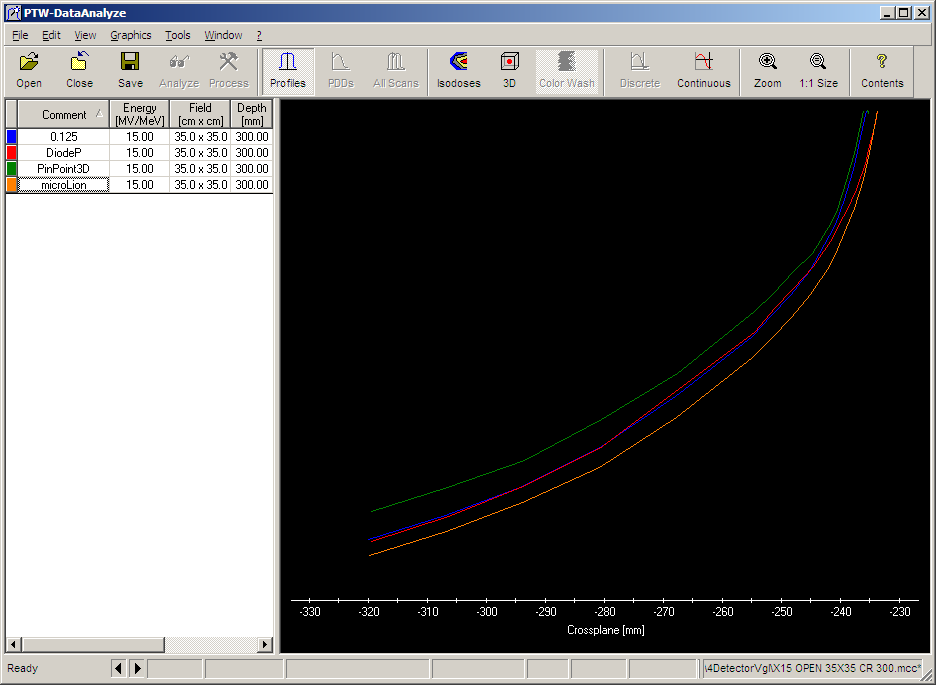
Scatter increases with depth and field size. Here are the measured penumbra widths for three 6MV field sizes and 300 mm depth:
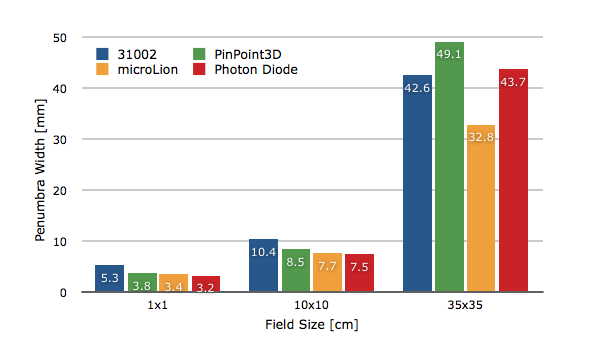
For the largest field, it's the microLion chamber that gives the sharpest penumbra, not the Photon Diode. This can also be seen in the tails of the 6MV scans. The microLion's response to low-energy scatter seems to be the lowest of all.
The same can be observed for 15MV (here is a zoom into the tail region). This is one of the reasons why PTW recommends the PinPoint3D only for the field sizes (2x2) cm2 … (30x30) cm2. The upper field size limit should probably be even smaller. On the other hand, the microLion behaves very "friendly" in the tails, but its recommended useful range is stated as (1x1) cm2 … (20x20) cm2 by PTW.
Flattening Filter
Depending on the linac and the design of the flattening filter, the central depression in the beam profile, which is usually only relevant for the high photon energy and shallow depths, is more or less pronounced. If beam profiles are to be measured correctly, both the detector volume and the scanning step size must not be too large. Otherwise, the region around the central axis is not accurately reproduced. For the Eclipse configuration, Varian recommends profile step intervals of 2.5mm or smaller.
The following plot shows the effect of detector size for a 15MV, 35x35 cm beam measured in dmax and normalized to CAX. The red line is the profile measured with the 31002 chamber. The central "V" is wider than for the other detectors, due to the volume effect - the length of the sensitive volume in scanning direction for the 31002 is 6.5mm.
This is to show that small size detectors are recommended for profiles not only because of the field edge.
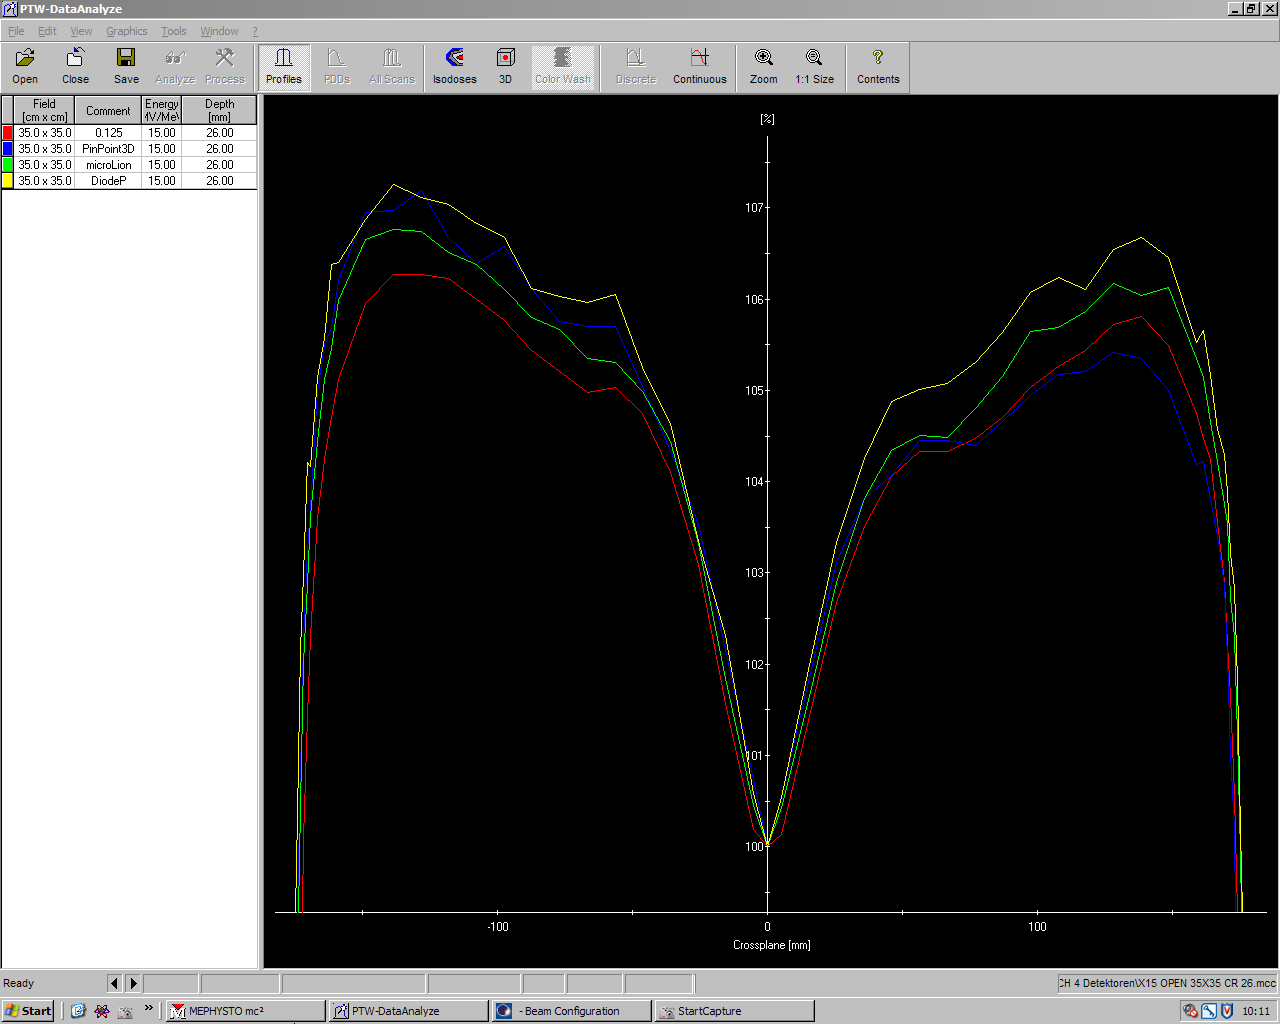
Also visible in the graph is the cable effect of the PinPoint 3D (blue curve): the left half of the profile is much higher than the right half. This is caused by the greater irradiated cable length when the chamber is on the left (the cable comes from the right side).
The highest off-axis values are measured with the 60008 (yellow). This is probably due to its energy dependence: off-axis, the spectrum is softer than at the center, where the flattening filter hardens the beam. Since the profiles are normalized to CAX, this effect "pushes up" the yellow curve.
Output Factors
Output Factor (OF) tables describe the machine output relative to the 10x10 reference field under certain geometrical conditions. For the Eclipse TPS, the tables have to be measured for a number of field sizes under full scatter conditions in the large water phantom.
The design of a detector not only has an impact on penumbra width, but also on the measured output factors, here for six different detector types and 6MV:
Values were measured isocentrically in 10 cm depth on a Varian Clinac 2300C/D.
There are printable PDF documents with the absolute OF values for 6MV and 15MV.
6MV raw data: 31002, 31003, 31016, 31018, 60008 and 60012.
15MV raw data: 31002, 31003, 31016, 31018, 60008 and 60012.
Constructing a Hybrid Output Factor Curve
Let's assume that an output factor table should be filled from 1x1 cm to 40x40 cm. This can't be done with a single detector.
Assuming square fields, artificial ("hybrid") output factor curves can be constructed by using two detectors and a cross-calibration point.
Following the discussion in M. Schwedas et al., Z. Med. Phys. 17 (2007) 172-179, for small fields we would use the 60012 (the unshielded Electron Diode). For larger fields, the 31002 thimble chamber is the gold standard. The output factors of these two detectors are cross-calibrated a certain small reference field (SRF).
The size of the SRF can be found by looking at the quotient of the output factors OF(60012)/OF(31002). Ideally, at the SRF the field size dependence of the quotient should vanish or at least be low.
For field sizes S < SRF, we expect the volume effect of the 31002 (which decreases its signal) to dominate the quotient, which should consequently go up as field size decreses. For larger field sizes S > SRF, the overresponse of the unshielded diode to low energy scattered photons should dominate, again increasing the quotient. Therefore, at SRF, the field size dependence of OF(60012)/OF(31002) should have a local minimum.
The exact size of the SRF may be different for 6MV and 15MV. The higher the energy, the higher the range of scattered photons. Therefore, SRF is expected to be larger for 15MV than for 6MV.
There could also be a dependence on measuring depth. Since we don't want to make things too complicated, we restrict the analysis to an isocentric setup with 10 cm measuring depth.
In the following plot, OF(Detector)/OF(31002) is drawn for the six detectors. Energy is 6MV:
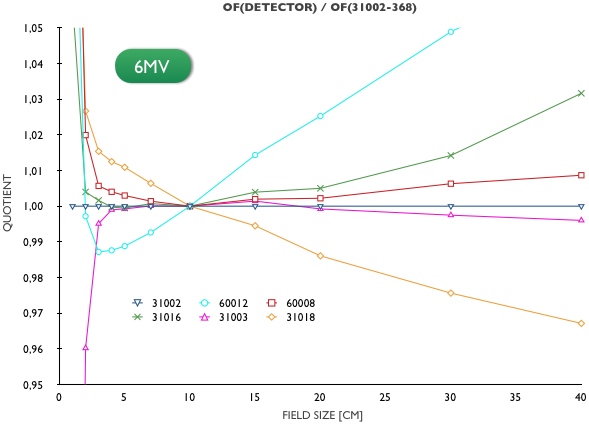
The cyan curve OF(60012)/OF(31002) has a minimum at 3x3 cm. This is the ideal SRF size for cross-calibration of the 60012 to the 31002 at 6 MV. See the detailed 6MV data table.
The procedure for 15 MV results in a SRF size of 4x4 cm (15MV data table):
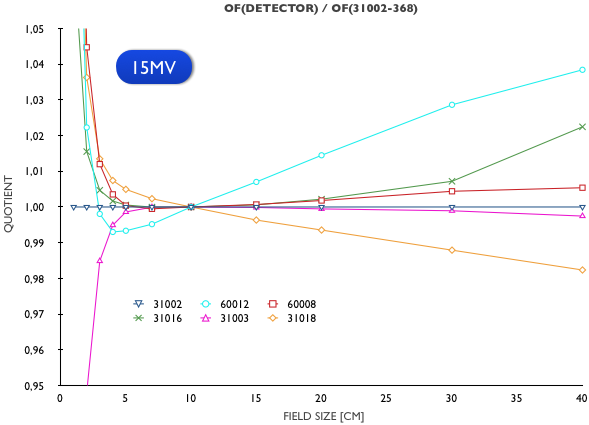
It looks like with the given rule, no clear cross-calibration point can be found for the 31018.
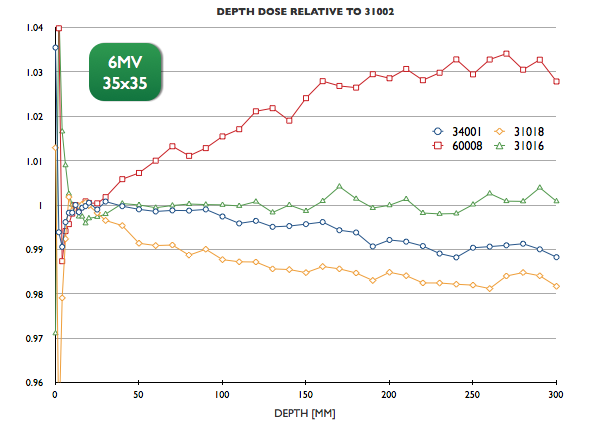
Depth Dose Comparisons
Depth dose (DD) curves were measured with a constant SSD of 100 cm down to a depth of 300 mm. Except for the Roos, the detectors were set up with the Trufix holder system (see side bar for details).
We selected the 31002 ionization chamber as reference, although detectors with a clearly defined and static effective point of measurement are generally recommended (see discussion below).
The following graph shows the 6MV 35x35 cm depth dose relative to the reference:
PDF reports for the 6MV energy are available for the field sizes 1x1 cm, 3x3 cm, 10x10 cm, 20x20 cm and 35x35 cm.
For the 15MV energy we measured the same field sizes: 1x1 cm, 3x3 cm, 10x10 cm, 20x20 cm and 35x35 cm.
The 1x1 field is not measured with the 34001 (Roos), because the chamber's sensitive volume (diameter: 24 mm) would only be irradiated partially. Due to the divergence of the beam, the fraction of the irradiated chamber volume gets larger as depth increases. This also distorts the curve. The same is true for the 31002 to some extent, but for the sake of consistency we kept this chamber as reference even for the 1x1 field.
Preliminary Discussion
So far, we think that every detector type should have a certain area where it excells. Otherwise, there is no good reason to use it or to buy it in the first place. Except that you are a detector collector, of course!
The microLion it is a very good small-volume detector with a fascinating design. But when to use it?
Regarding beam penumbra, the 60008 and the 31018 nearly give the same results. The diode is somehow easier to use, because no high-voltage power supply is needed.
If one follows IAEA recommendations, depth dose curves are the domain of parallel-plate detectors (see IAEA TRS 398, 6.7.1, p.78), or, with other words, the Realm of the Roos. For small fields (< 5x5 cm), where the Roos volume would be only irradiated partially, the 60008, the 31016 or the 31018 are a good choice. Note that for large fields the 60008 should not be used because it overresponds to low-energy scatter, which can be seen in the 6MV depth dose curves for the field sizes 20x20 cm and 35x35 cm.
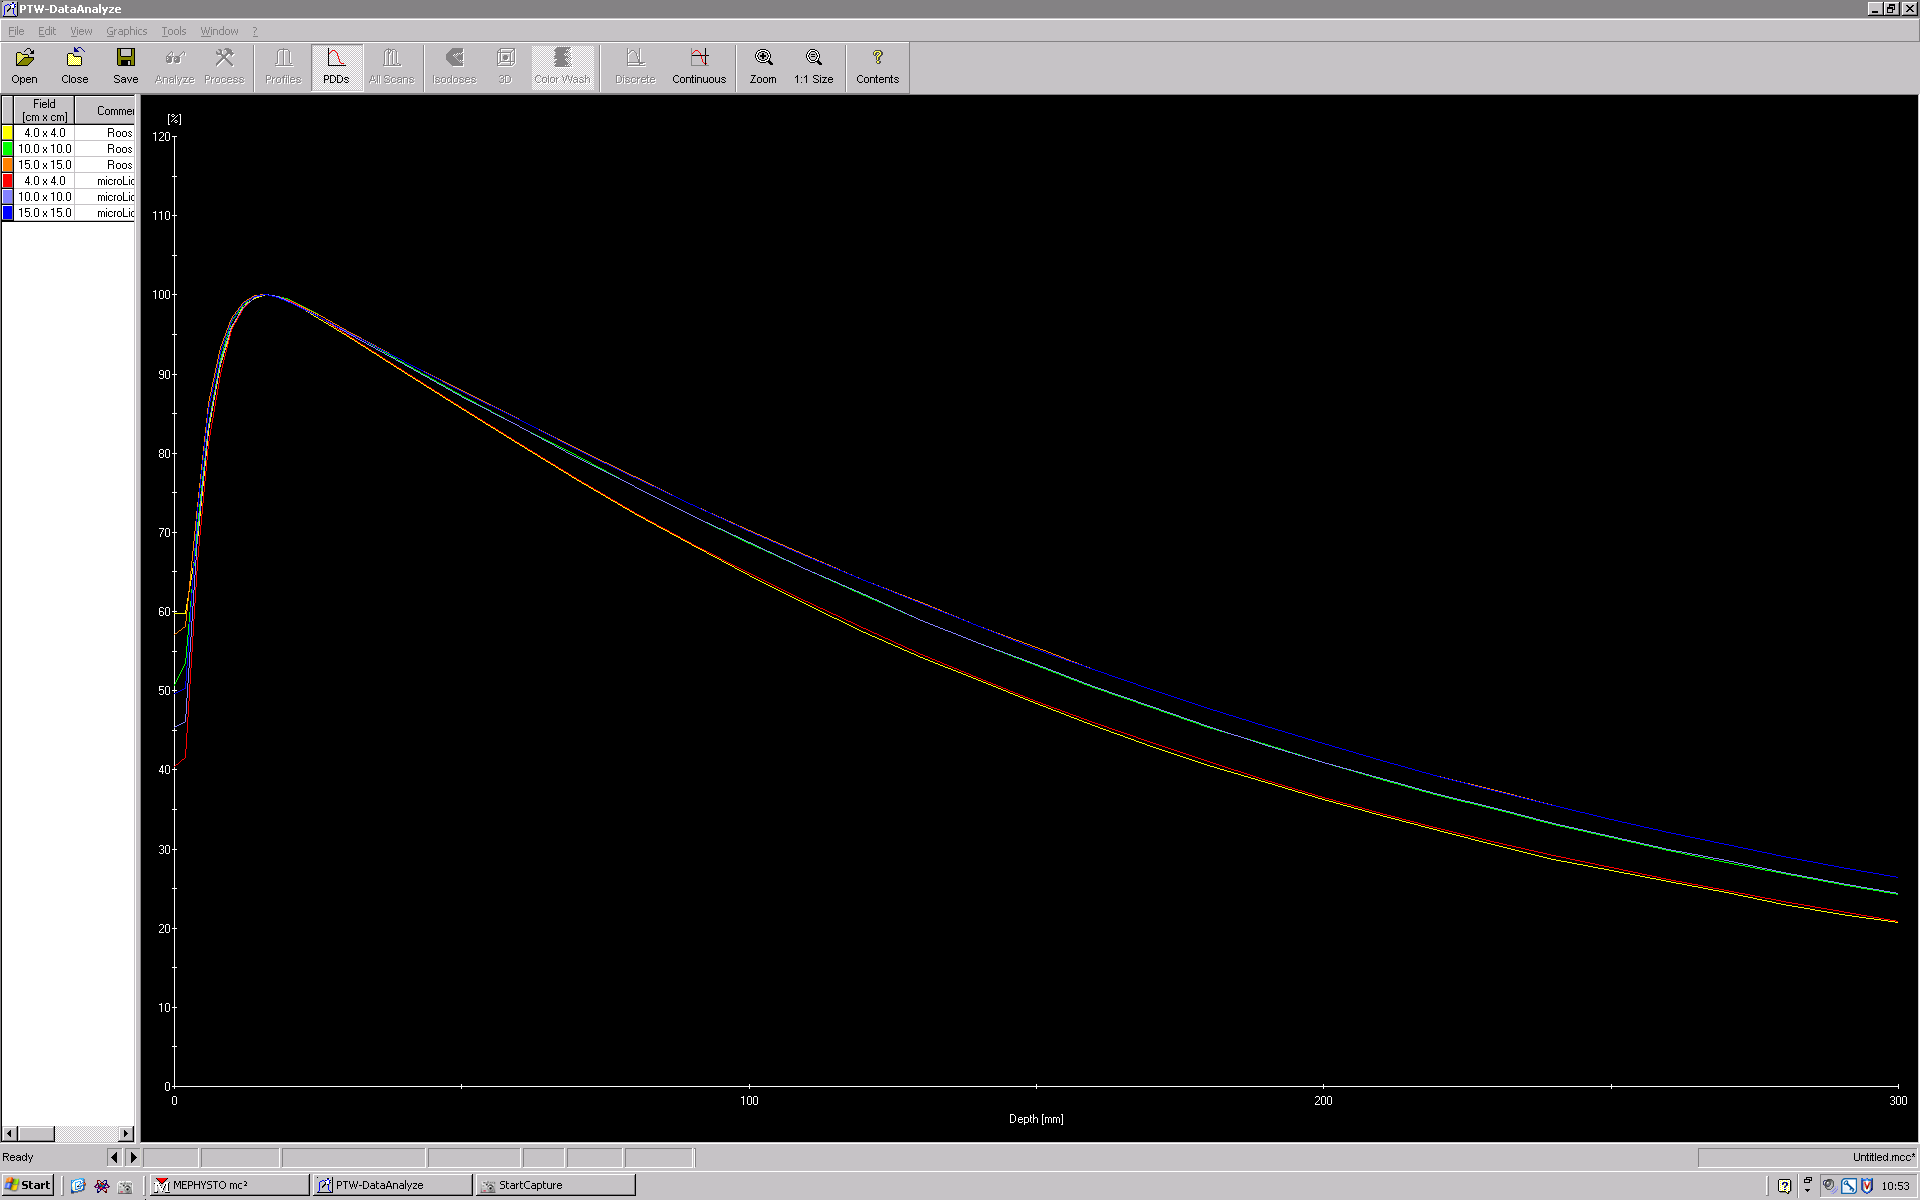
Depth dose curves of hard wedged fields are also required for Eclipse beam configuration. One could hypothesize that a small volume and a clearly defined effective point of measurement are advantageous because the hard wedge produces a fluence gradient across the chamber which might influence the curve. But the Roos can also be used for wedged beams, with the same field size limits as for open beams. This screenshot compares the Roos and the 31018 in a 6 MV 60° Hard Wedge beam for three different field sizes (4x4, 10x10, 15x15). They are practically identical. The same holds for 15MV, where the equivalence starts at 5x5 cm.
Output factors, to complete the beam data requirements, have one gold standard for large fields: the 31002 (0.125 cm3). For small fields, the volume effect can be avoided by using small volume detectors after a cross-calibration procedure. Only three detectors can be used down to 1x1 cm: the 60012, the 31018 and, according to literature, the Diamond. Between 3x3 and 10x10, we measured the lowest output factors with the 60012 and the highest with the 31018. For large fields, the order is reversed.
As mentioned in the Schwedas paper, the 60008 diode overresponds for very small field sizes (1x1, 2x2cm, red line with squares in the plots above). The behavior of the other detectors are influenced by the physical effects already mentioned (volume effect etc.).
What about the PinPoint3D? The low signal-to-noise ratio makes it slightly harder to measure smooth curves (this can be compensated to some extent by increasing the linac rep rate, e.g., using 600MU/min instead of 300). The overresponse to low-energy photons has to be considered. If the PinPoint is irradiated radially, profiles of larger fields sometimes show poor symmetry due to the cable effect which we found can be quite disturbing. Axial irradiation is the solution. Unfortunately, there is no Trufix holder for axial irradiation of the PinPoint3D, but a similar holder (e.g. from the 60008) can be chosen. When mounting the chamber upright in the MP3 water phantom, the effective point of measurement has to be determined by the user. We found that putting zero depth at 2 mm from the tip of the chamber is a good choice.
Small air-filled volumes reach their limit with the PinPoint design. This is why microLion designs are a promising idea.
Our recommendation matrix for Eclipse beam data looks like this (the SRF can be taken from the OF analysis and may depend on photon energy):
| Beam Data (Field Size S) | 31002 | 31016 | 31018 | 34001 | 60008 | 60012 |
|---|---|---|---|---|---|---|
| DD, Open Field (S < SRF) | ++ | ++ | ++ | |||
| DD, Open & Wedge (S ≥ SRF) | +(3) | ++ | ++ | ++ | + | |
| Profiles, Open Field (S < SRF) | ++ | ++ | ++ | |||
| Profiles, Open & Wedge (S ≥ SRF) | +(4) | ++(5) | ++ | ++ | ||
| OF, Open Field (S < SRF) | + | ++ | ||||
| OF, Open & Wedge (S ≥ SRF) | ++ | + |
++: recommended, +: still OK
In the table, "Wedge" means Hard Wedge.
(1)For Eclipse, there exists only a global recommendation: "It is recommended to use an ionization chamber for all beam data measurements for the source model." (Eclipse Algorithms Reference Guide, B502679R01A, March 2010, p.46).
(2)This is probably the reason why the comparison chart was removed from the PTW website around Sep 2011.
(3)Non-ideal behavior in the build-up region caused by the volume effect.
(4)The impact of detector size on the resulting beam model is a little indirect for model-based algorithms like the AAA. When the AAA is configured, the Configuration Program first reads a library of machine parameters. This gives a set of machine-specific model parameters. The AAA Configuration Program then optimizes the parameter values of the initial beam model by matching the calculated beam data with the (processed) measured beam data. This takes about 15 min on an 8-core workstation (AAA 8.6). Here the detector plays a role: if the 31002 is used for profile measurements, the measured penumbras are relatively wide, but the calculated beam model will still have sharper beams compared to the measurements. On the other hand, if the 60008 is used for the profiles, the calculated penumbras will be wider than the measured ones. However, when the two resulting beam models are compared, the 60008-model will still be "sharper" than the 31002-model.
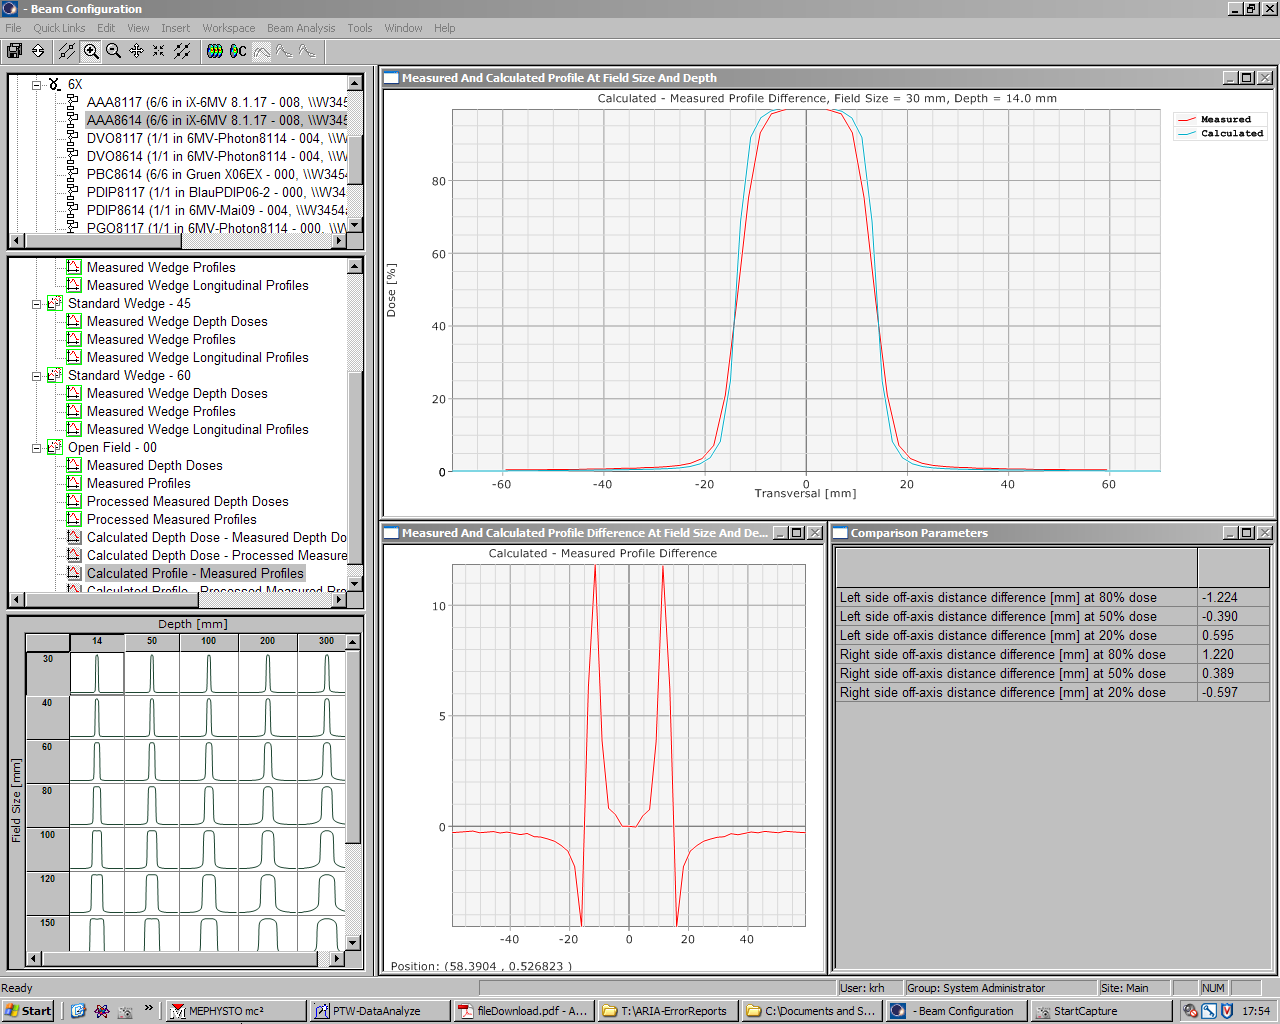
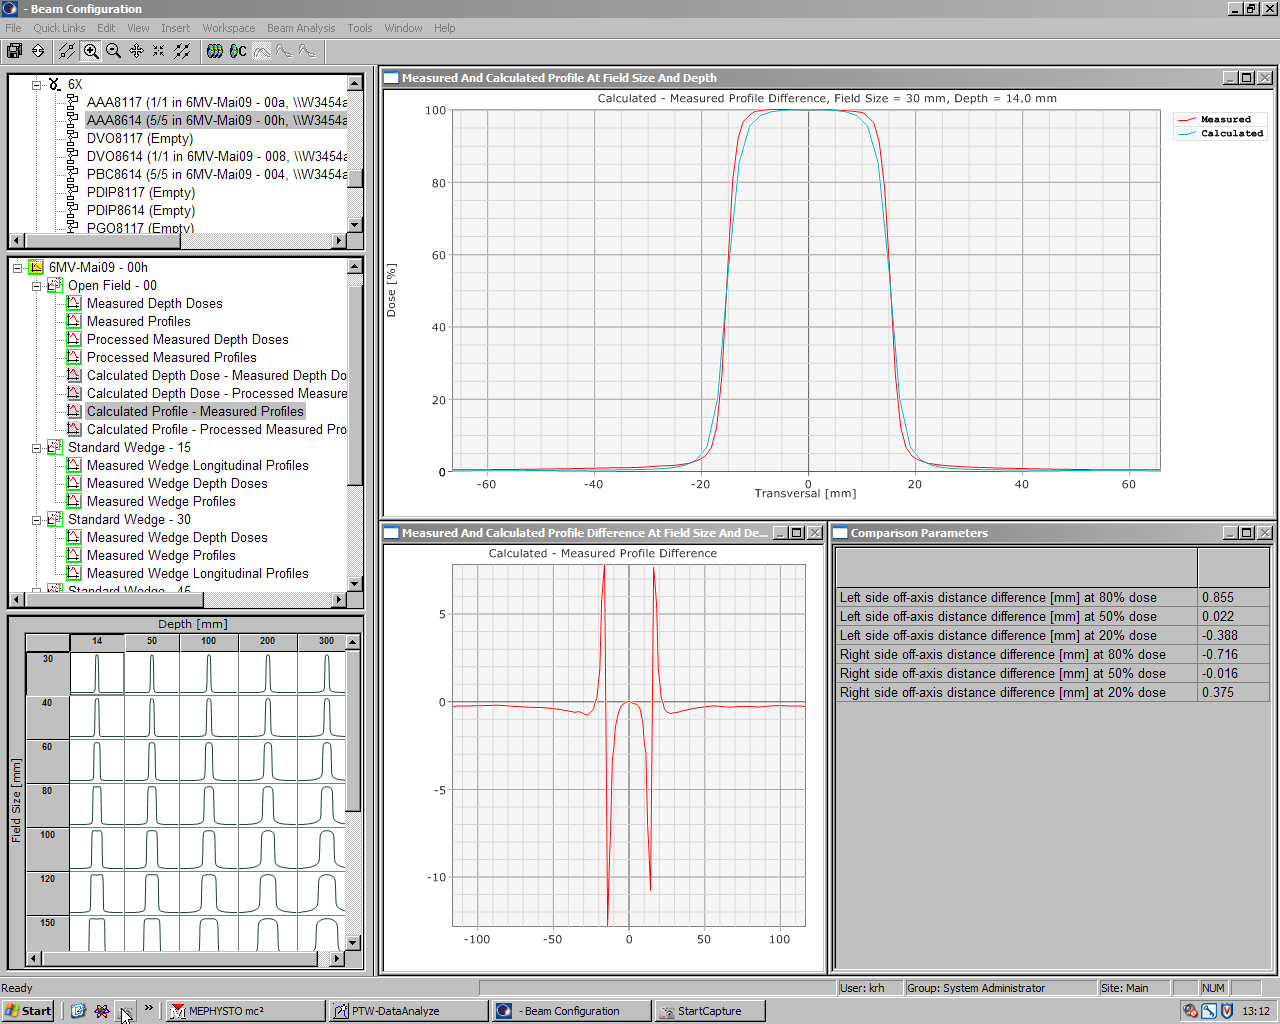
(5)If cable effect is kept under control.