The LFC is a program written in C that reads in the two DynaLog files and an additional input file with control parameters and then does various things depending on these parameters:
The LFC's output are data files that have to be imported by other software (like Mathematica) for graphical display of the data.
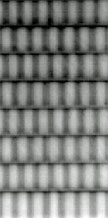
To test the calculation accuracy of the software, I designed a sensitive test-DVA and exposed a film while recording the DynaLog files of the same treatment. Then the pattern visible on the film shall be compared to the true fluence calculated with the true leaf positions from the DynaLog files.
The DVA looks like this:
The planned leaf gap is 1mm for all leaf pairs. It cannot be expected that this gap is held constant during the treatment. The monitor units were calculated to give a planned leaf speed of 3cm/s which is out of range. Therefore, hold-offs occur. On the film, a faint pattern of vertical stripes can be seen. When the exposed film is scanned with a lookup table that enhances this faint pattern, it looks like this:
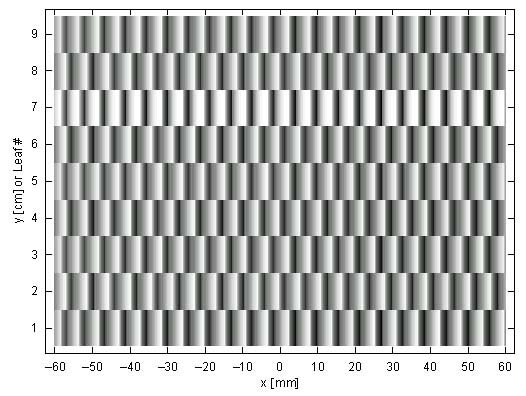
The LFC calculation on the other hand gives such a pattern for the true fluence:
In the following composite image, film and log are matched. Each leaf is split up: the upper half shows the pattern from the log, the lower half the film pattern.
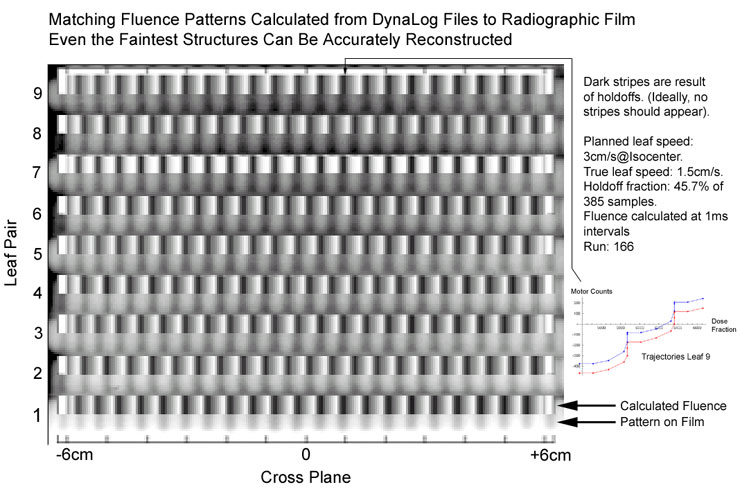
This proves the calculation accuracy of the LFC.
I define the error fluence as the difference between the true and the planned fluence. With the LFC, simply two arrays have to be substracted from each other. I sometimes normalize this resulting array to the maximum point fluence found anywhere in the planned fluence matrix, if relative values (error fluence in percent of maximum planned fluence) are requested.
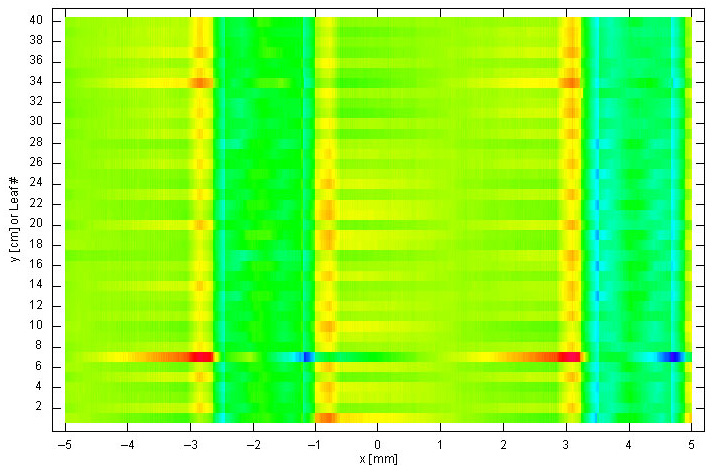
The result can be color encoded and plotted in Mathematica. For a pattern similar to the one shown above, the following plot of the error fluence was obtained:
Different colors show different error levels. Absolute values with the normalization just mentioned are hard to interpret. Other normalizations like pointwise comparisons of fluence pixels lead to infinite results if planned fluence values are zero. So I better leave the color bar with the percent values away. An error fluence of 3% does not say much to me, anyway.
The big advantage of such calculations is, that the resolution in leaf direction (x) can be chosen arbitrarily, if the trajectories are properly interpolated:
With the animation feature of the LFC, one can generate movies that show how the error fluence is imprinted on film in real time:
The leaves cannot be seen directly, but it is not hard to guess where they are. Leaves are forced to go very fast, the occurrence of hold-offs starts about in the middle of the film. The left half of the film is irradiated more smoothly.
If one has a theory about when hold-offs are generated, one can try to reconstruct the reason for them (exactly at which time which leaf triggered a hold-off). If the theory is correct, one should end up with the same hold-off pattern as can be found in the DynaLogs, but with the additional information about the leaves that triggered them. This can be visualized, here for a DynaLog file from a patient treatment:
The only thing that can be seen is the tip of the leaf when it should trigger a hold-off (because the leaf is too far off its planned trajectory or if a closed leaf pair has opened too much, which seems to be the rule for an outdated MLC controller software version).
Here I have to admit that I got similar "guessed" hold-off patterns but not exactly the same. Obviously the rules that lead to hold-offs are too complex to be guessed.
LFC (LogFileCalculator) is ©2001 by Harald Krauss
back to DMLC home