Calculation Grid Effects with AAA and the seven29 - The "Problem"
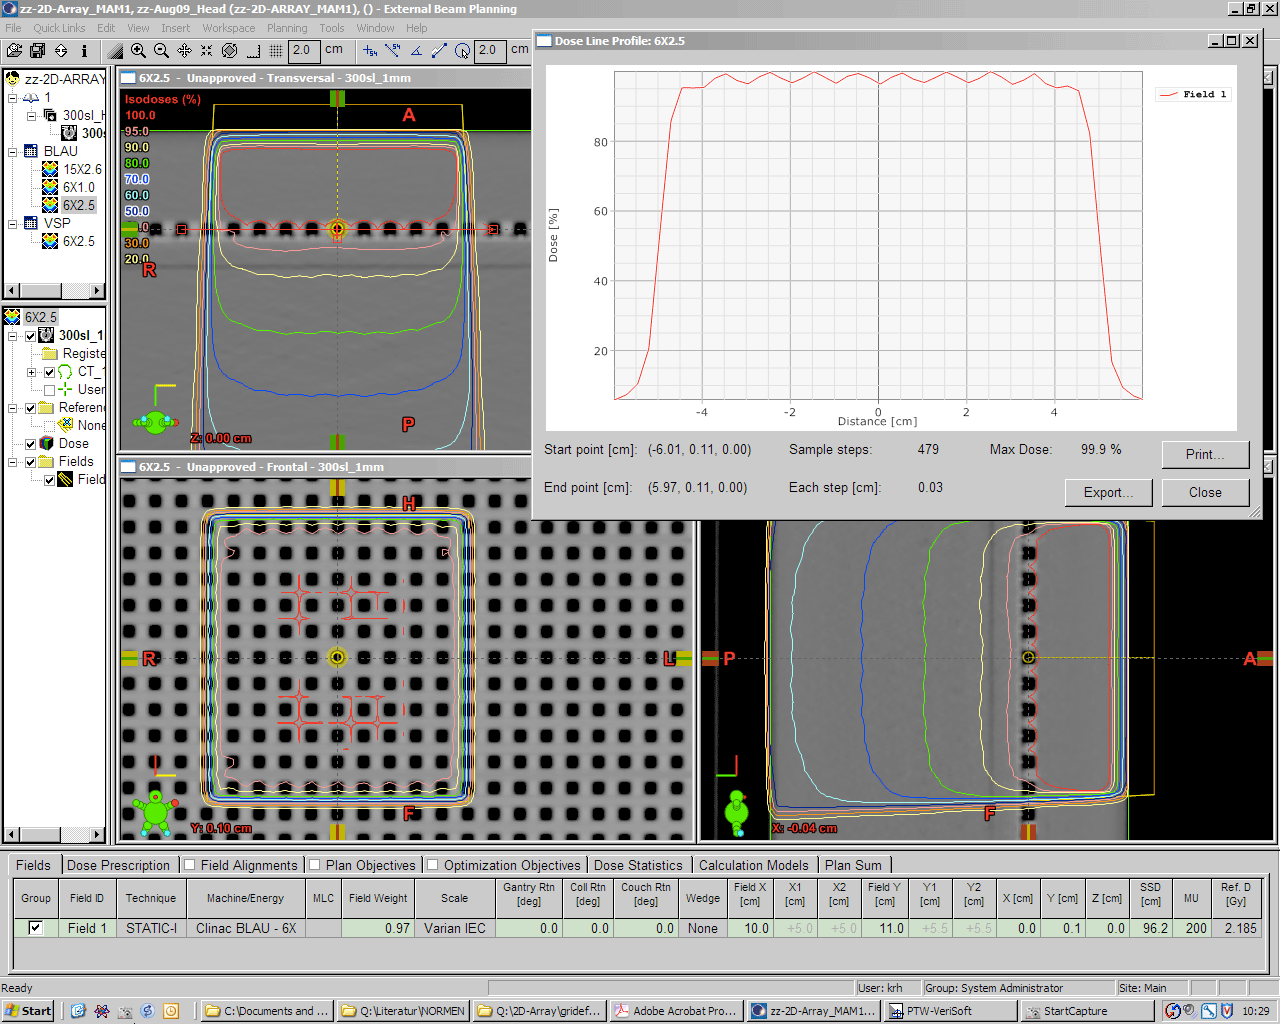
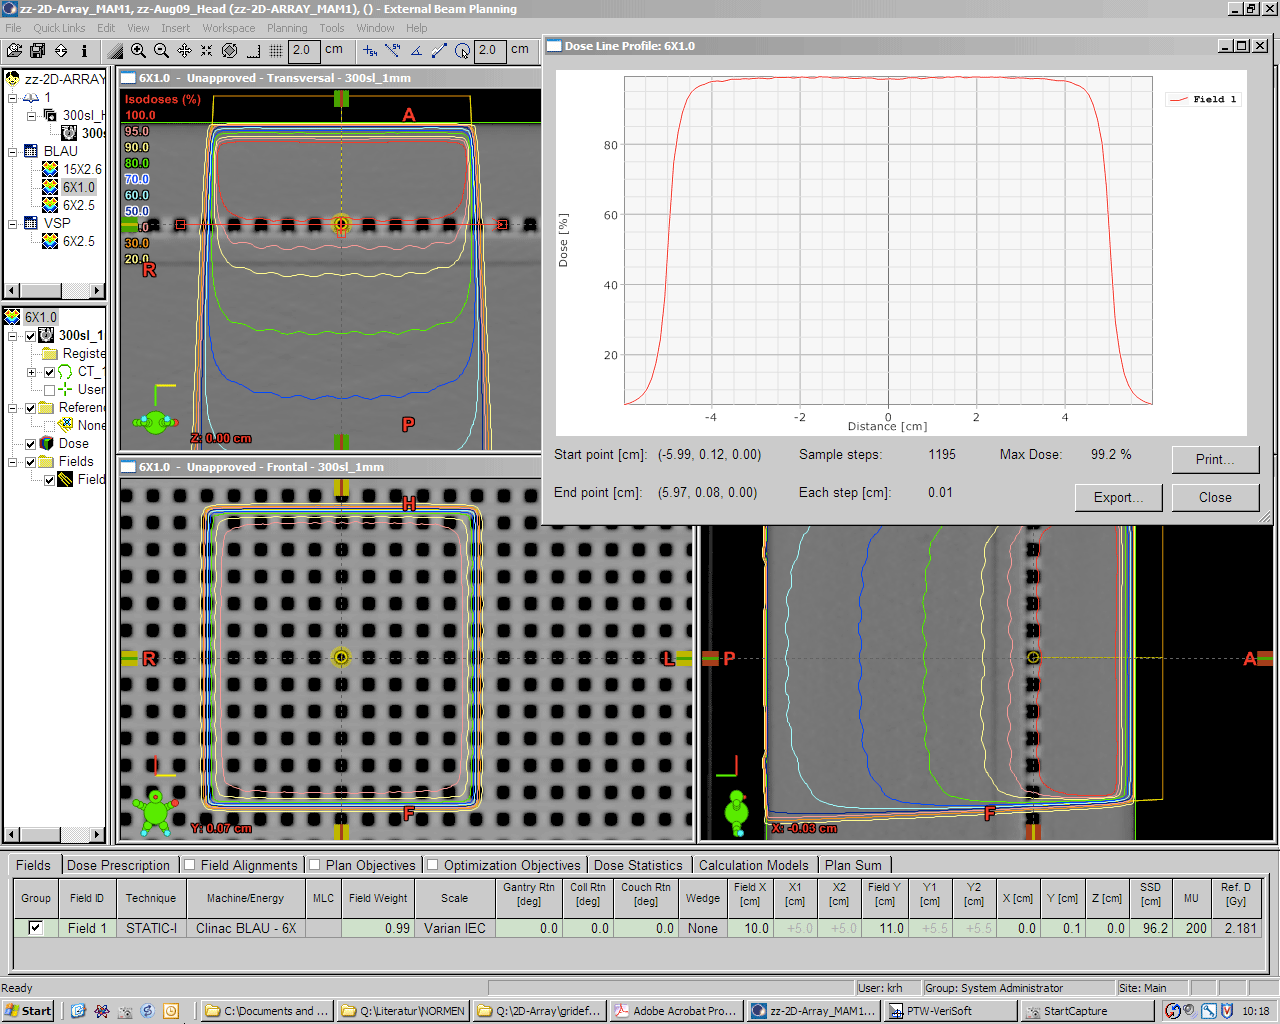
When Eclipse calculates dose inside the 2D-ARRAY with a calculation grid size of 2.5 mm, the flattened region of a horizontal dose profile has the form of a wave:
(click to enlarge)
The chosen grid size is the Eclipse default setting. AAA is version 8.6.14.
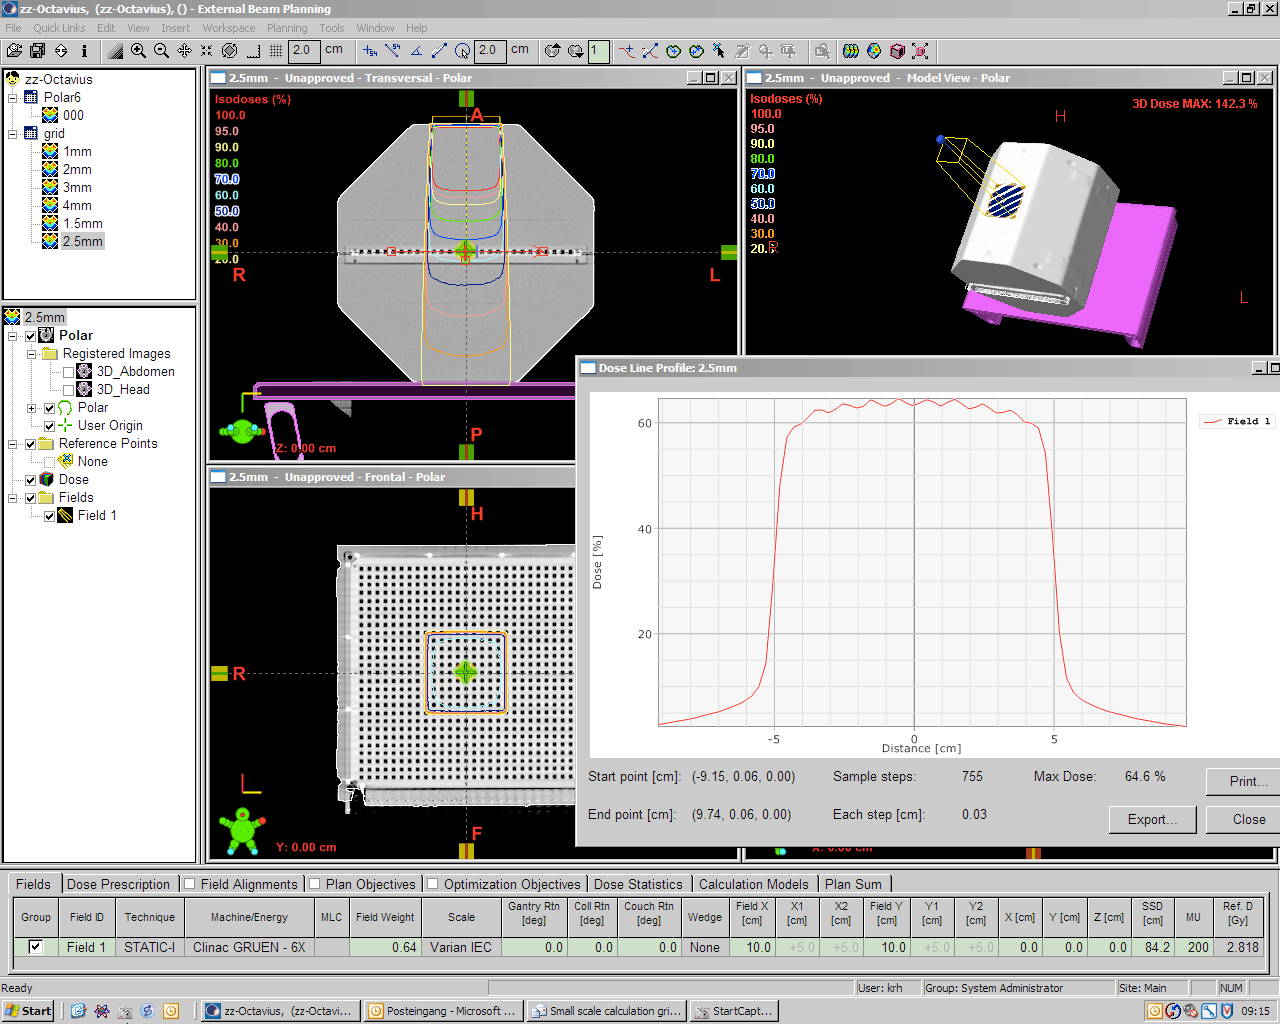
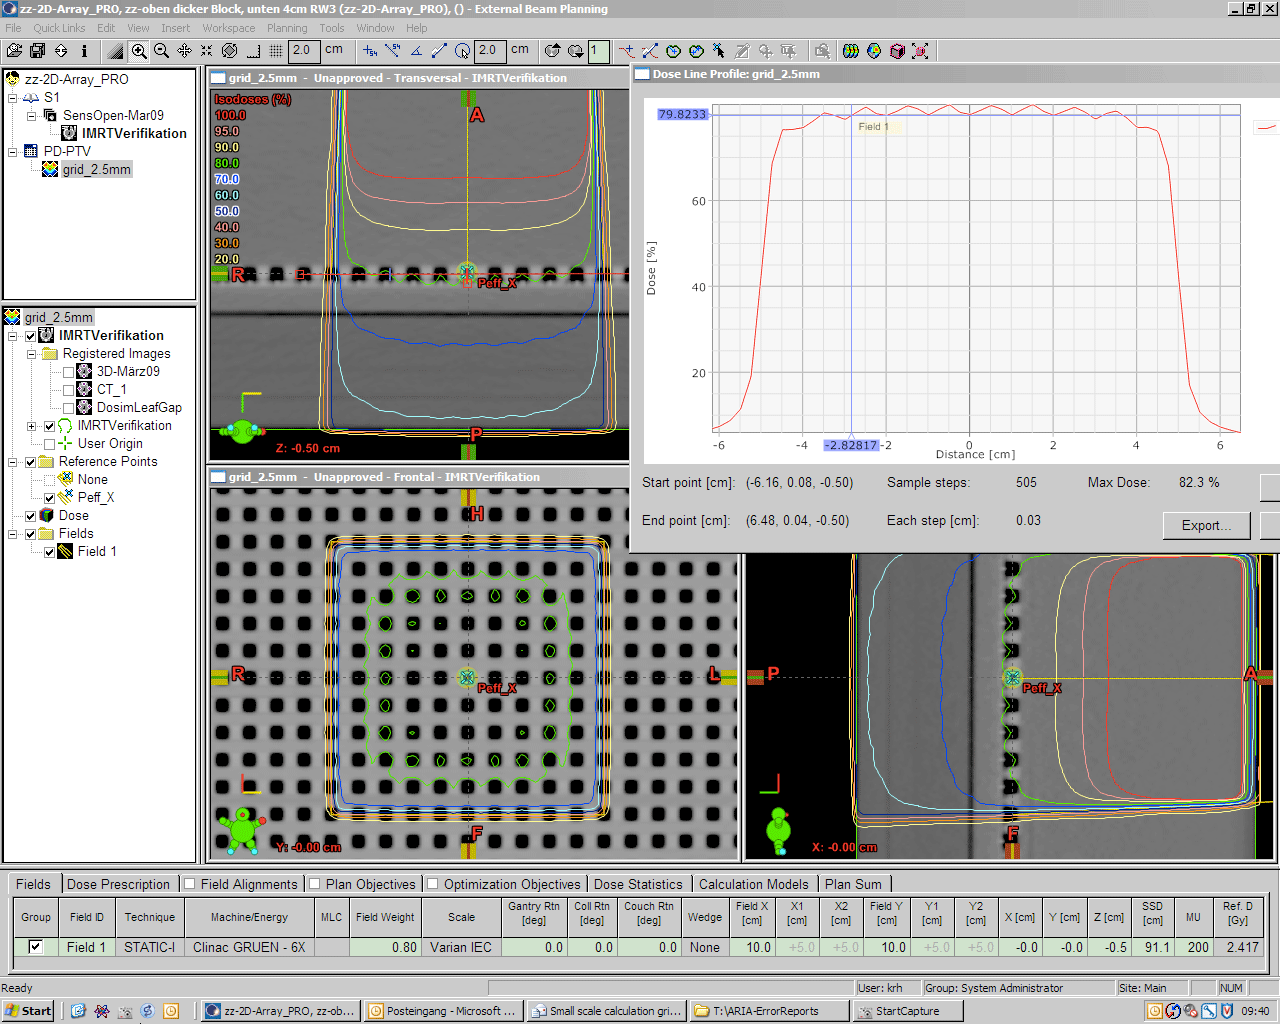
Here are two more setups with the Octavius phantom (depth of reference plane: 16 cm), and another setup with a 8.8 cm block of PMMA on top of the ARRAY. All setups show the same effect.
Dose values inside the air cavities are always lower than between chambers. The difference is about 2%. The air cavities are cubic with the dimensions 5x5x5 mm.
Implications for IMRT Verification
When the ARRAY is used for IMRT verification, in principle there are two options:
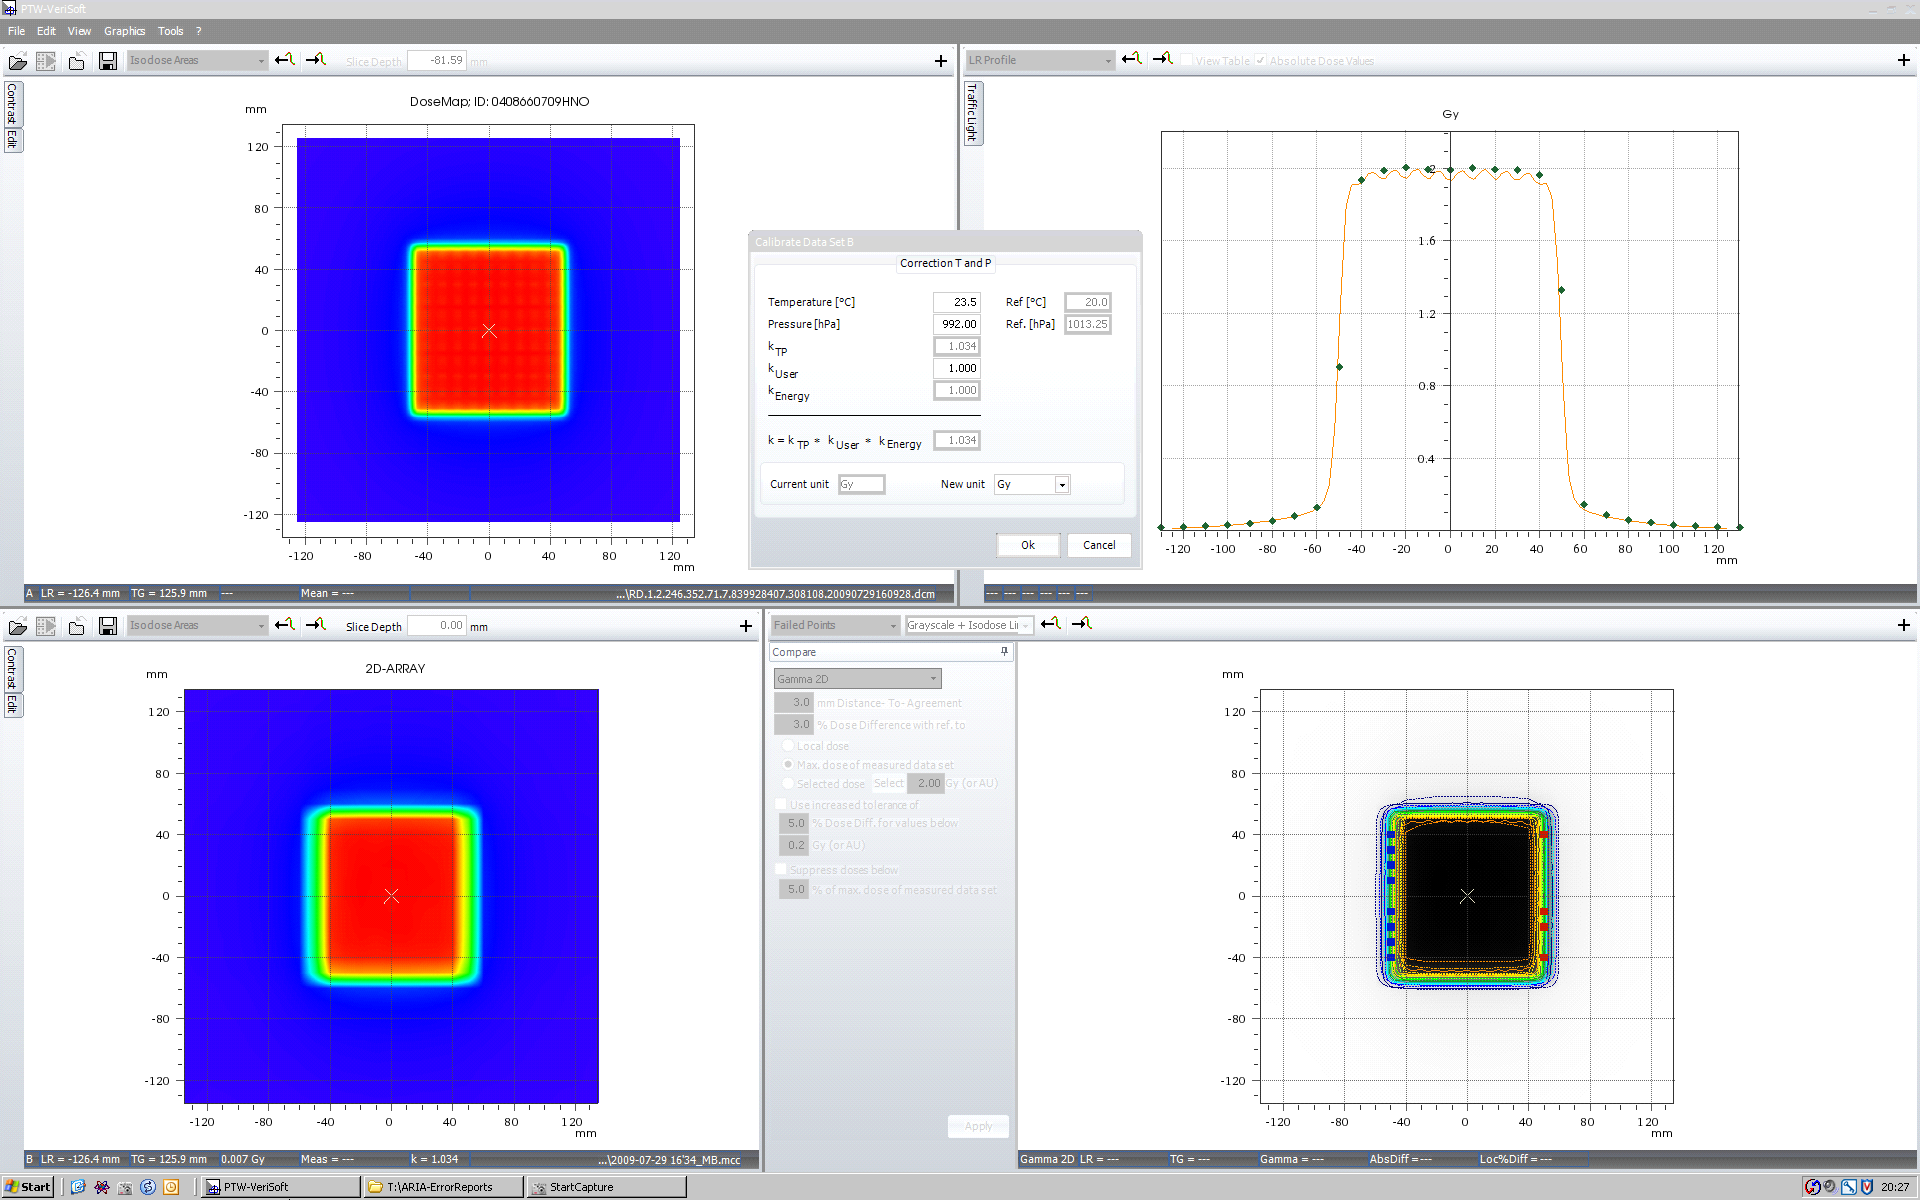
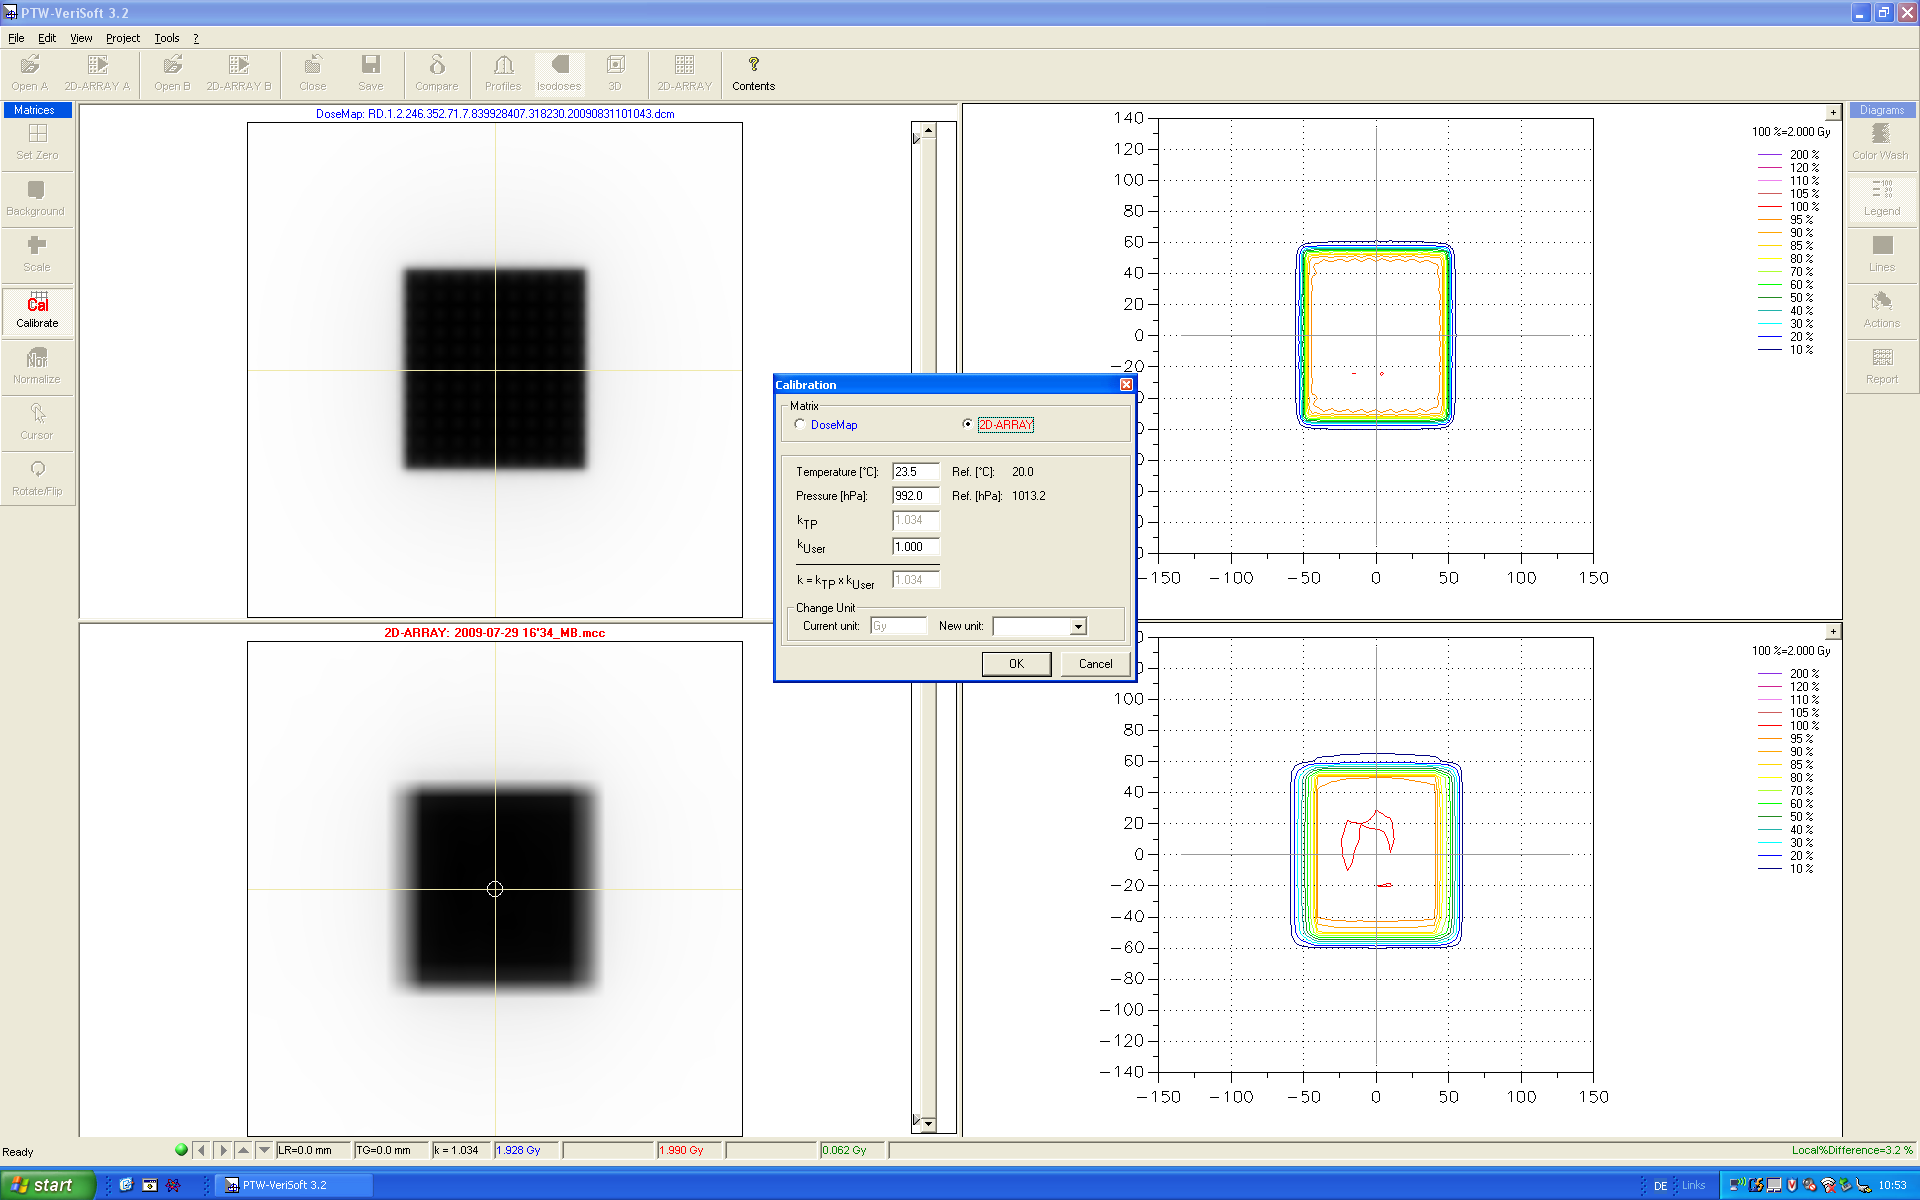
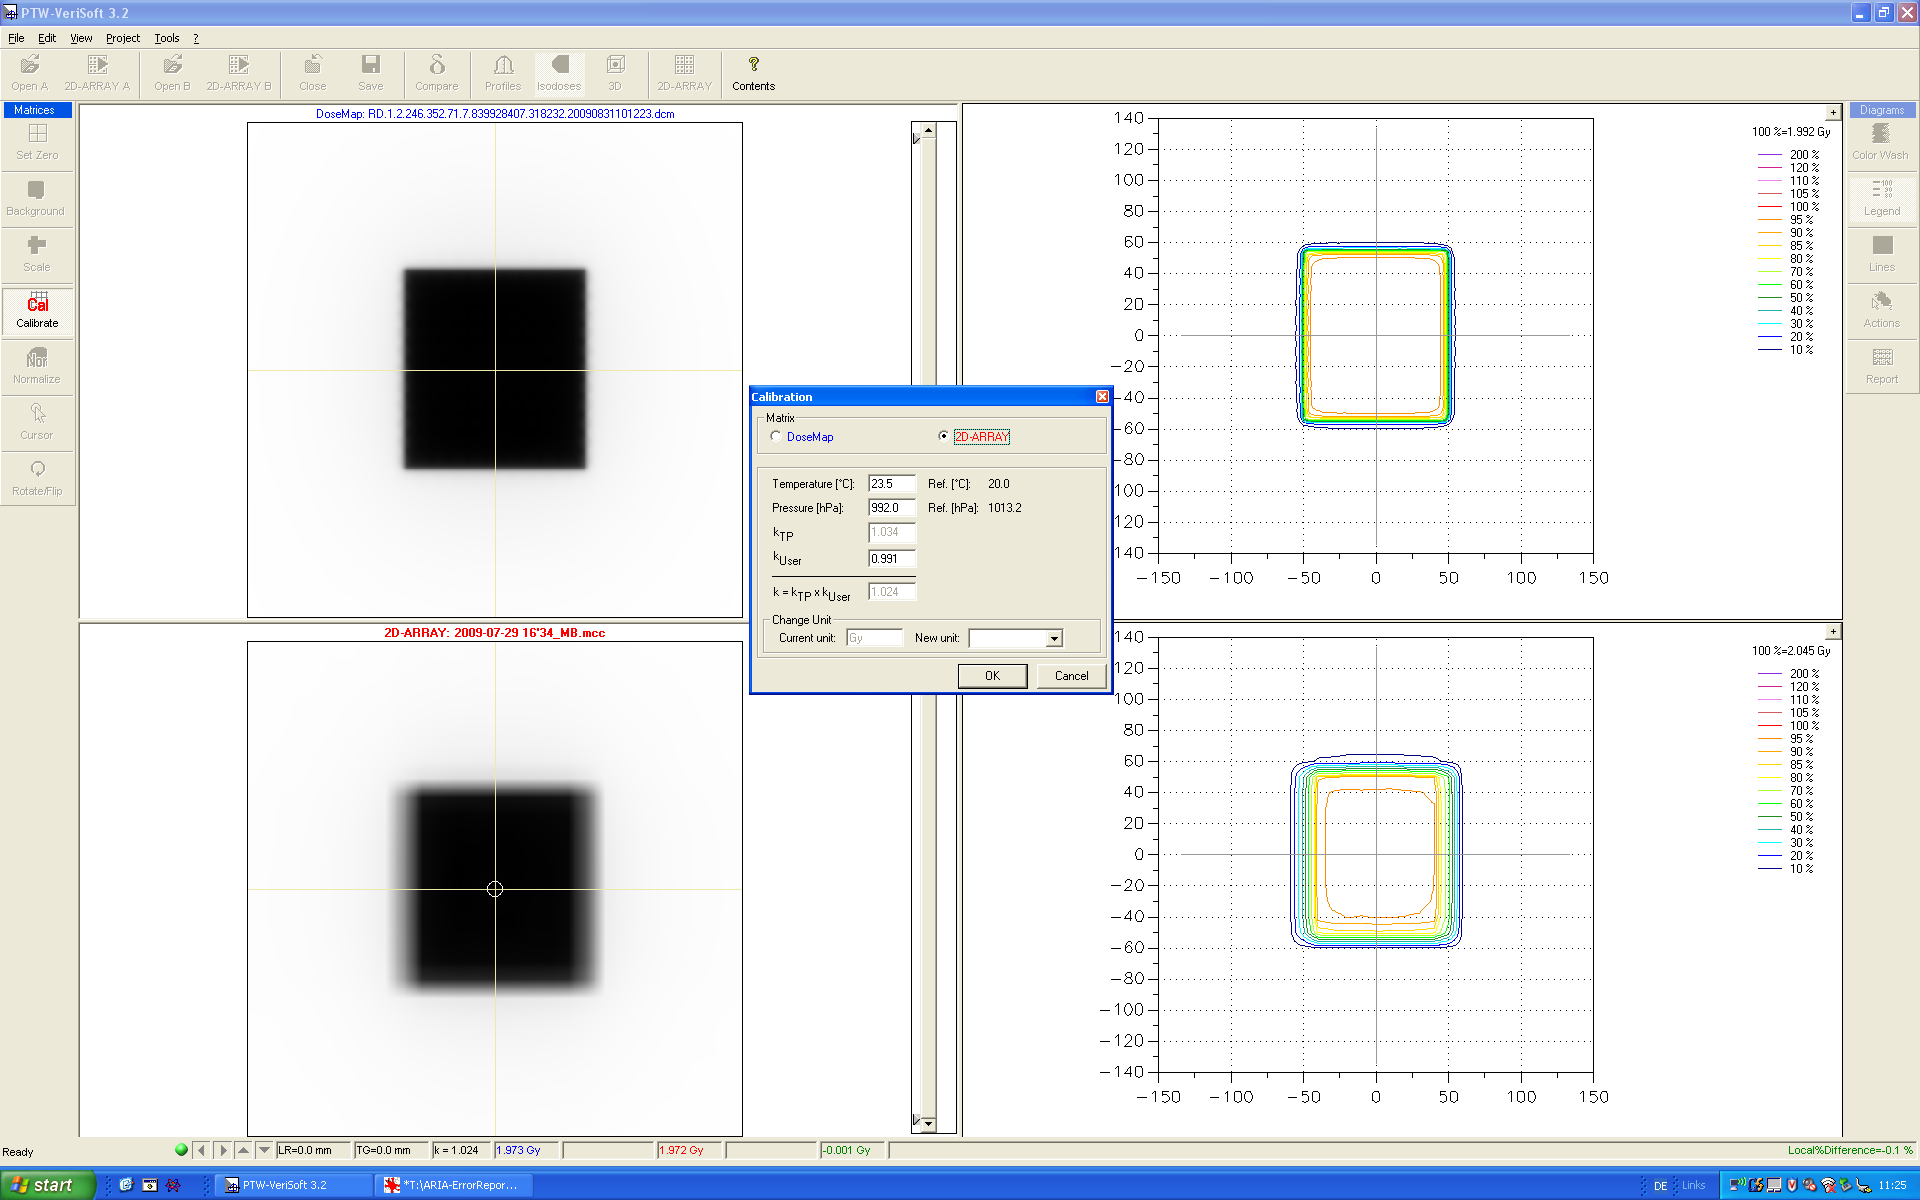
- One can measure absolute dose, which means that correction factors for air density kTP and beam quality kEnergy are applied. The 60Co calibration factor of the ARRAY is always used, since the calibration file is always loaded. A third correction factor, kUser can be used for other corrections. The raw ARRAY measurement is multiplied by k = kTP * kUser * kEnergy.
- One can measure against a reference field. A reference field, usually 10x10, is calculated in the TPS on a CT scan of the phantom. By comparing calculated and measured dose, kUser is determined. This kUser is applied to the IMRT measurement in the same session.
We prefer the latter approach, because all corrections are combined in a single factor, e.g., small daily output fluctuations of the linac. We are not interested in them. They are subject to linac QA.
Here is a screenshot of VeriSoft 4.0 with the various k factors:
(click to enlarge)
How is agreement between a measured and a calculated reference field defined?
The reference field, in contrast to any IMRT field, is regular and symmetric. Usually, one concentrates on the central axis.
Agreement could mean:
- The central pixel value in the calculated dose matrix matches the measured central chamber value.
- A larger area (e.g., 5x5 cm) is evaluated and kUser determined to give minimum deviation over this ROI.
- It is not a point dose of the calculated matrix that is used for comparison, but the dose averaged over the 5x5 mm chamber area(s) of one (or multiple) chamber(s).
The last two options became possible with VeriSoft 4.0. As you will see, there is a range of over 2% for the resulting kUser depending on the method used. And the beforementioned grid effect plays an important role.
Remember: The grid is in the calculation. The ARRAY-measurement is always the same.
Remark: we always export the dose matrix from Eclipse with 512x512 px, size 27x27 cm.
Finding kUser with 2.5 mm grid
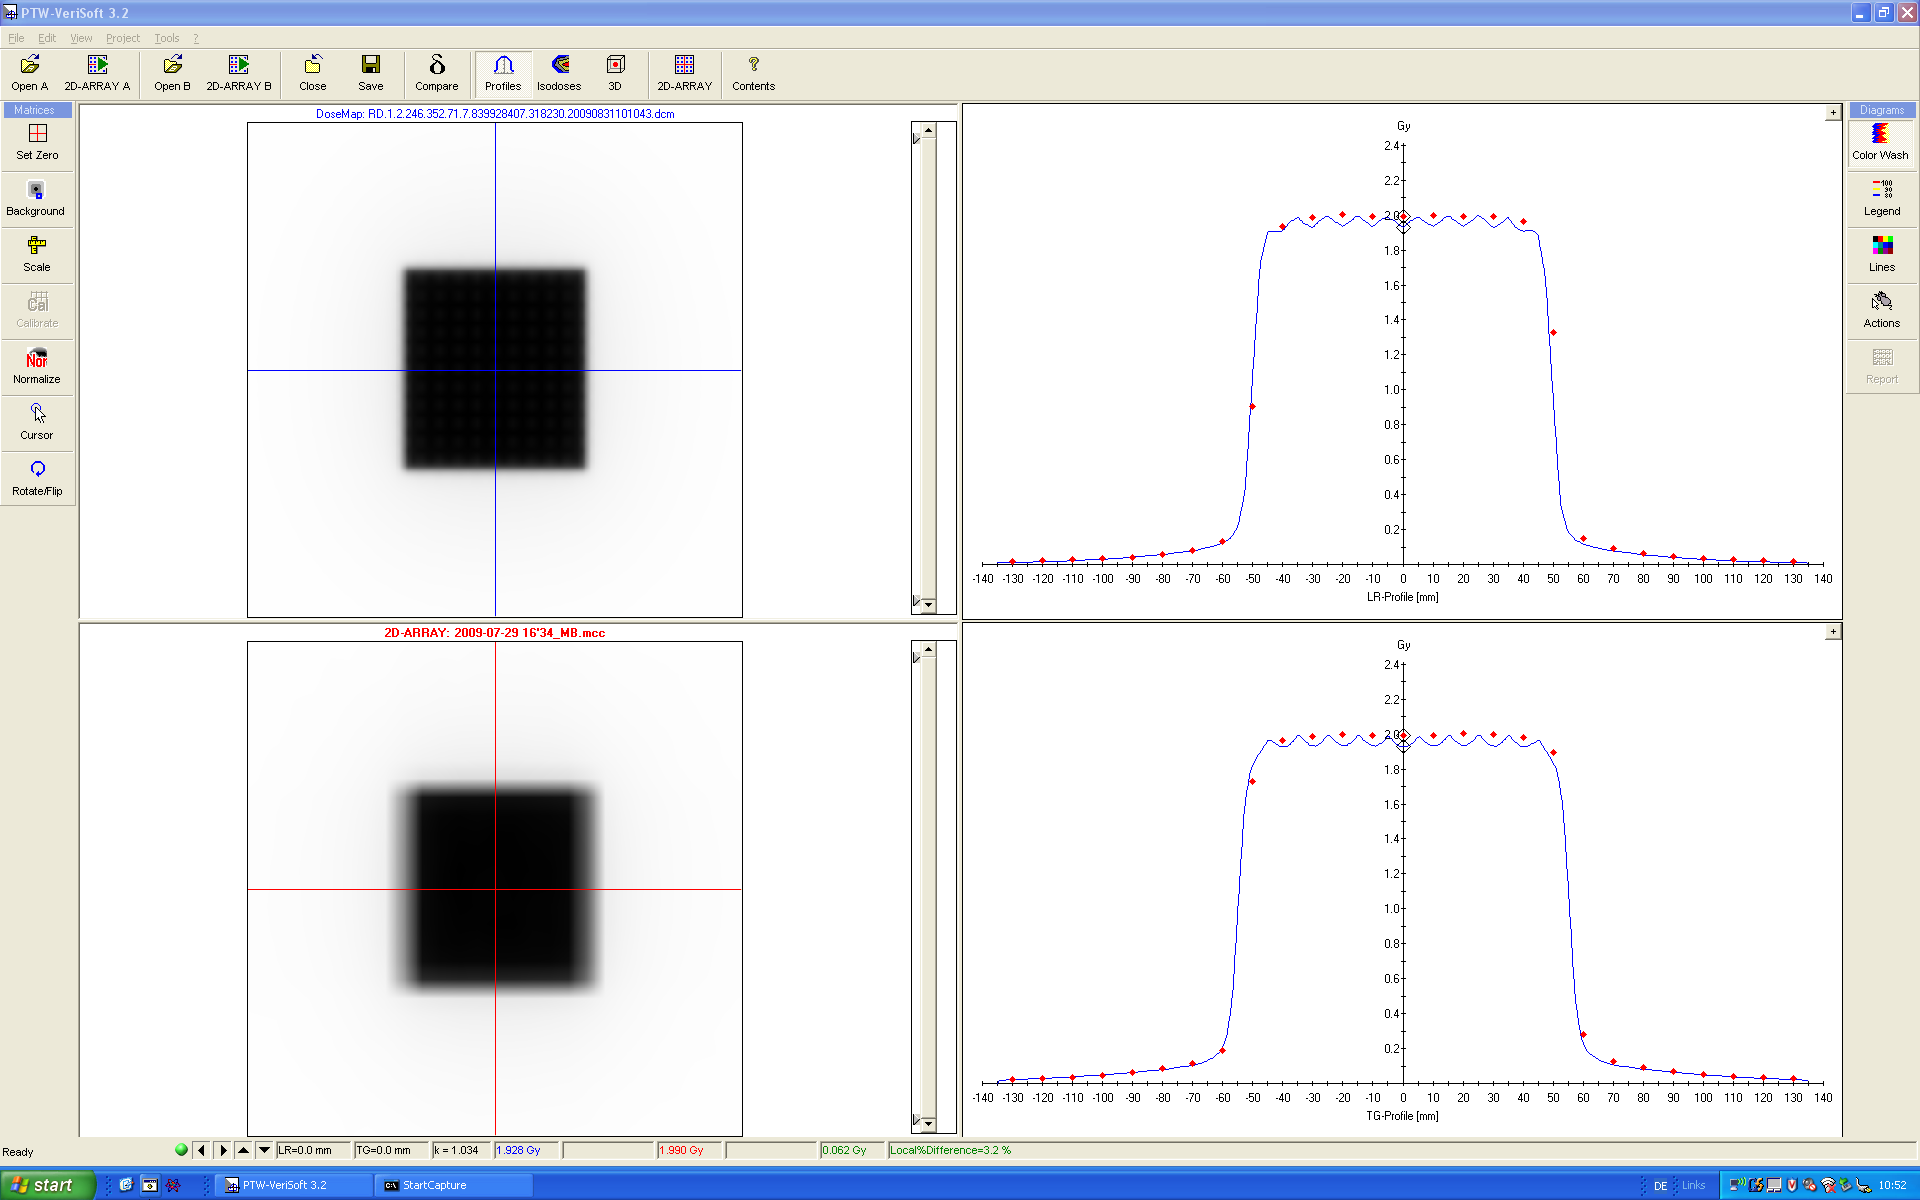
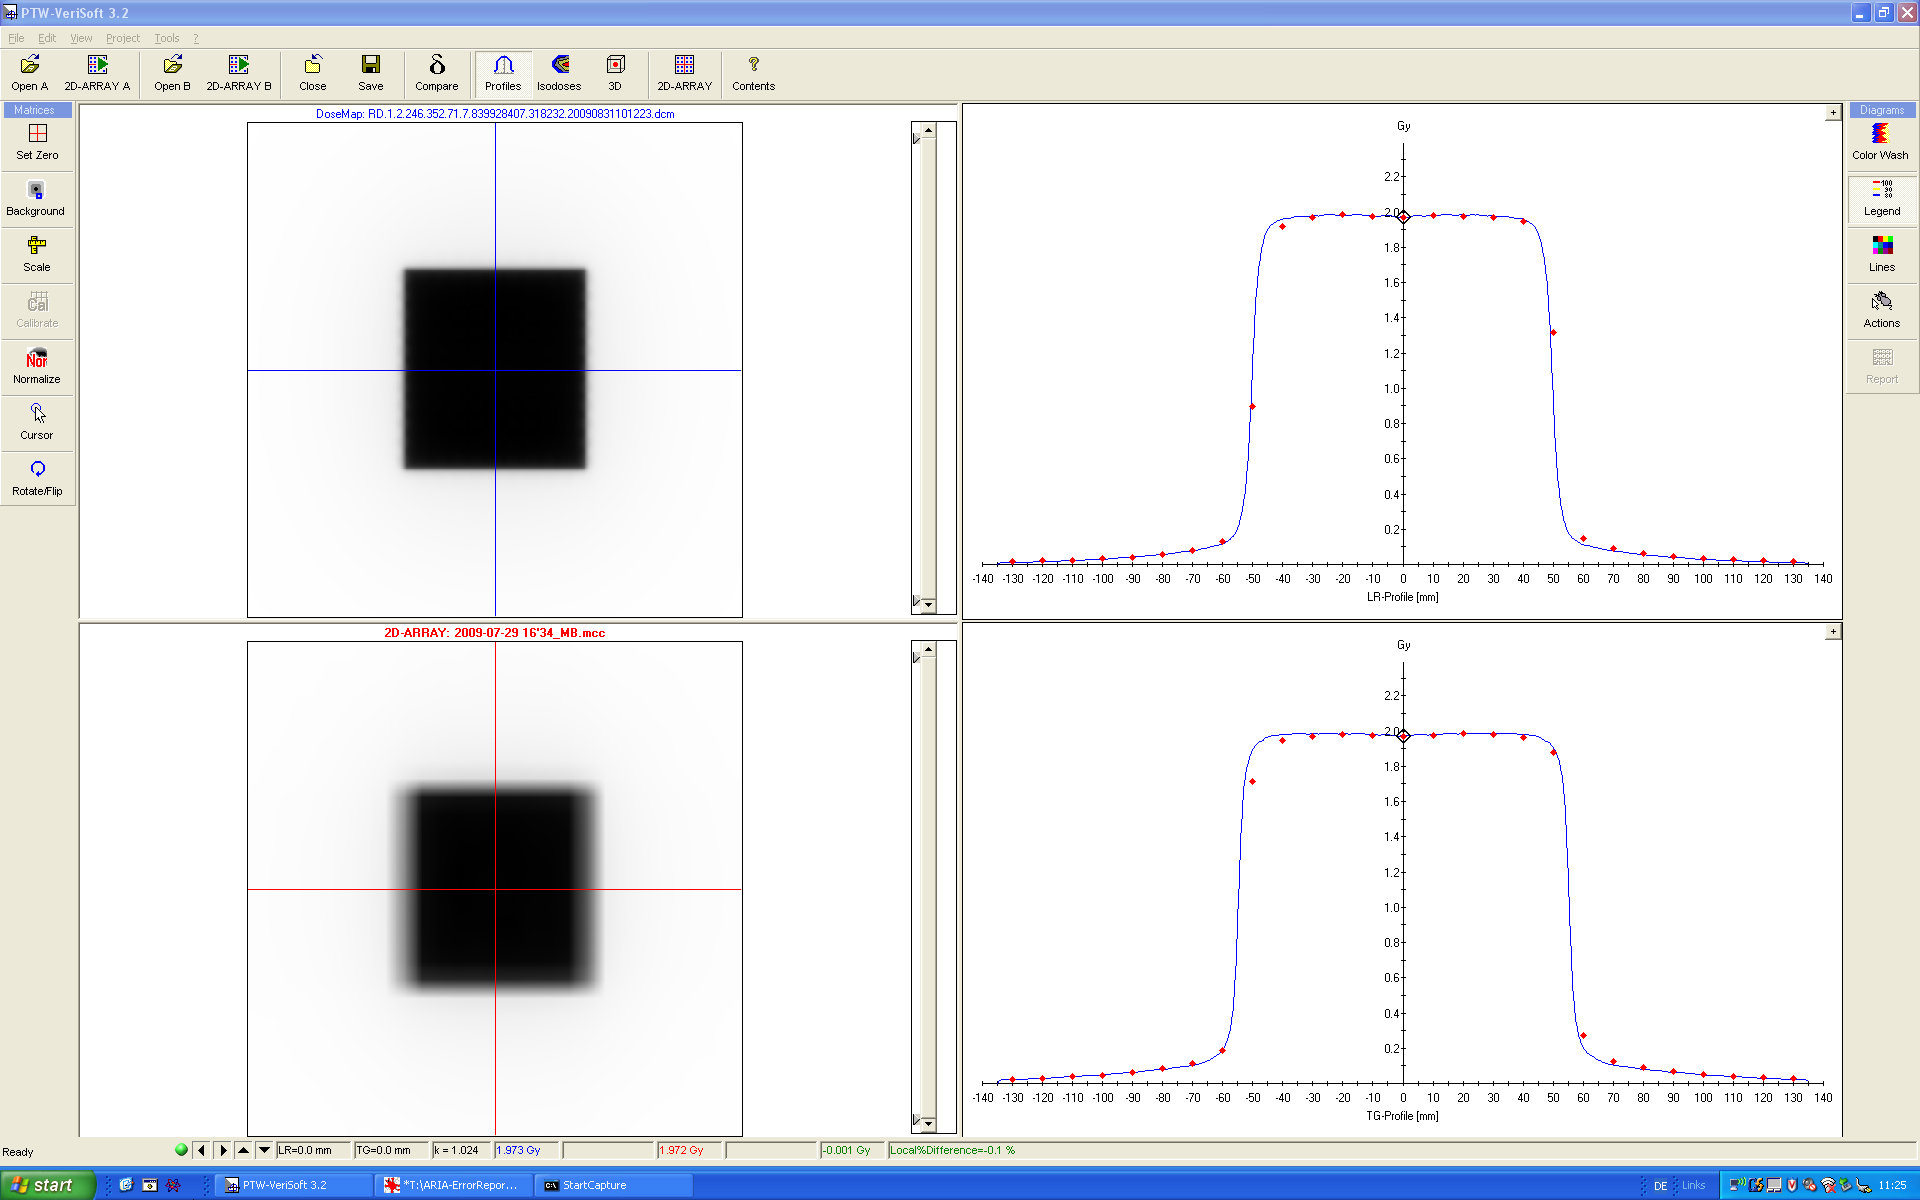
Using the older VeriSoft 3.2, the "A" area (upper left) is loaded with the calculated dose map from Eclipse, the "B" area (lower left) is loaded with the measurement. VeriSoft 3.2 displays a center value of 1.928 Gy for the calculated dose map, and 1.99 Gy for the measured value with kUser = 1.000. (The total k comes from the T and p values). The local difference is 3.2%:
(click to enlarge)
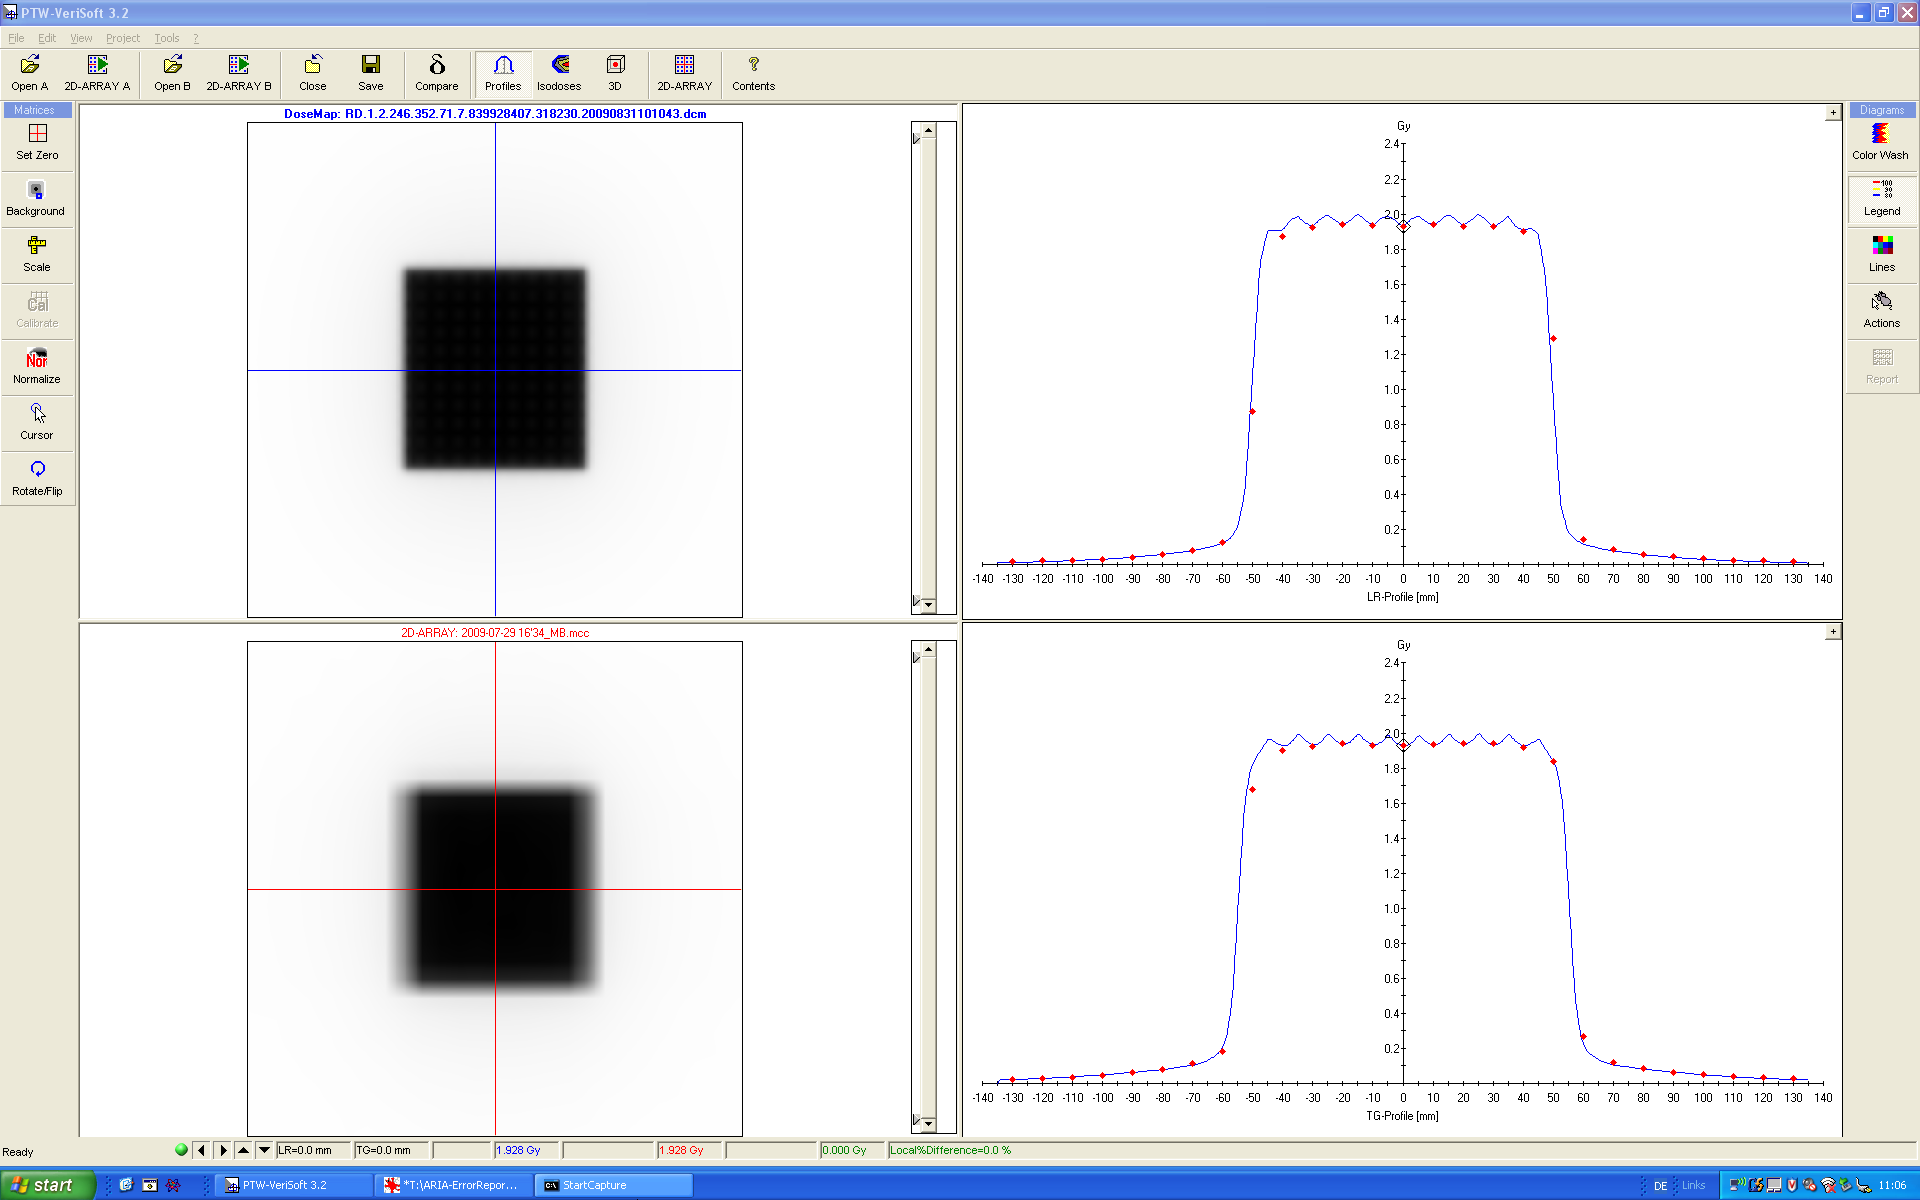
In other words, changing kUser to 0.969 will give a perfect match, and "Local Difference=0.0%" is printed at the bottom of the screen:
(click to enlarge)
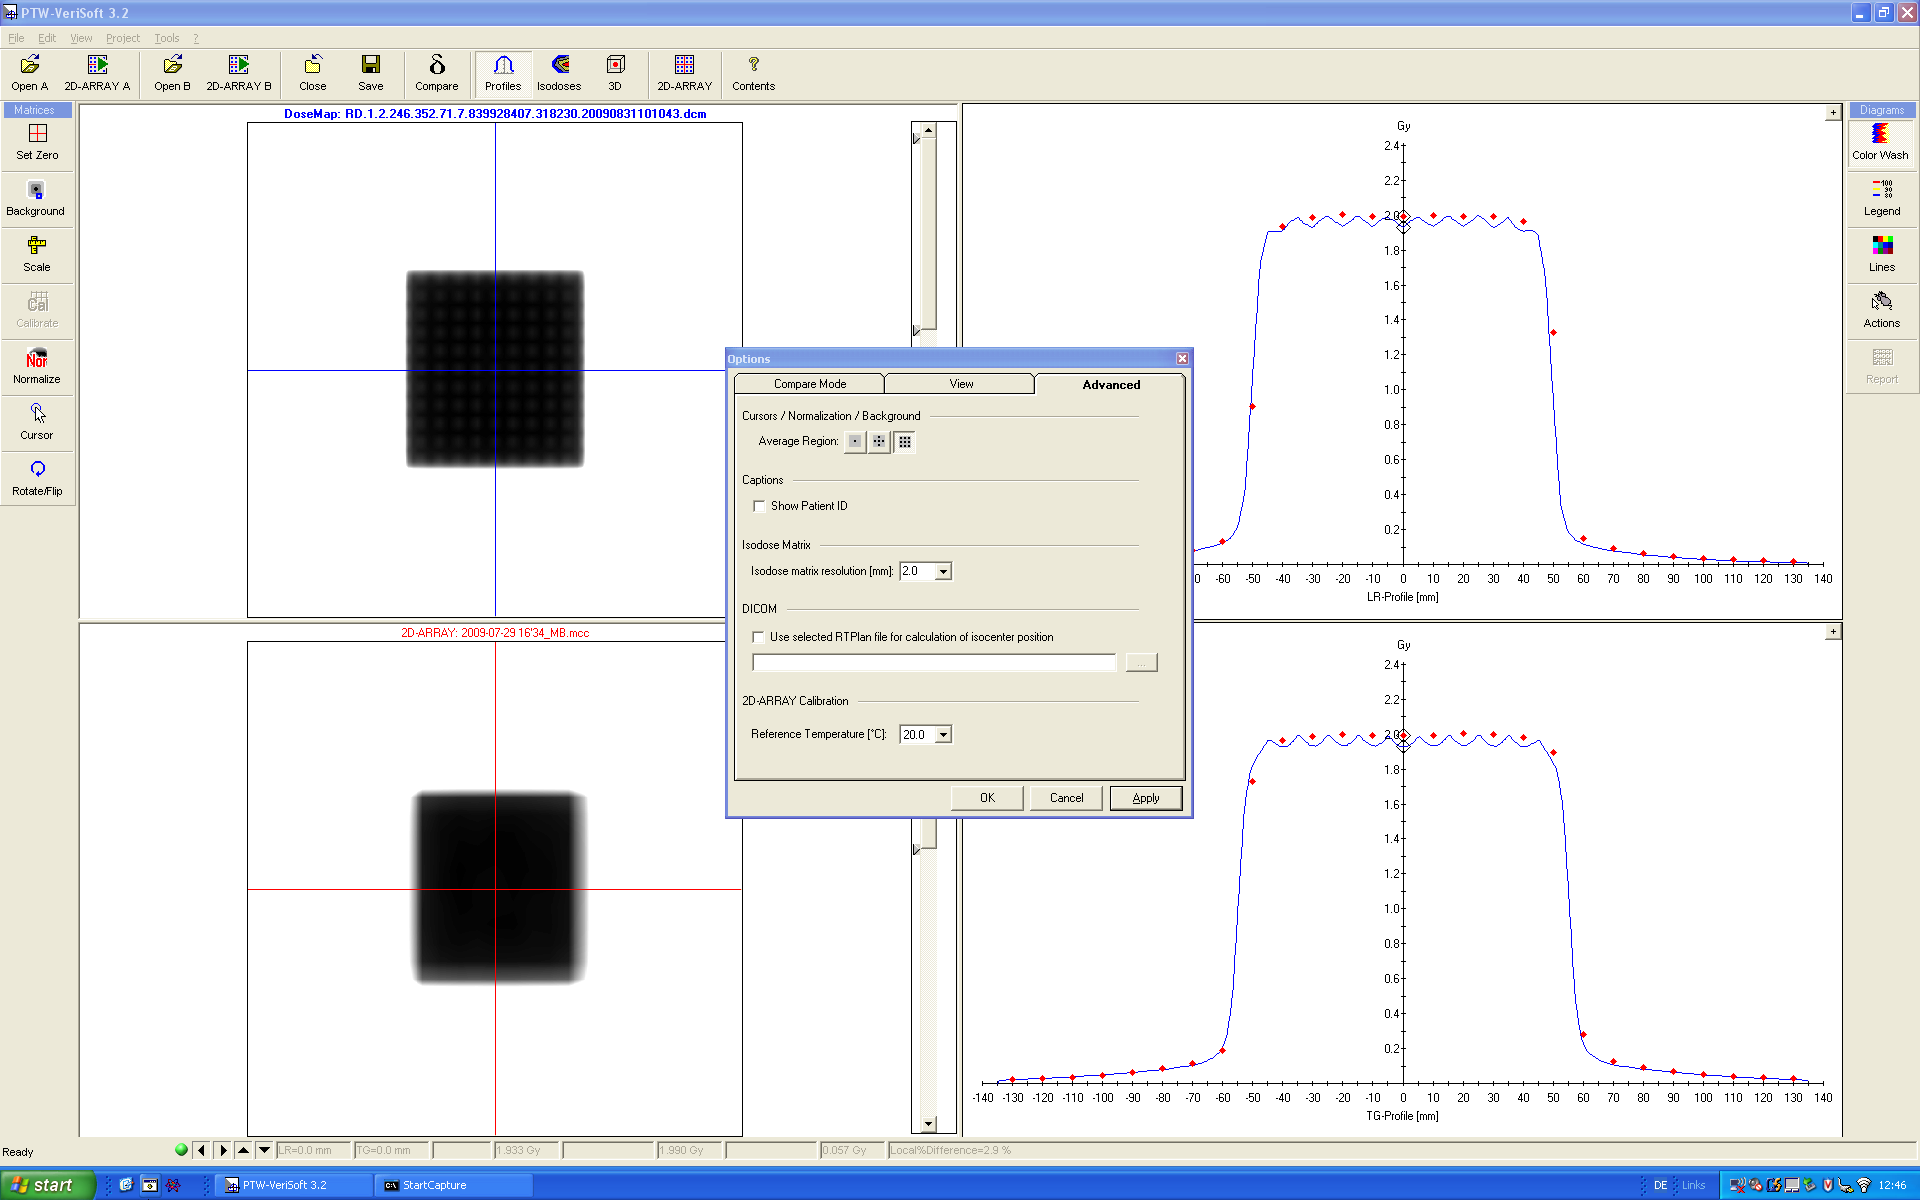
The setting for "Average region" in VeriSoft 3.2 plays a minor role. Compare the bottom lines for the small, medium and large regions.
Finding kUser with 1.0 mm grid
Let's stay with VeriSoft 3.2 and repeat the procedure with a reference field calculated with a smaller grid. When the calculation grid is reduced to 1 mm, it probably would not be too absurd to expect that the wave-like dose profile to become more "defined". More calculation grid points lie inside the air cavities where they capture the physical effect of low density on local dose. Of course, there are also a lot of secondary particles flying around, but how will they depend on the calculation grid? Intuition could say: "If resolution is increased, the picture gets sharper".
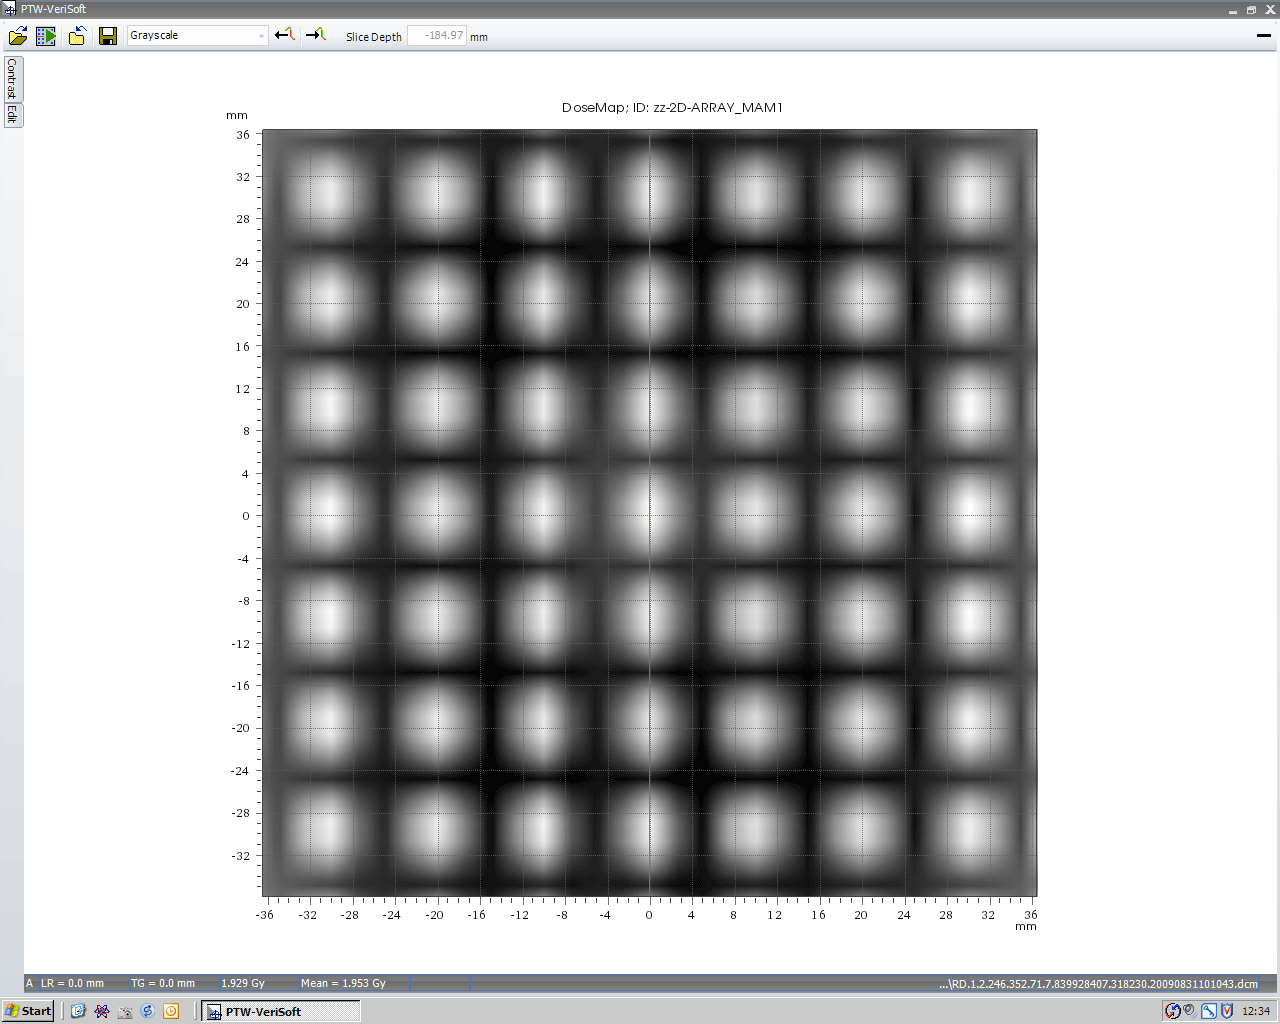
However, we were surprised to see that the profile through the center of the chambers, calculated with 1 mm grid, is completely flat. As if there were no air cavities at all! Nothing else was changed, only the calculation grid size. OK, there are some waves in the isodoses but they only develop at the distal end of the chambers:
(click to enlarge)
In VeriSoft 3.2, we now replace the "A" matrix with the finer calculation. A new value of kUser = 0.991 gives agreement for the central chamber. With kUser = 1.000, the local difference is 0.9%:

(click to enlarge)
(click to enlarge)
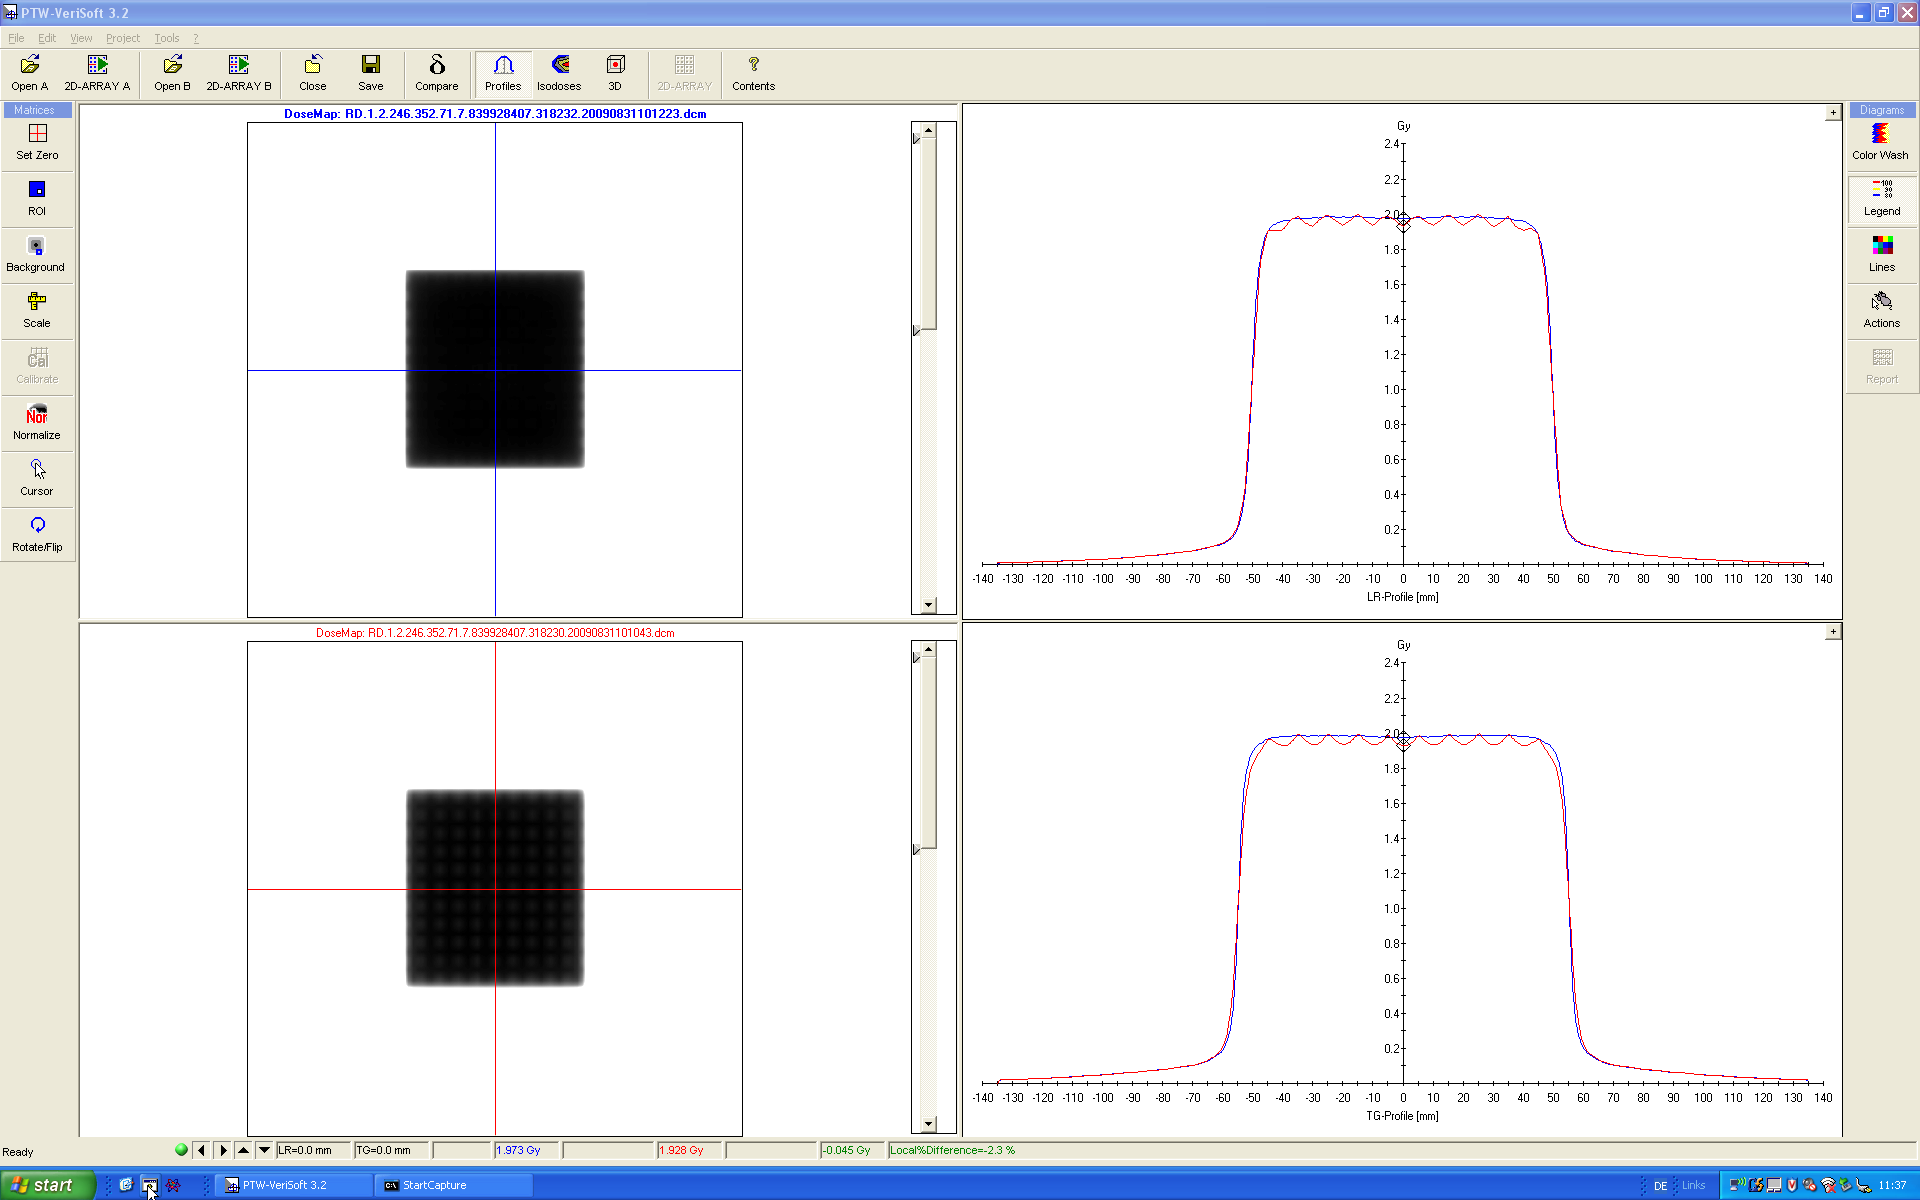
If the two calculated dose matrices are compared directly, the "Eclipse part" of the problem becomes obvious (the "ARRAY part" is the existence of air-filled cavities). The 1 mm matrix is still at A, matrix B is replaced by the 2.5 mm calculation. The local difference of the two calculations in the center of the field is 2.3%:
(click to enlarge)
The 2.3% difference in kUser influences the IMRT verification result in the same sense. In other words: Depending on the calculation grid size (1 mm or 2.5 mm) of the reference field, and using VeriSoft 3.2, the correction factor kUser that is applied will be 2.3% higher or lower. This is a lot! VeriSoft 4.0 helps a little, which will be seen shortly.
The good question is: Which calculated matrix is correct? Which value of kUser is correct? Which one would you prefer?
If the "problem" weren't right in the center of the chambers, we probably wouldn't care. But this is the reference plane. When Octavius is used, it is THIS plane that is exported from the TPS for comparison.
Determining kUser with VeriSoft 4.0
With VeriSoft 4.0, there are some more options for the evaluation. When the mouse pointer moves over matrix "A", not only the local "high resolution" value is displayed in the bottom line, but also the mean dose averaged over the 5x5 mm area of the current chamber. The mouse pointer location is evaluated and, if there is a chamber at the same spot, this second value is printed on the screen with the label "Mean":
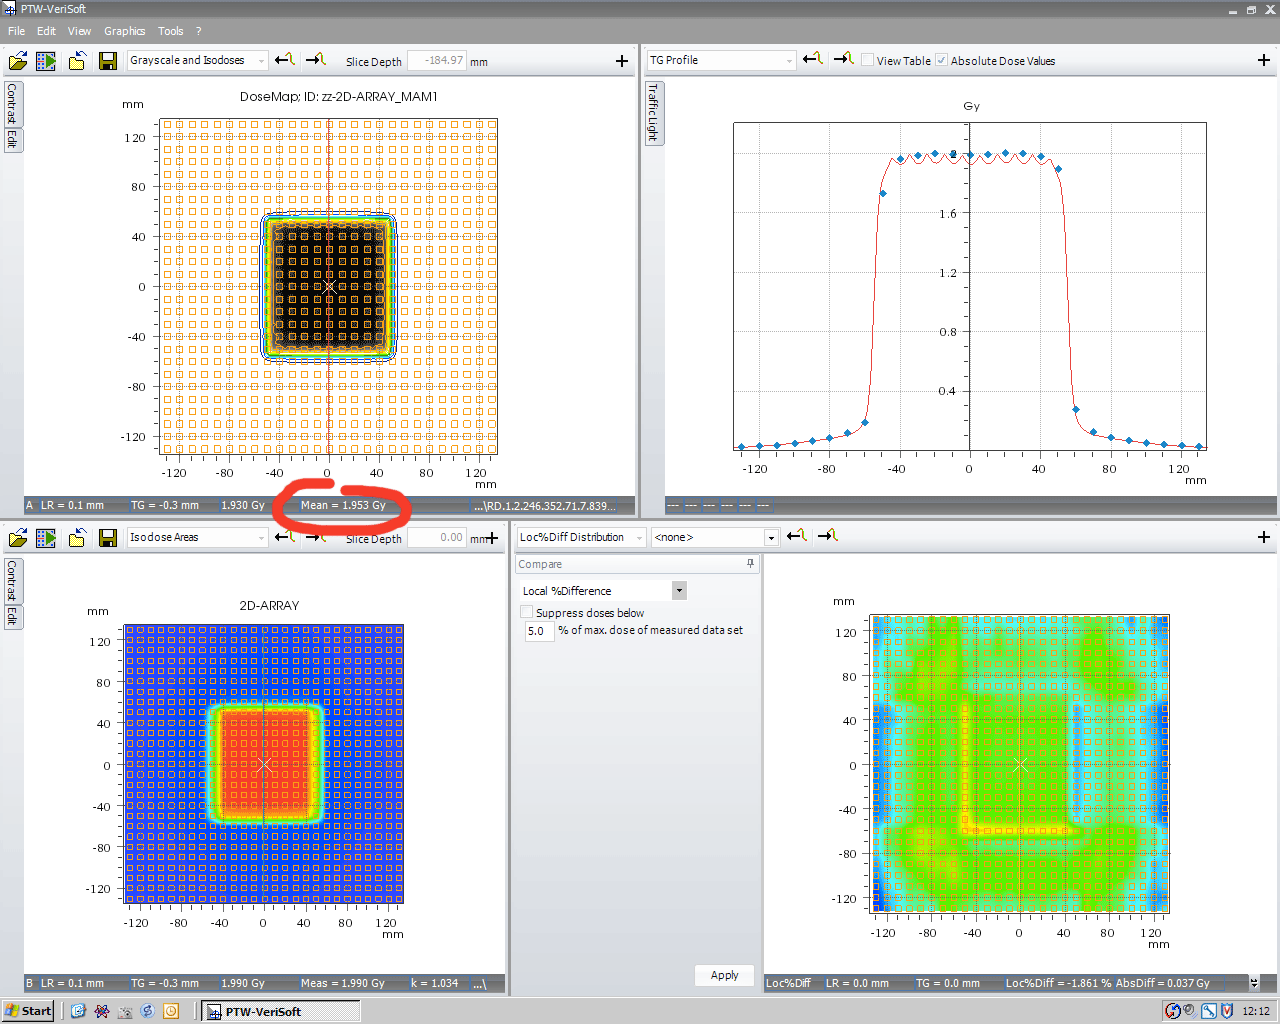
(click to enlarge)
The reason why the local value in the screenshot is displayed as 1.930 Gy has to do with the sampling of the computer screen. The mouse cannot be put over the exact (0,0)-coordinate. The point LR=0.1 mm, TG=-0.3 mm is the closest to origin. This can be solved by zooming in or by opening the high resolution table of A, another new feature of VeriSoft:
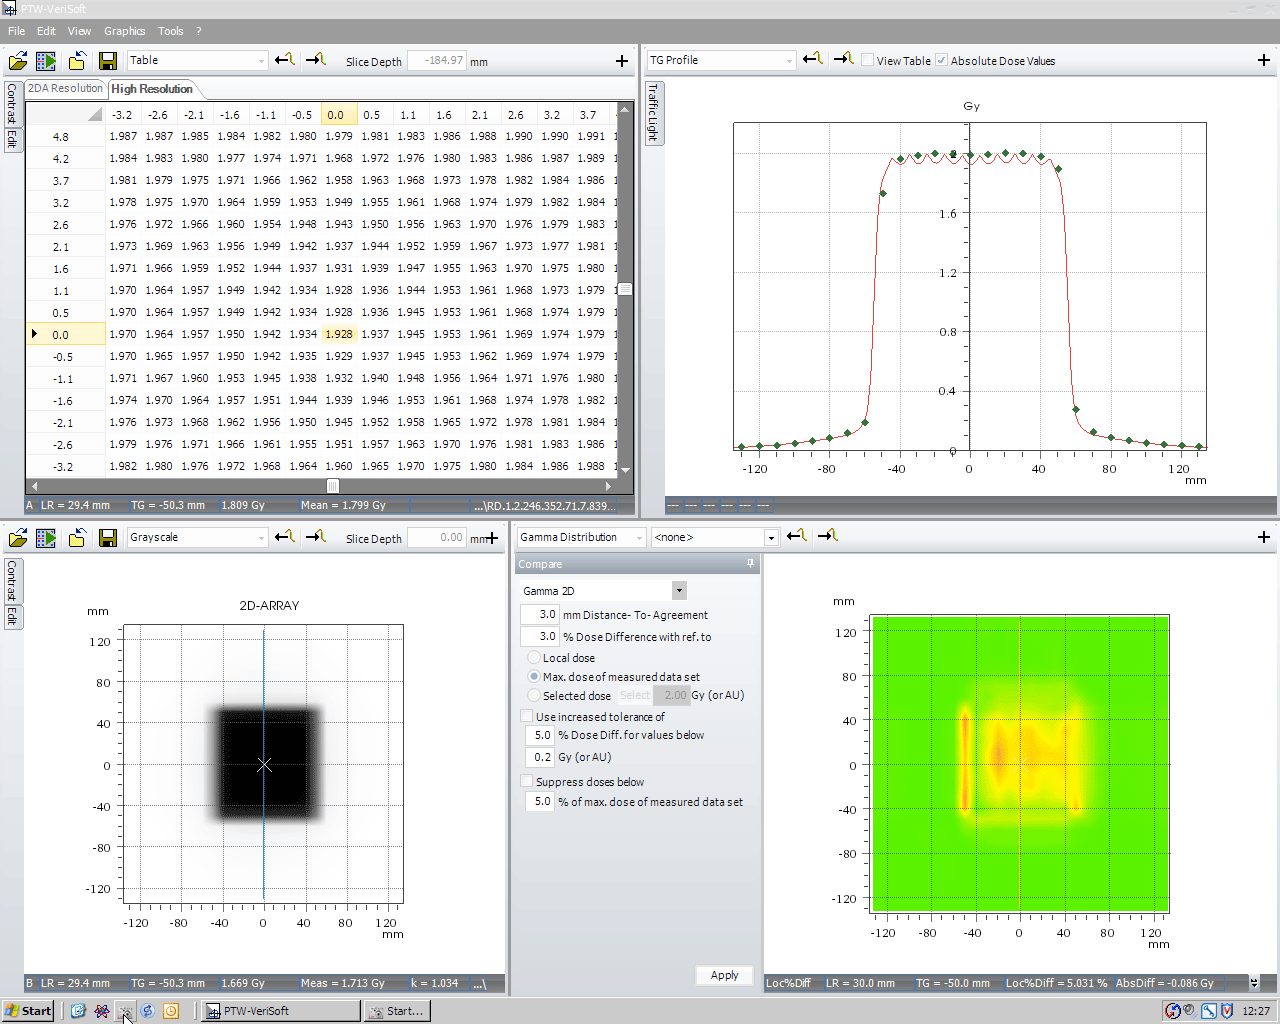
(click to enlarge)
In our example, VeriSoft 4.0 displays 1.953 Gy as the dose averaged over the central chamber. A match is therefore achieved with kUser = 0.981.
Another new feature, the Histogram, makes it possible to look at a larger area and to determine kUser so that on a certain region of interest, e.g., a 7x7 chamber area inside the reference field, the average deviation is zero. This averaged kUser is 0.982 for the 2.5 mm calculation.
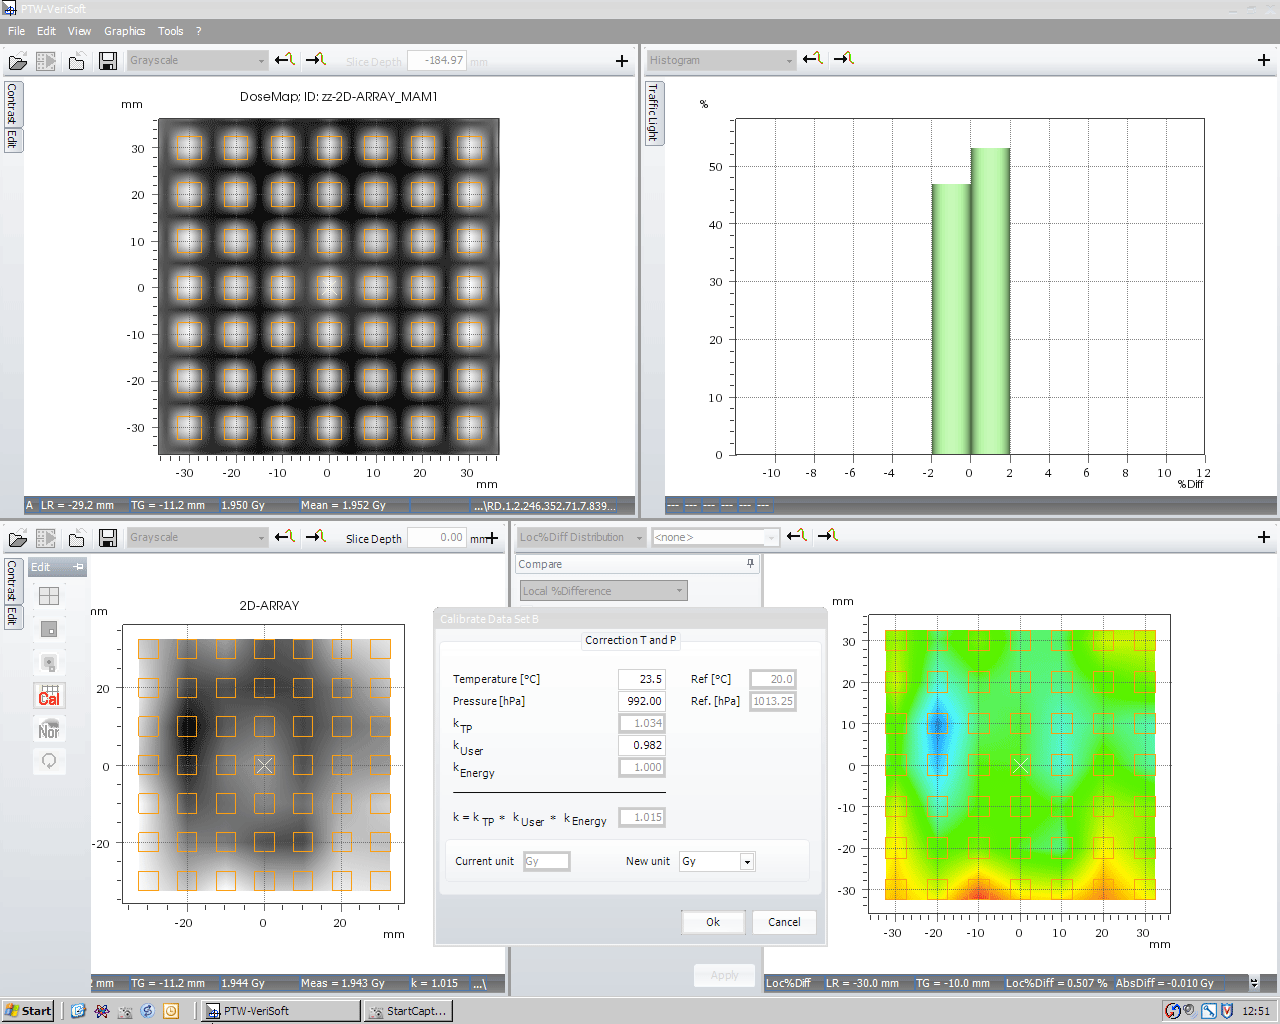
(click to enlarge)
For the 1.0 mm matrix, VeriSoft 4.0 outputs the same kUser for a match, 0.9915.
The averaging in VeriSoft 4.0 makes sense, because the chamber-averaged value better represents the "comparison partner" for the ARRAY measurement. Not surprising, it also reduces the difference between the values for kUser computed for the two calculation grid settings.
The following table collects the kUser values that give perfect agreement (depending on how agreement is defined) between a single measurement and two different AAA calculation resolutions, and for two VeriSoft versions:
| kUser needed for match | 2.5 mm calc. grid | 1.0 mm calc. grid | Difference in kUser |
|---|---|---|---|
| VeriSoft 3.2 | 0.969 | 0.991(5) | 2.3% |
| VeriSoft 4.0 | 0.982 | 0.991(5) | 1.0% |
One question remains: Why are the two AAA-calculations so different? We asked Varian about this, but got no answer.
How we solved the "problem" can be read here.