Eclipse Beam Configuration |
Screenshots |
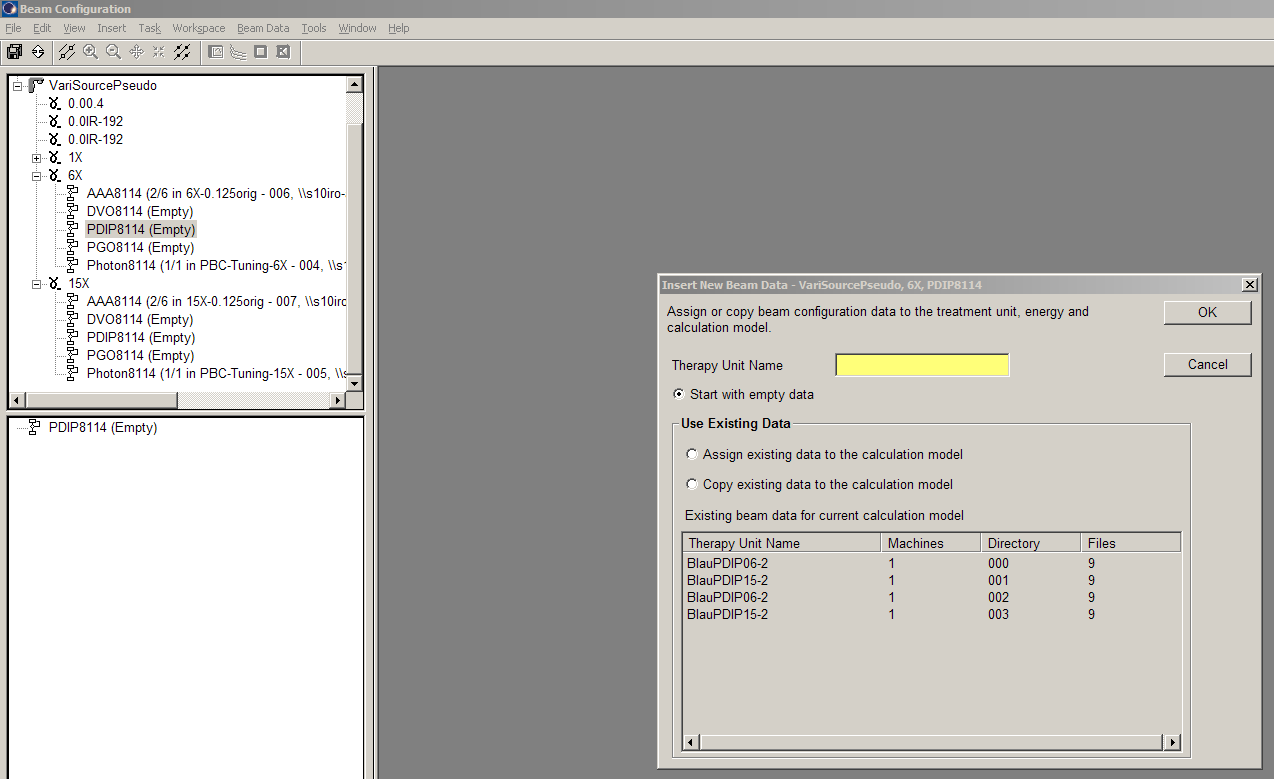
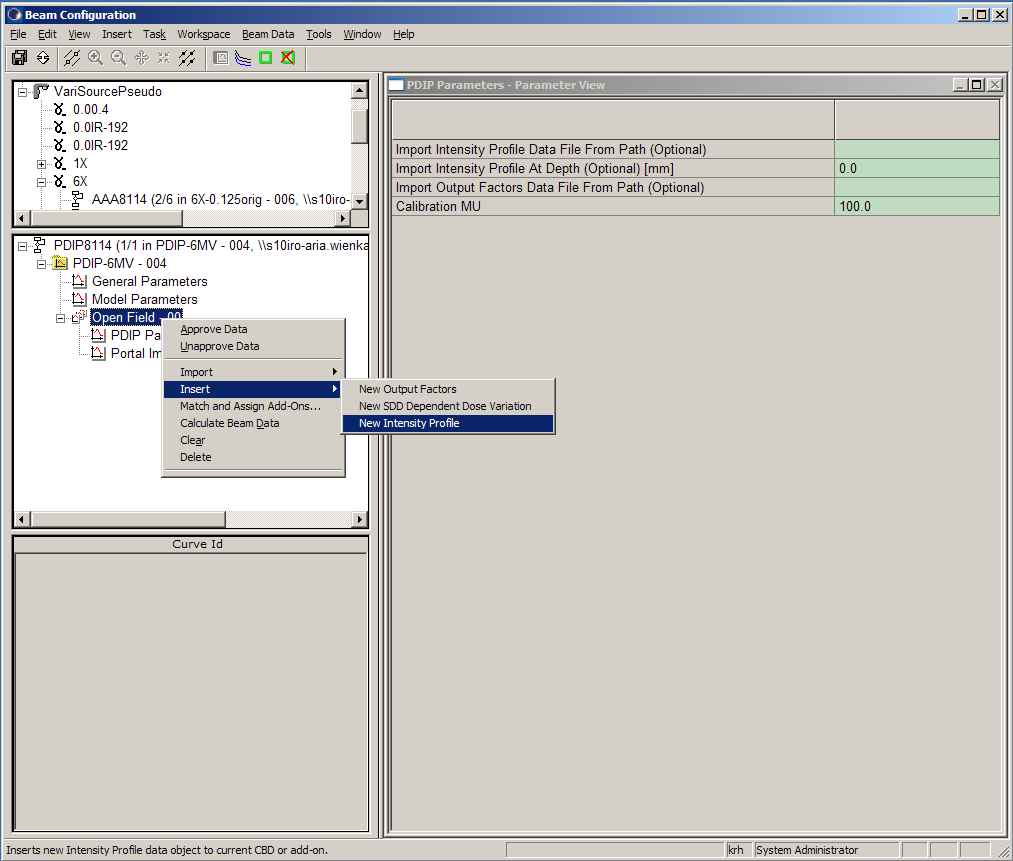
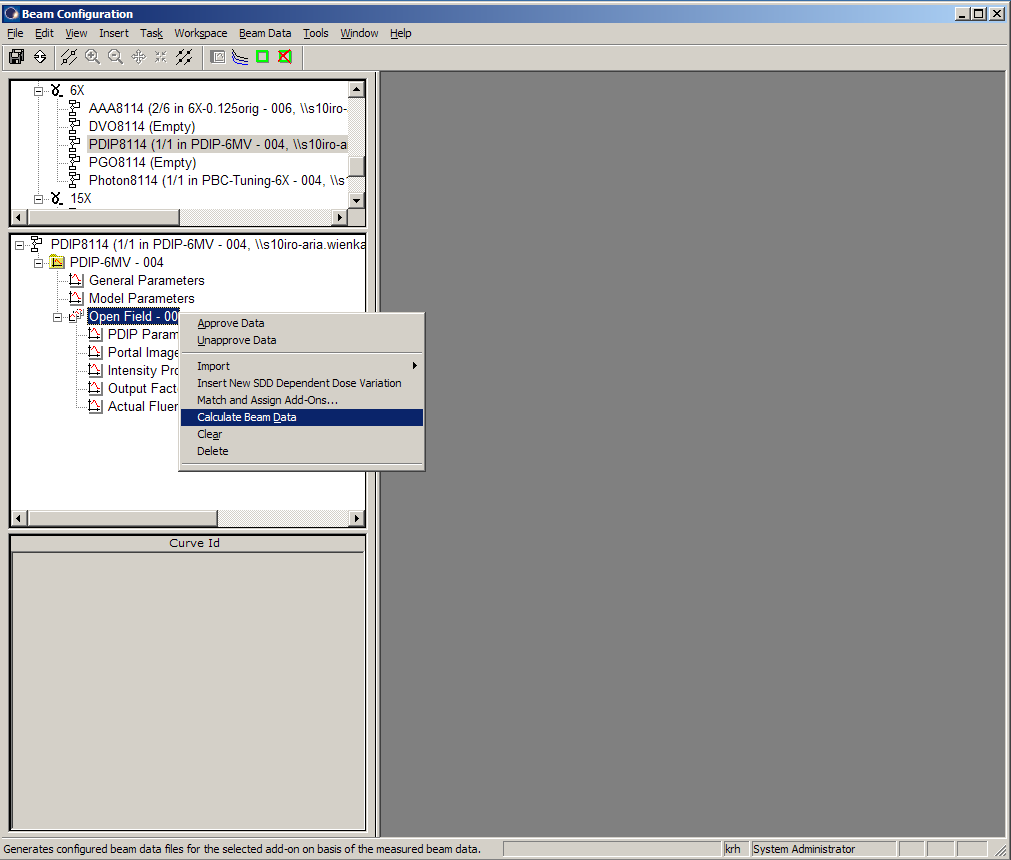
In Beam Configuration, open the machine and energy, right-click on the Portal Dose Prediction Model (PDIP8114 in the screen shots) and choose "New Beam Data ..."
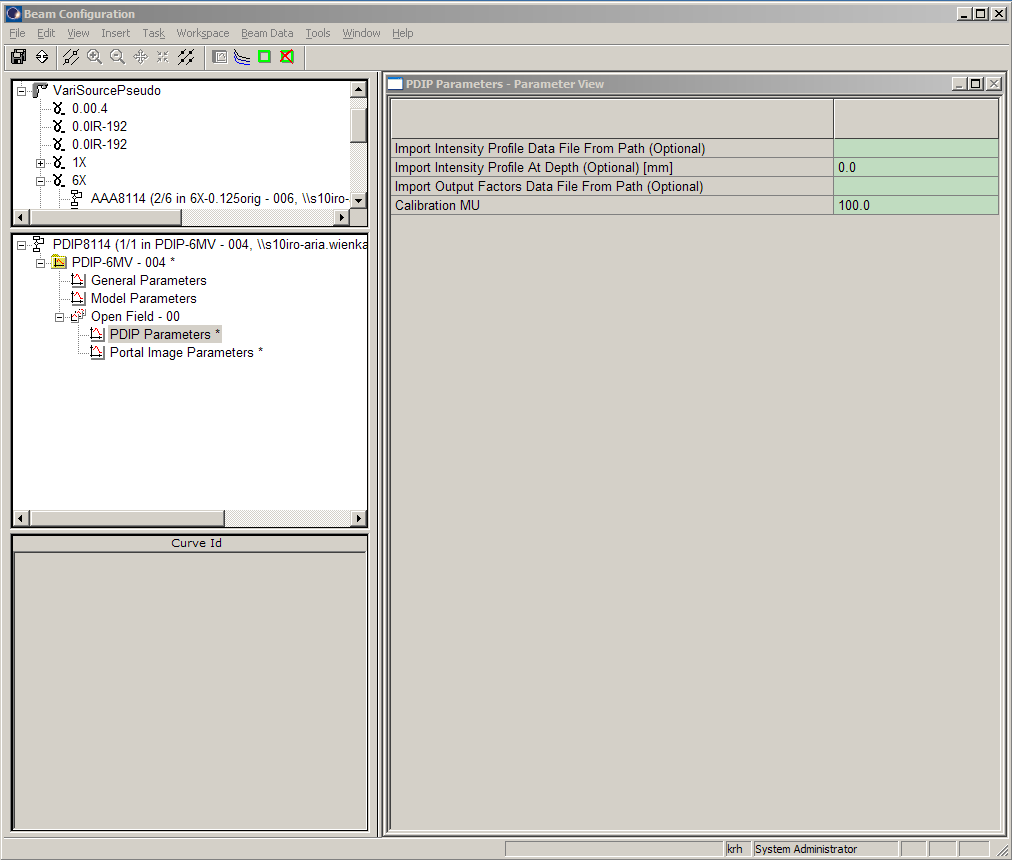
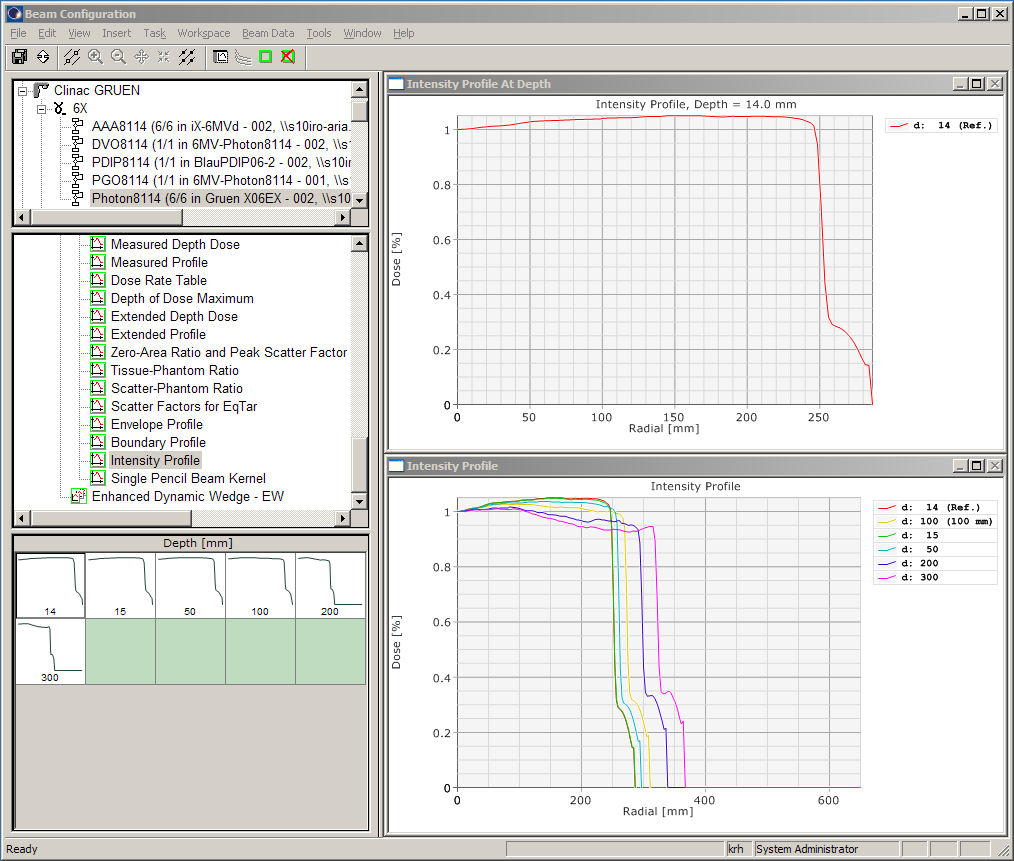
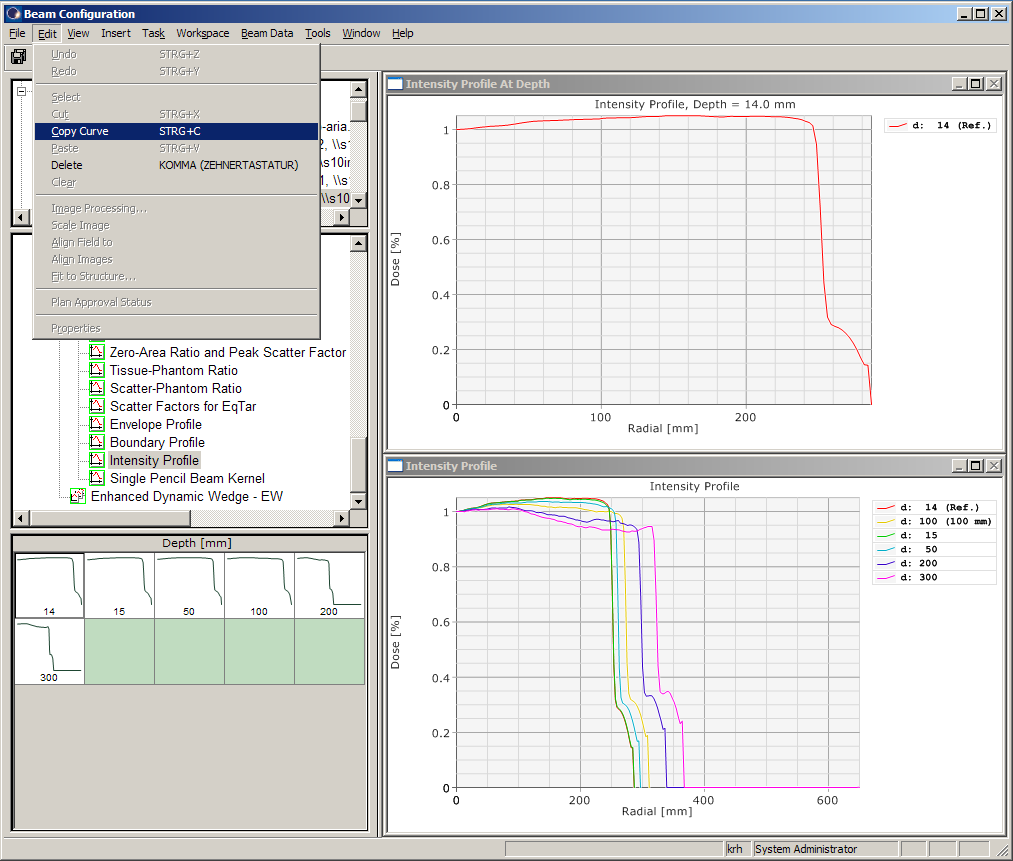
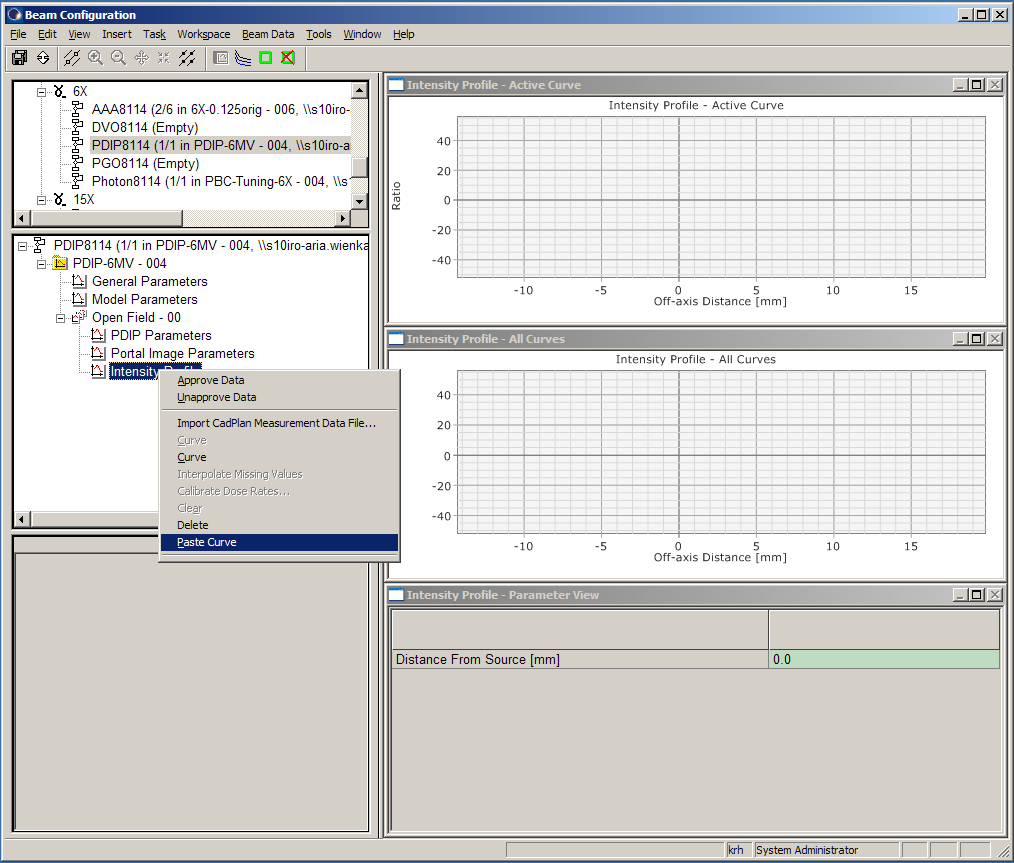
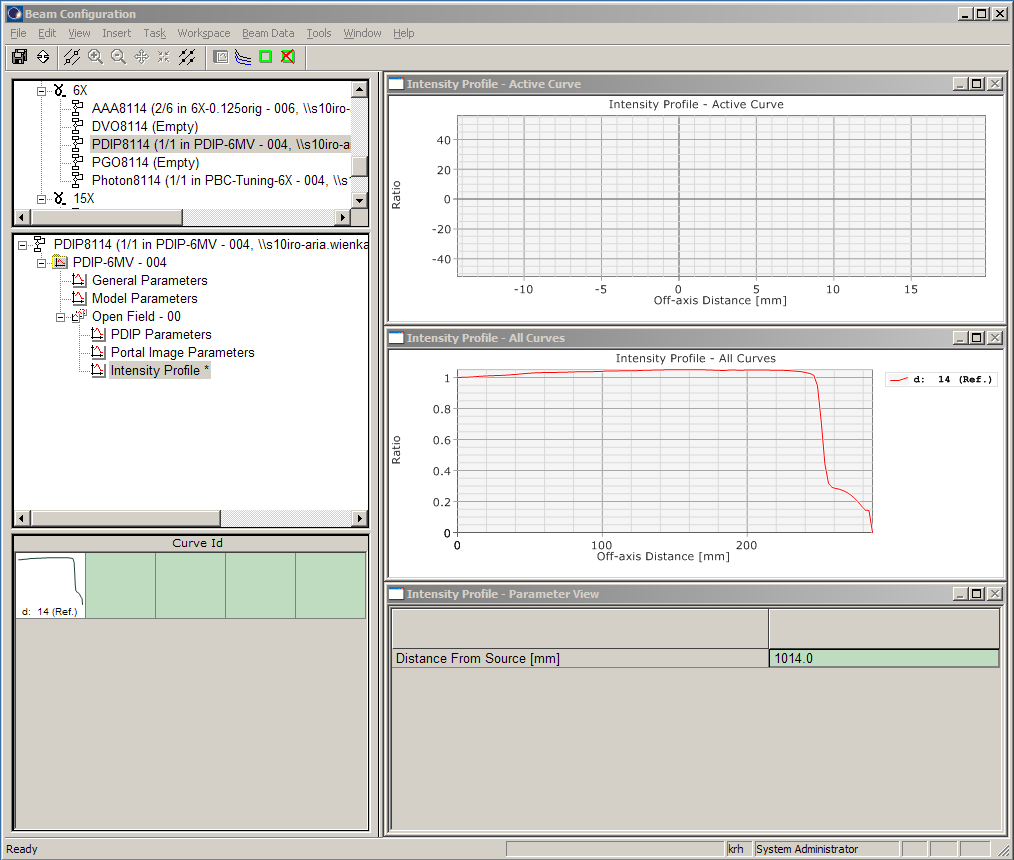
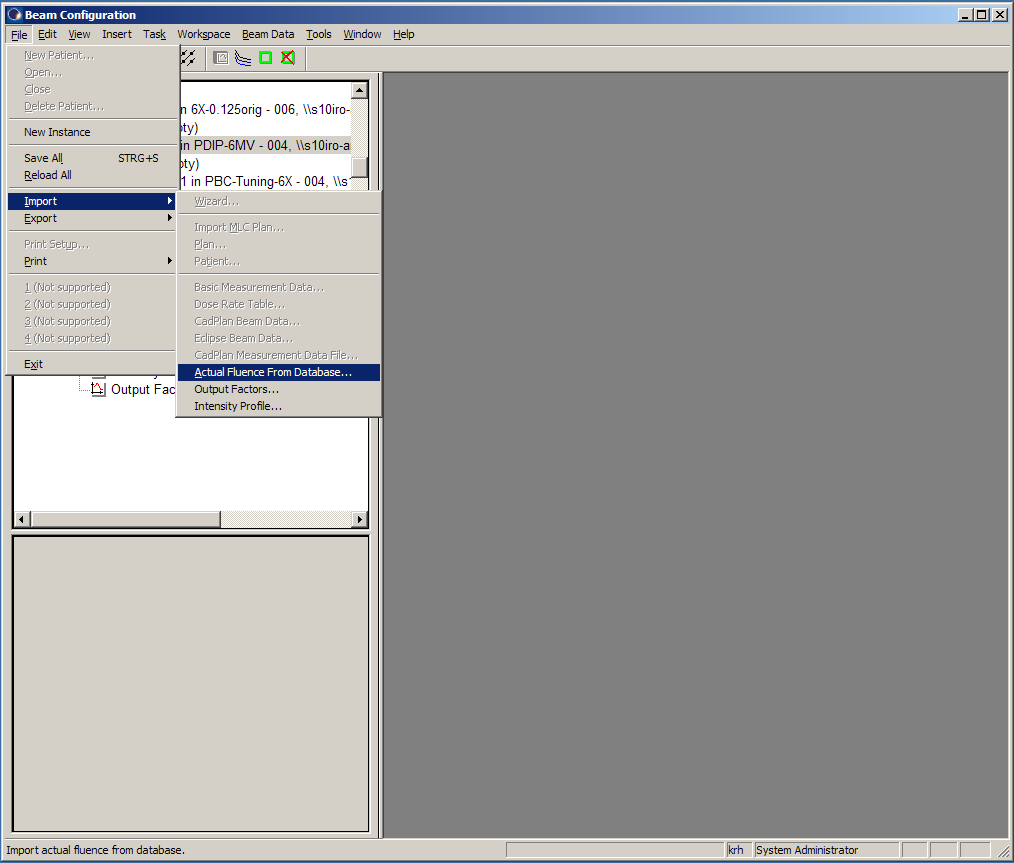
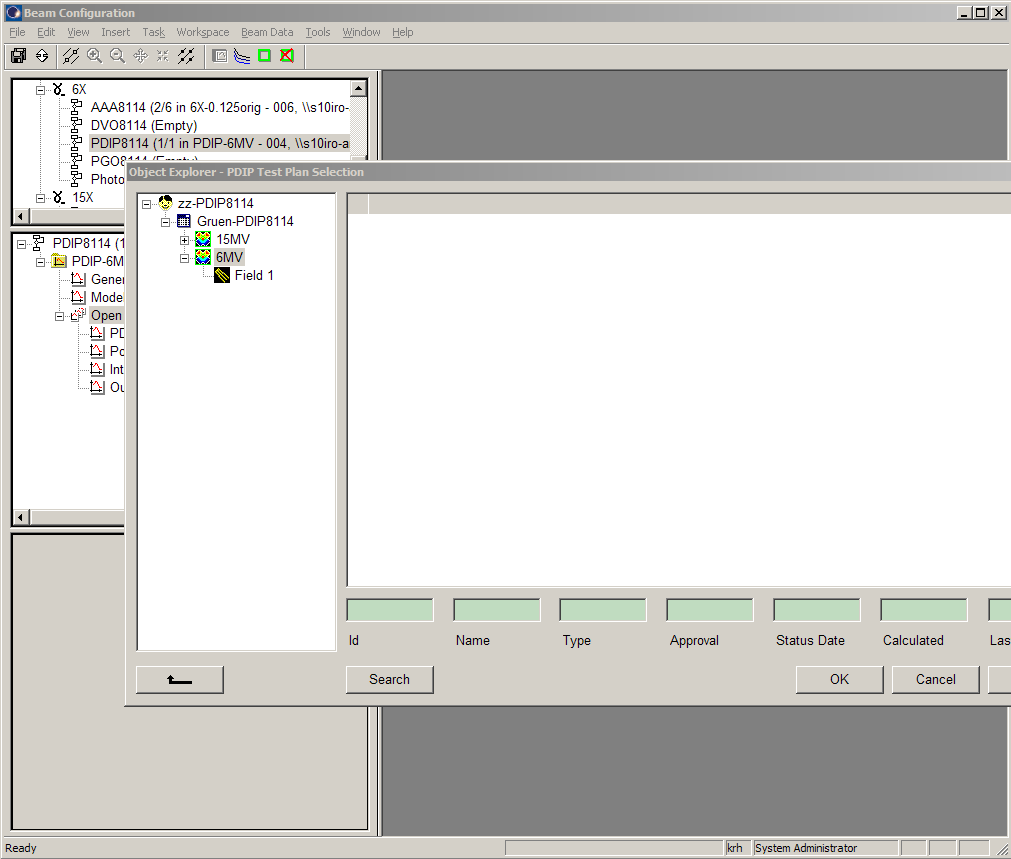
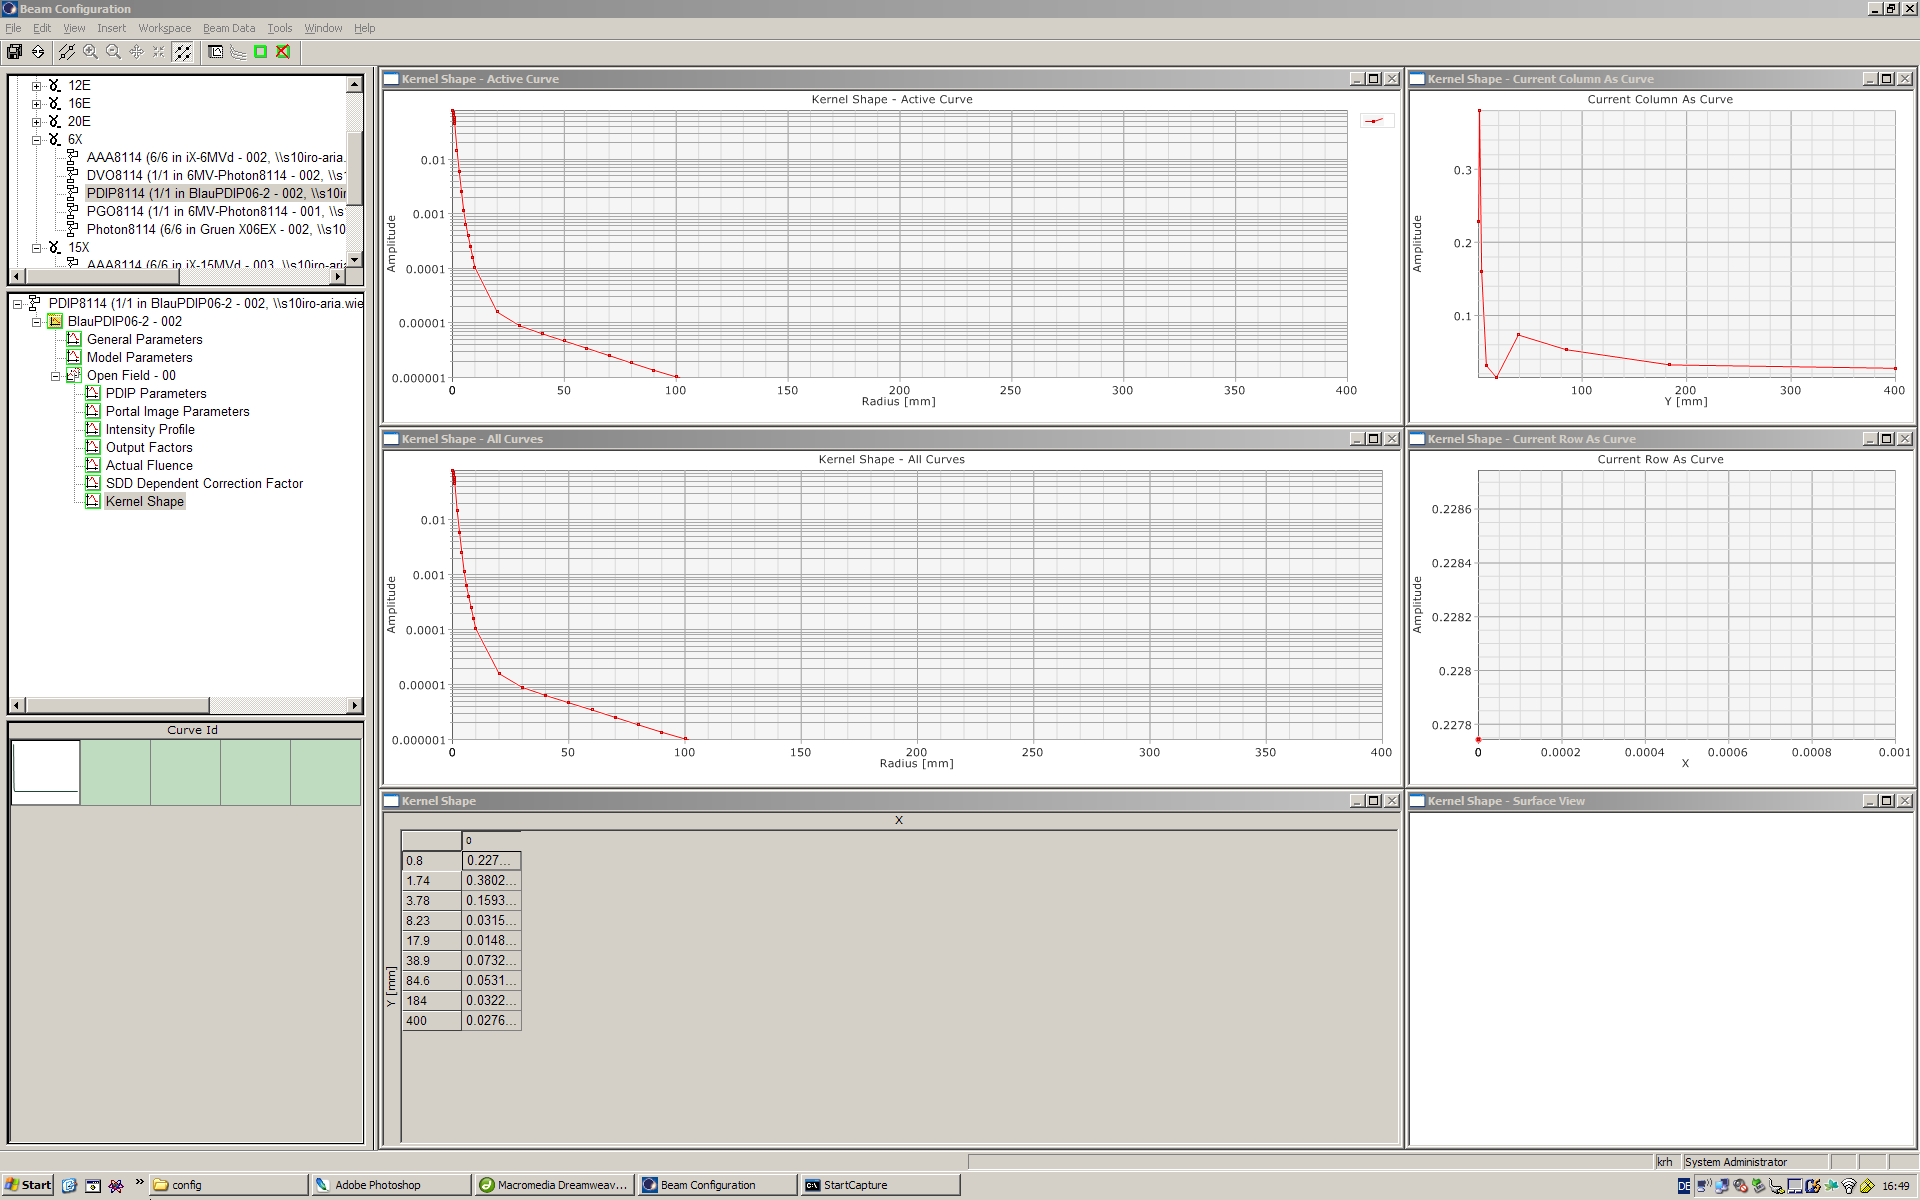
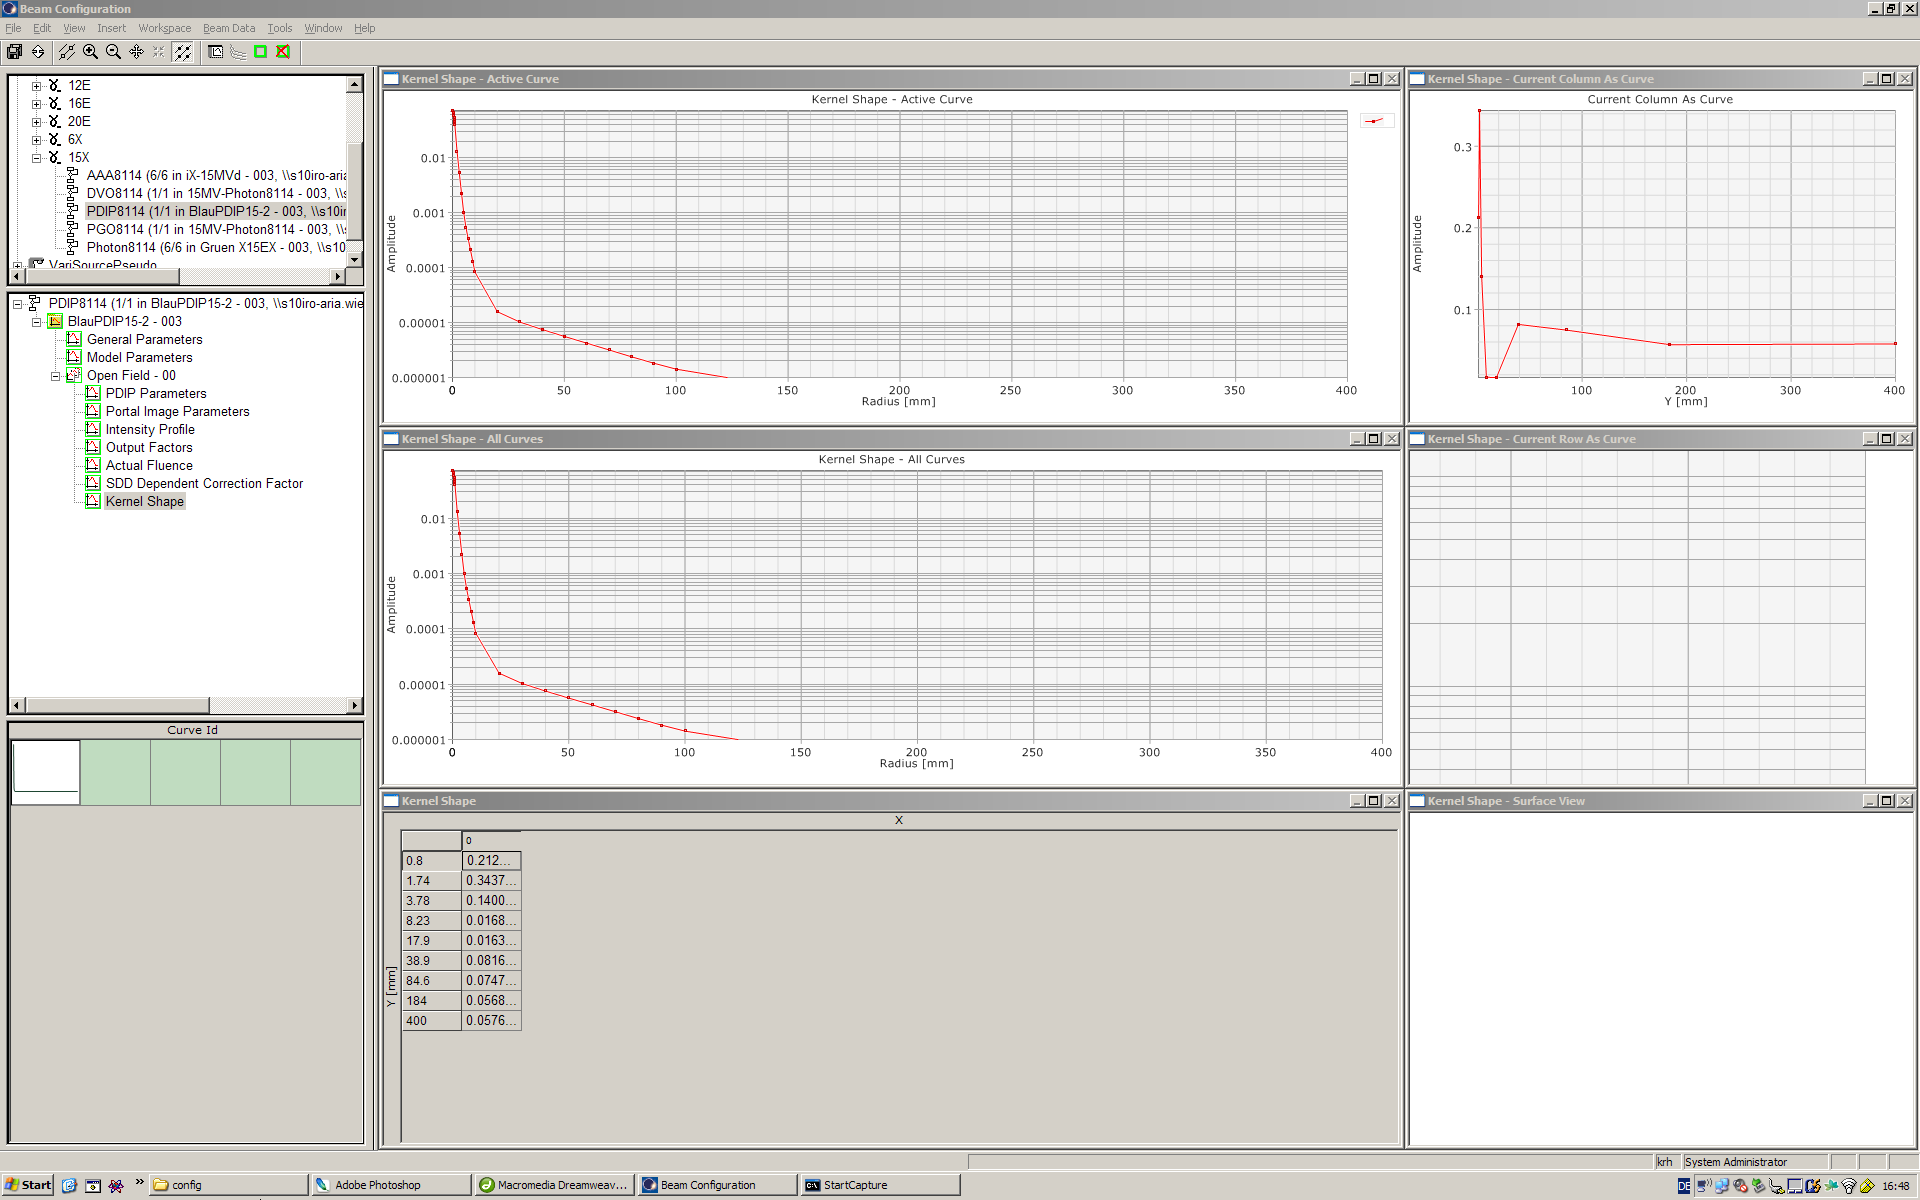
Right-click on "Open Field" and insert "New Intensity Profile". Save. Select a configured Pencil Beam Model, e.g., Photon8114, with the same energy. Navigate to "Open Field" and click on the Intensity Profile icon. In the lower left corner, click on the profile with the shallowest depth (remembering the depth value) and select "Copy Curve" in the "Sedit" menu of Beam Configuration. Navigate back to the PDIP model, reight-click on the empty Intensity Profile and choose "Paste Curve". The profile appears in the lower left area. In the Parameter field on the right side, enter the distance of the profile from focus (e.g. 1014 mm, if the profile was measured in the water phantom with SPD = 100 cm and 14 mm depth). Also enter the depth in phantom (e.g., 14 mm) in the PDIP Parameters ("Import Intensity Profile At Depth (Optional) [mm]") although it says "optional". In the File menu, select "Import > Actual Fluence from Database ...". In the Patient Explorer that opens, choose the test patient that holds the images with the test pattern. Select the plan (take care to select the plan with the correct energy). The Actual Fluence cannot be displayed. Select "Calculate Beam Data". A few seconds later, two more items are added by the software. The "Kernel Shape" is the interesting one. "Approve Data" and you are ready to go. |
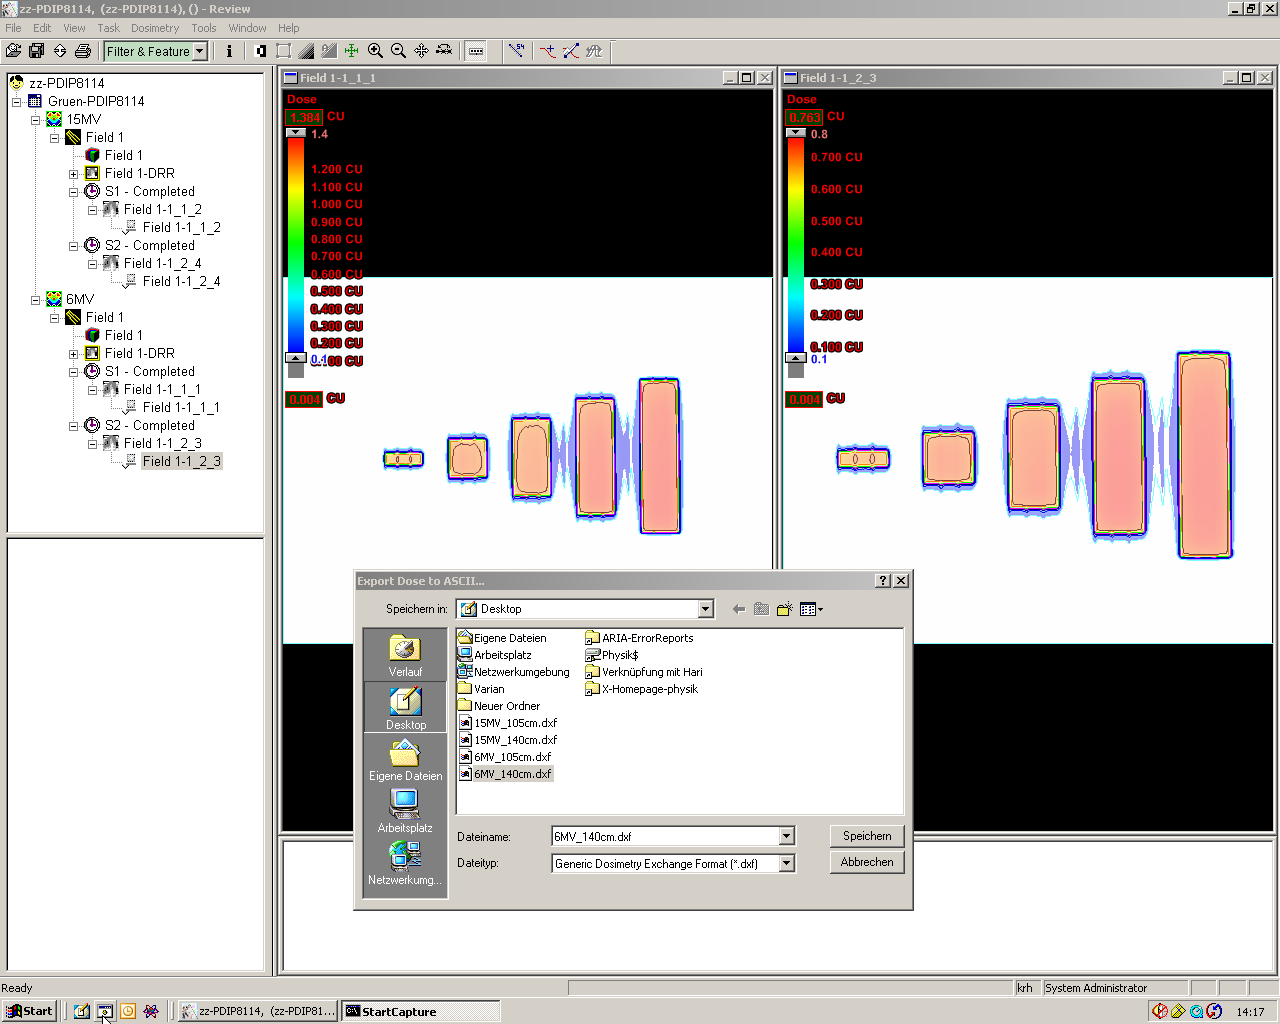
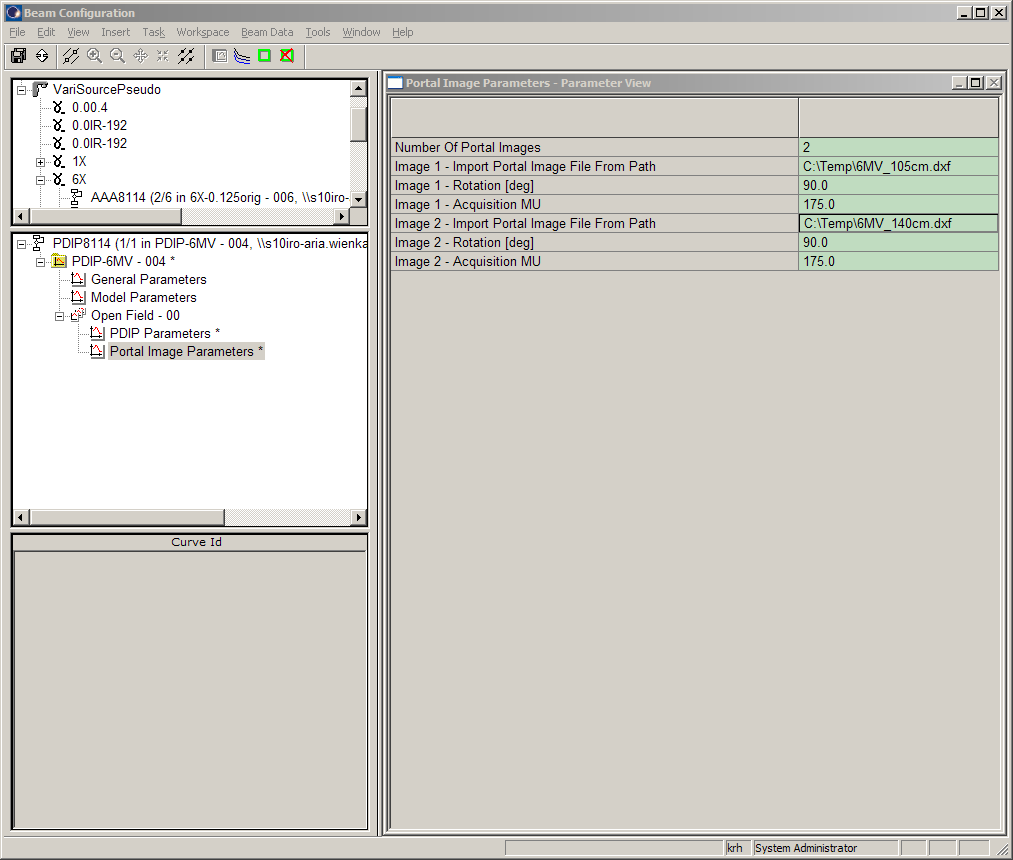
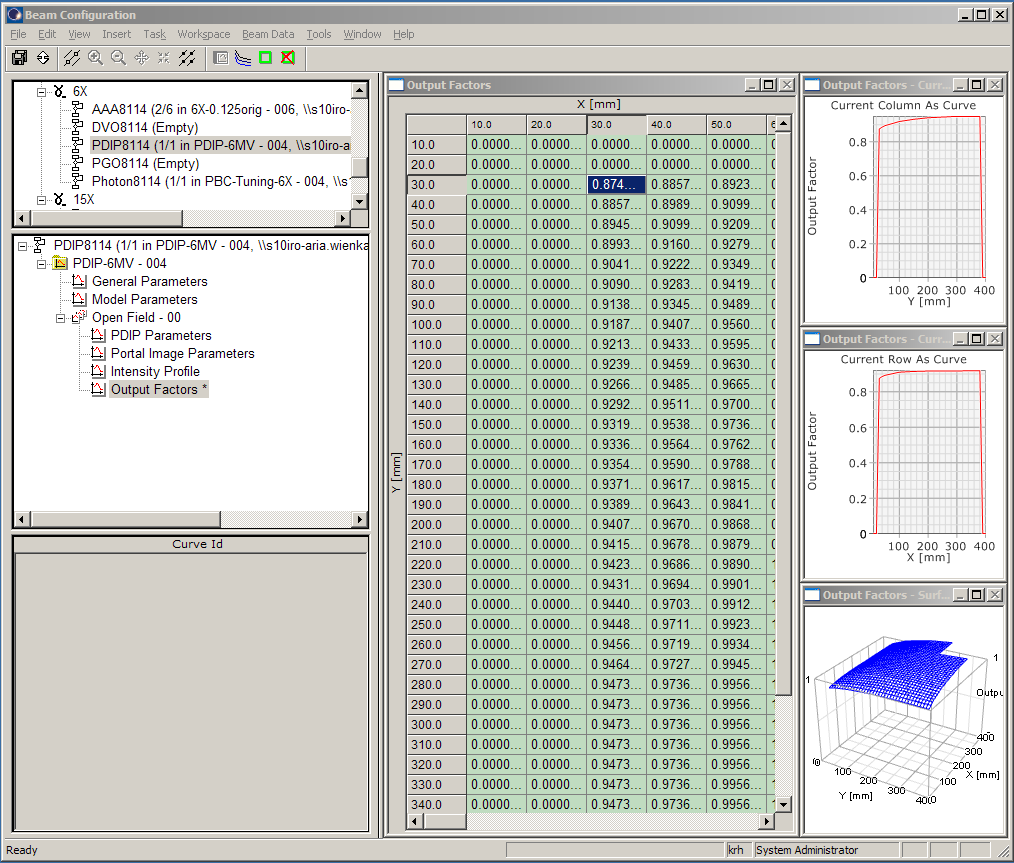
insert new beam data depth of profile still missing export measured dose to ascii enter image parameters insert new intensity profile this is taken from PBC copy shallowest profile paste it into PDIP enter distance from source import output factor file import actual fluence... ...select plan of test patient calculate beam data resulting 6 MV kernel resulting 15 MV kernel |