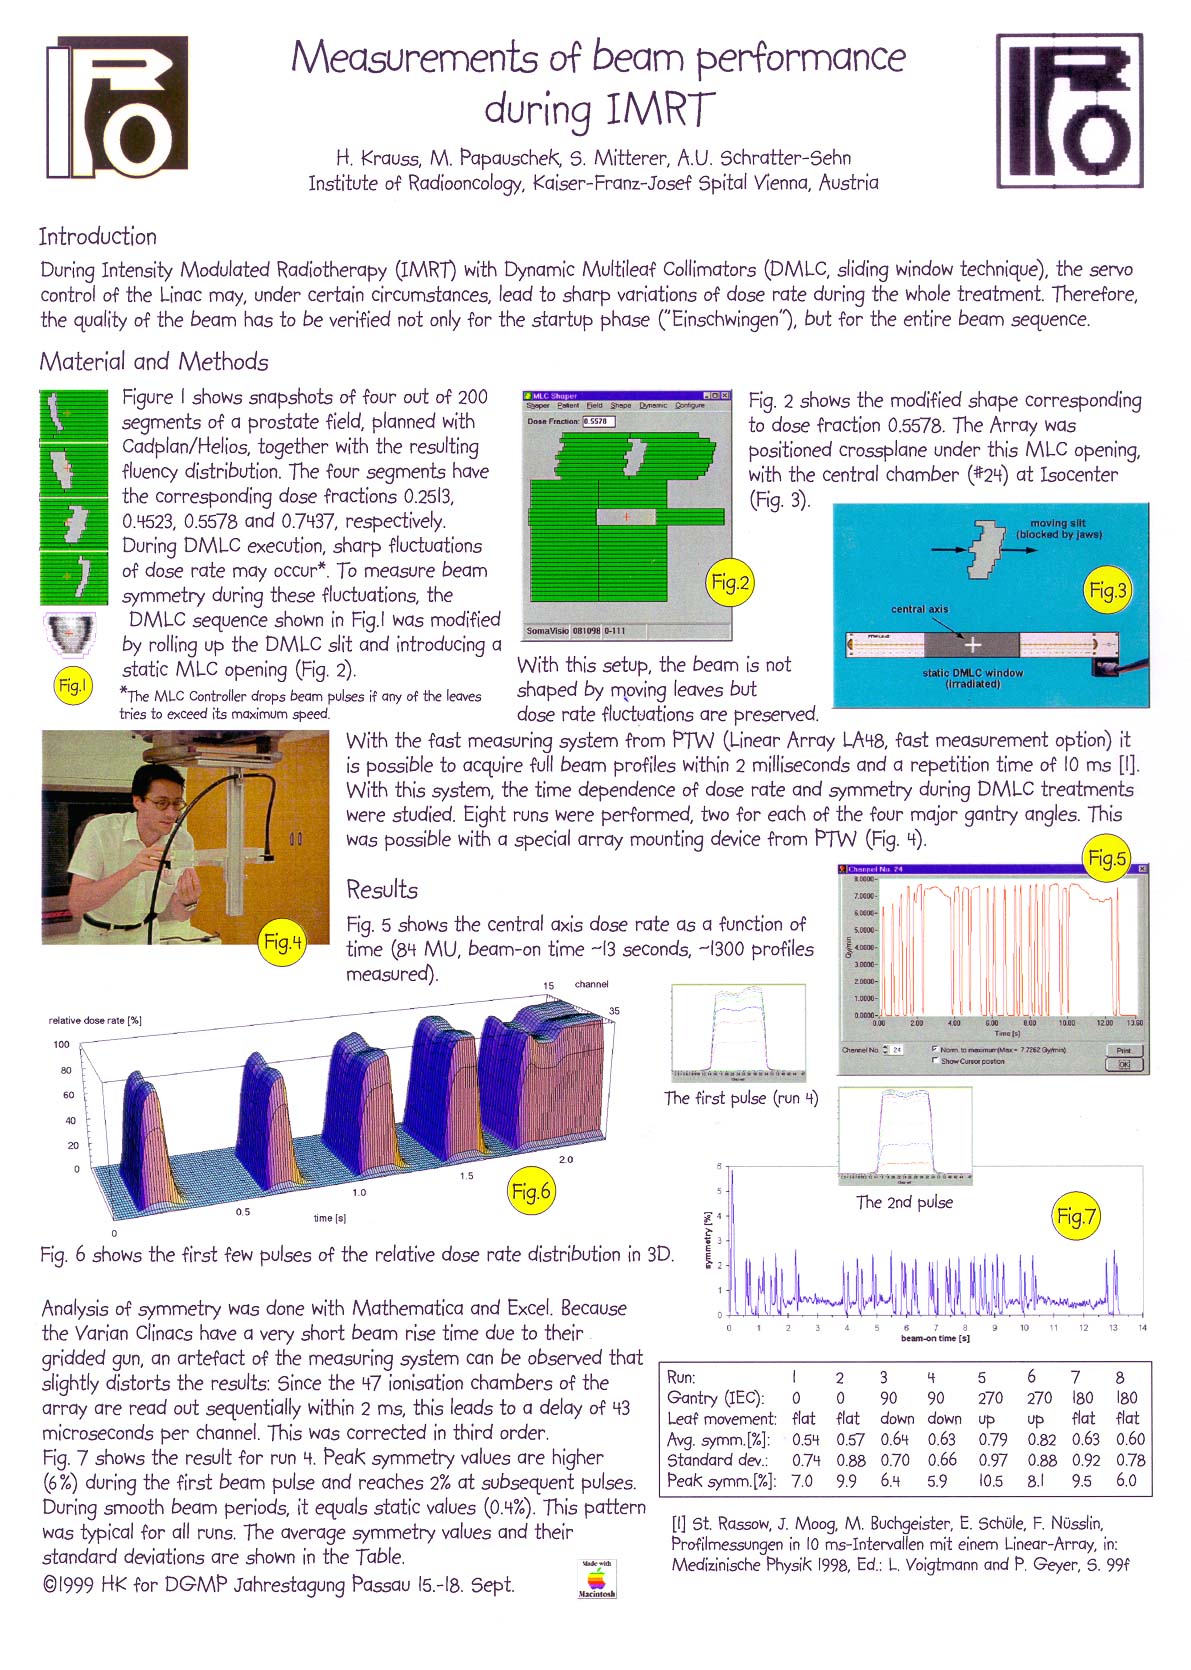
The first 8 peaks of an oscillating beam similar to the one shown in Fig.6 of the DGMP poster is animated in this movie loop. Hold-offs are responsible for the oscillating dose rate. In the cube, always 5 successive beam profiles are shown. This cage of 50ms propagates in time. Don't be confused by the rotating and tilting viewpoint. After a full turn (360deg) the loop starts again.
I was looking for a way to visualize long treatments. A 3D-plot like Fig.6 can never show a full DMLC treatment with high time resolution, because the plot would be several meters long. Fig.5 in the DGMP poster compresses the time axis too much.
This shows a similar measurement, but without rotating viewpoint. You may note that the very first peak after beam on is always quite asymmetric, because the servos have not taken control yet.